| Param | Original file | Final file |
|---|---|---|
| Filename | modeM0/AS1A11_047T15_9000004882_34174cztM0_level2.evt | modeM0/AS1A11_047T15_9000004882_34174cztM0_level2_quad_clean.evt |
| Size (bytes) | 504,293,760 | 75,412,800 |
| Size | 480.9 MB | 71.9 MB |
| Events in quadrant A | 2,591,386 | 489,147 |
| Events in quadrant B | 3,551,909 | 486,115 |
| Events in quadrant C | 4,685,695 | 485,196 |
| Events in quadrant D | 4,092,743 | 459,953 |
| Mode SS | |||
|---|---|---|---|
| Quadrant | BADHDUFLAG | Total packets | Discarded packets |
| A | 0 | 106 | 0 |
| B | 0 | 106 | 0 |
| C | 0 | 106 | 0 |
| D | 0 | 106 | 0 |
| Mode M9 | |||
|---|---|---|---|
| Quadrant | BADHDUFLAG | Total packets | Discarded packets |
| A | 0 | 31 | 0 |
| B | 0 | 31 | 0 |
| C | 0 | 31 | 0 |
| D | 0 | 32 | 0 |
| Mode M0 | |||
|---|---|---|---|
| Quadrant | BADHDUFLAG | Total packets | Discarded packets |
| A | 0 | 10962 | 3 |
| B | 0 | 13950 | 2 |
| C | 0 | 17614 | 2 |
| D | 0 | 15672 | 2 |
| Quadrant | Total seconds | Saturated seconds | Saturation percentage |
|---|---|---|---|
| A | 5182 | 9 | 0.173678% |
| B | 5182 | 249 | 4.805095% |
| C | 5182 | 355 | 6.850637% |
| D | 5182 | 78 | 1.505210% |
Noise dominated data is calculated using 1-second bins in cleaned event files. If a bin has >2000 counts, and if more than 50% of those come from <1% of pixels, then it is considered to be noise-dominated and hence unusable.
| Quadrant | # 1 sec bins | Bins with >0 counts | Bins with >2000 counts | High rate bins dominated by noise | Noise dominated (total time) | Noise dominated (detector-on time) | Marked lightcurve |
|---|---|---|---|---|---|---|---|
| A | 7067 | 5183 | 0 | 0 | 0.00% | 0.00% | 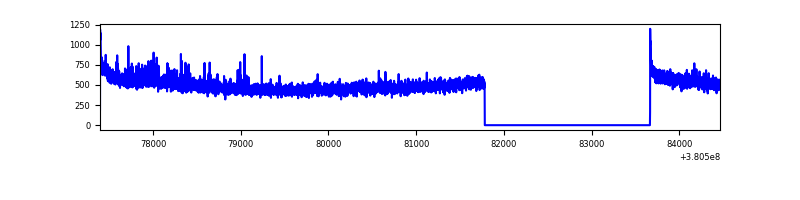 |
| B | 7067 | 5183 | 180 | 180 | 2.55% | 3.47% | 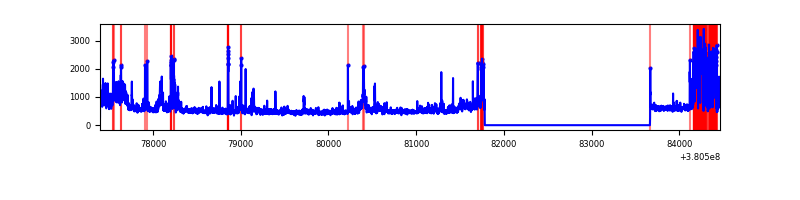 |
| C | 7067 | 5183 | 257 | 257 | 3.64% | 4.96% | 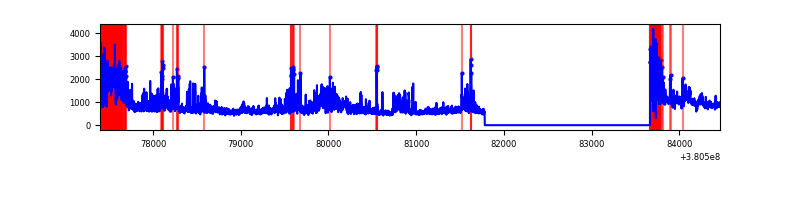 |
| D | 7067 | 5183 | 61 | 61 | 0.86% | 1.18% | 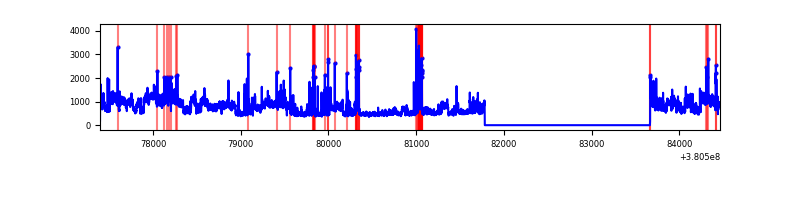 |
Top three noisy pixels from each quadrant. If the there are fewer than three noisy pixels in the level2.evt file, extra rows are filled as -1
| Pixel properties | Quadrant properties | ||||||
|---|---|---|---|---|---|---|---|
| Quadrant | DetID | PixID | Counts | Sigma | Mean | Median | Sigma |
| A | 15 | 169 | 50142 | 381.23 | 648 | 637 | 129.9 |
| A | 10 | 83 | 22675 | 169.71 | 648 | 637 | 129.9 |
| A | 13 | 6 | 12650 | 92.51 | 648 | 637 | 129.9 |
| B | 0 | 245 | 407349 | 3354.14 | 636 | 621 | 121.3 |
| B | 5 | 172 | 239546 | 1970.33 | 636 | 621 | 121.3 |
| B | 0 | 197 | 95021 | 778.48 | 636 | 621 | 121.3 |
| C | 0 | 239 | 1299401 | 9106.67 | 614 | 620 | 142.6 |
| C | 0 | 10 | 756616 | 5300.82 | 614 | 620 | 142.6 |
| C | 15 | 214 | 217362 | 1519.73 | 614 | 620 | 142.6 |
| D | 8 | 195 | 1180191 | 7671.59 | 629 | 613 | 153.8 |
| D | 10 | 118 | 177002 | 1147.18 | 629 | 613 | 153.8 |
| D | 2 | 120 | 70564 | 454.94 | 629 | 613 | 153.8 |
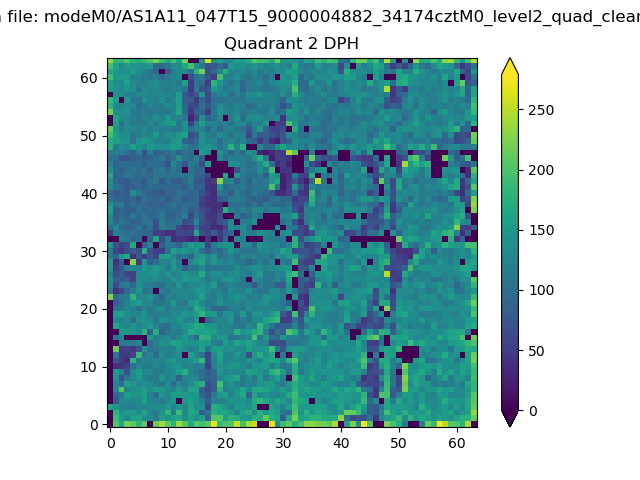
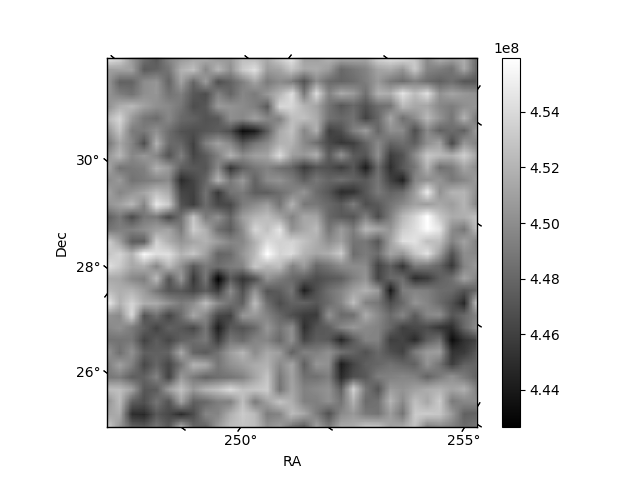
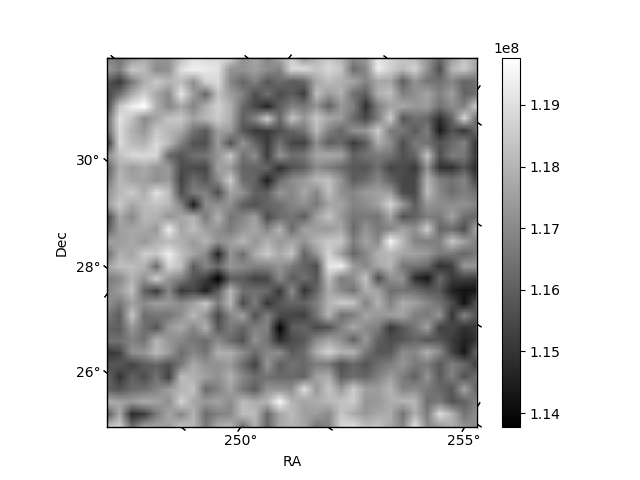
Histogram calculated using DETX and DETY for each event in the final _common_clean file
| Quadrant A | 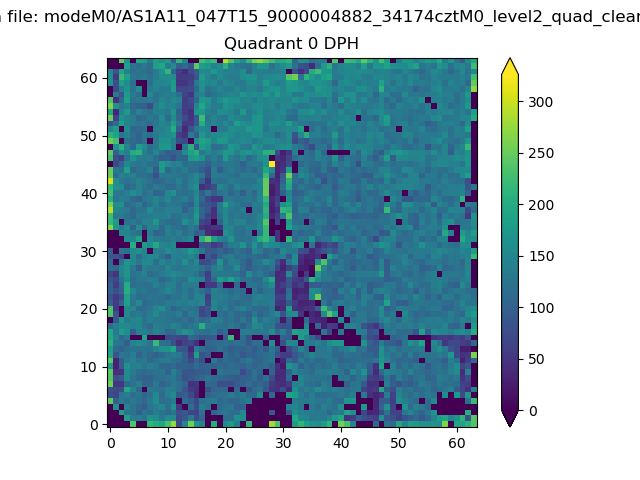 |
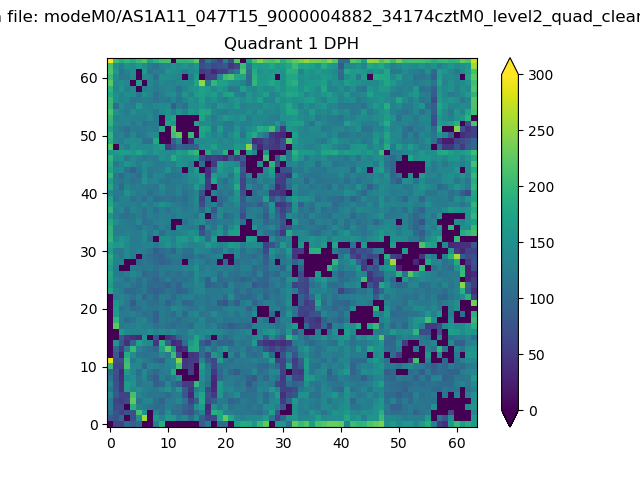 |
Quadrant B |
|---|---|---|---|
| Quadrant D | 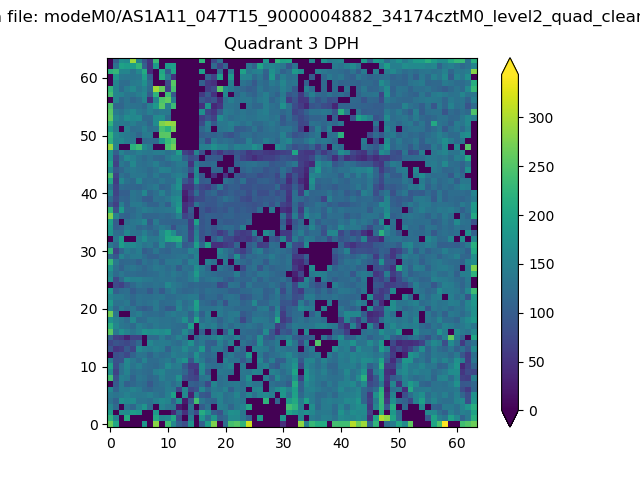 |
 |
Quadrant C |
| Plot type | Count rate plots | Images |
|---|---|---|
| Comparison with Poisson distribution Blue bars denote a histogram of data divided into 1 sec bins. Red curve is a Poisson curve with rate = median count rate of data. |
 |
 |
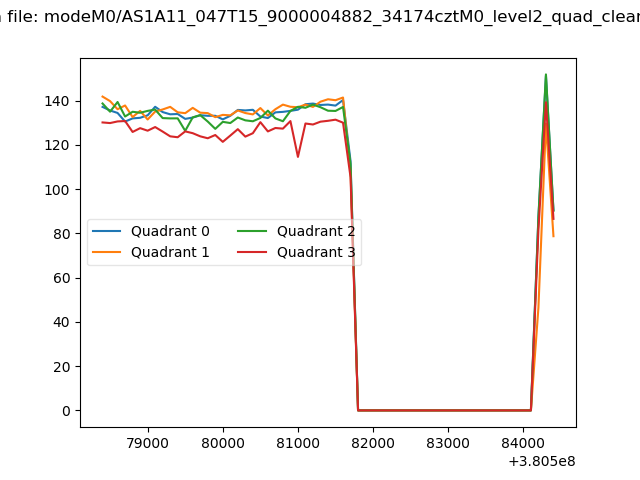
| Quadrant-wise count rates Data is divided into 100 sec bins |
 |
|
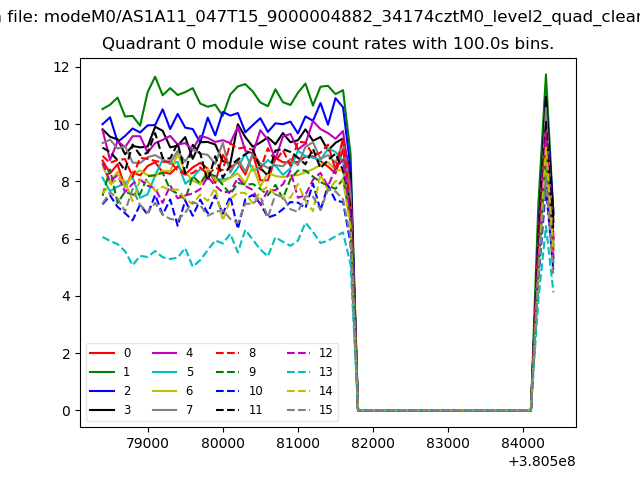
| Module-wise count rates for Quadrant A Data is divided into 100 sec bins |
 |
 |
| Module-wise count rates for Quadrant B Data is divided into 100 sec bins |
 |
 |
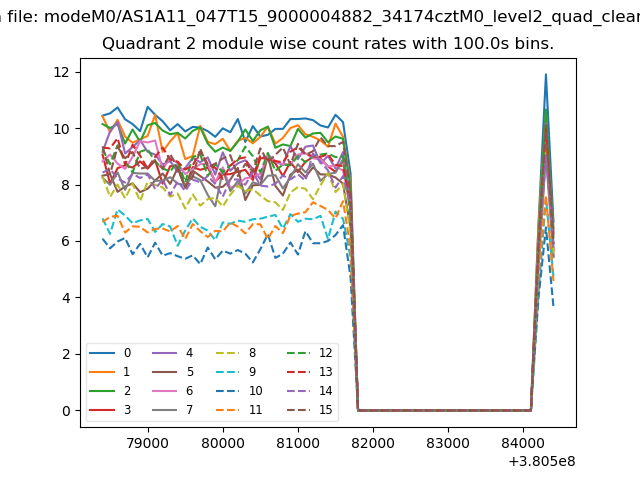
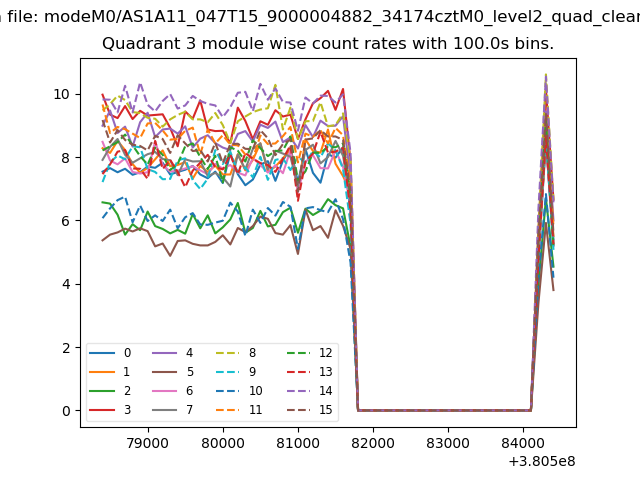
| Module-wise count rates for Quadrant C Data is divided into 100 sec bins |
 |
 |
| Module-wise count rates for Quadrant D Data is divided into 100 sec bins |
 |
 |
| Parameter | Plot |
|---|---|
| CZT HV Monitor |  |
| D_VDD |  |
| Temperature 1 | 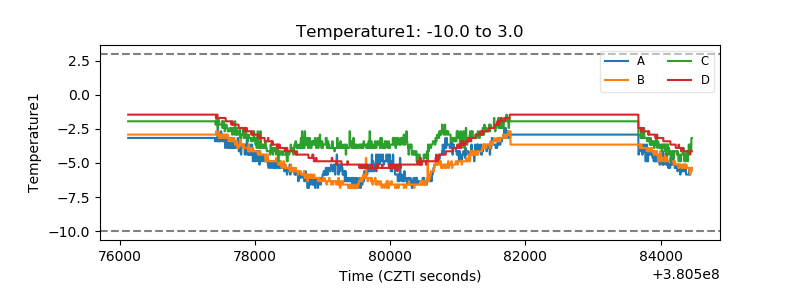 |
| Veto HV Monitor | 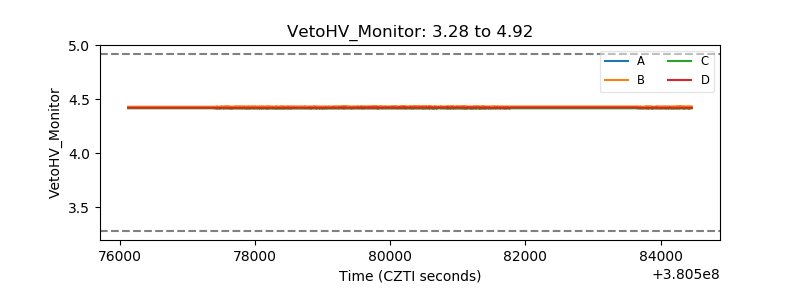 |
| Veto LLD | 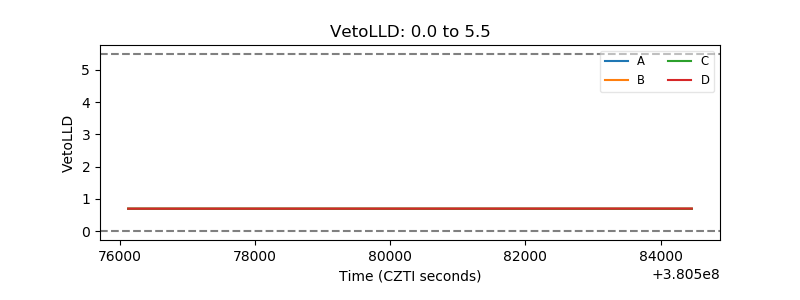 |
| Alpha Counter | 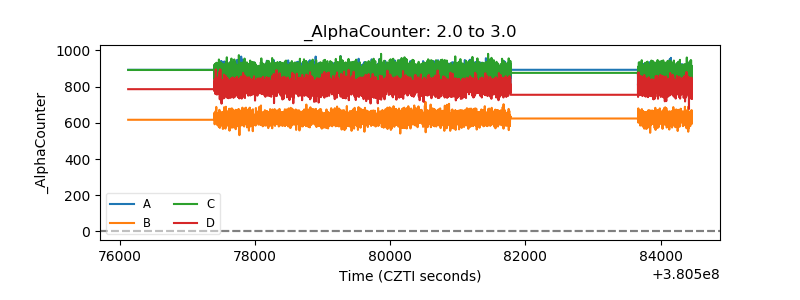 |
| _CPM_Rate | 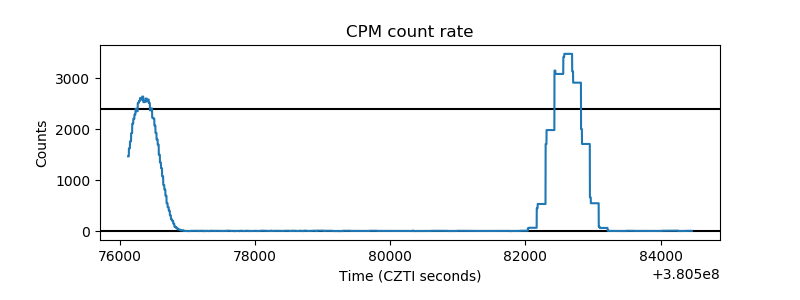 |
| CZT Counter | 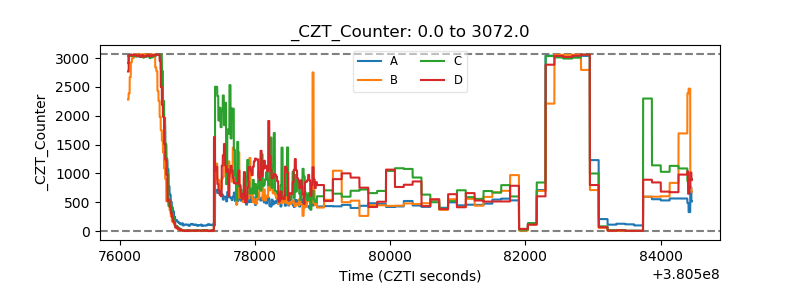 |
| +2.5 Volts monitor |  |
| +5 Volts monitor |  |
| _ROLL_ROT | 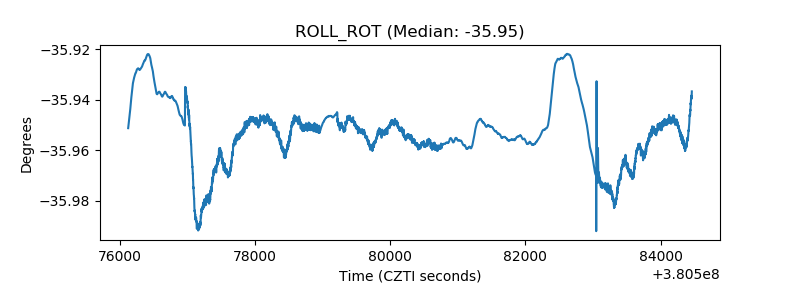 |
| _Roll_DEC | 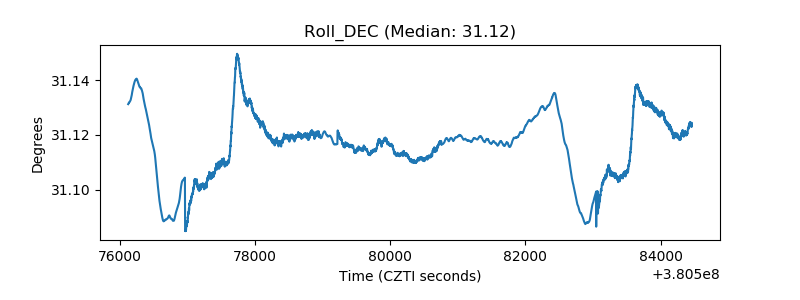 |
| _Roll_RA | 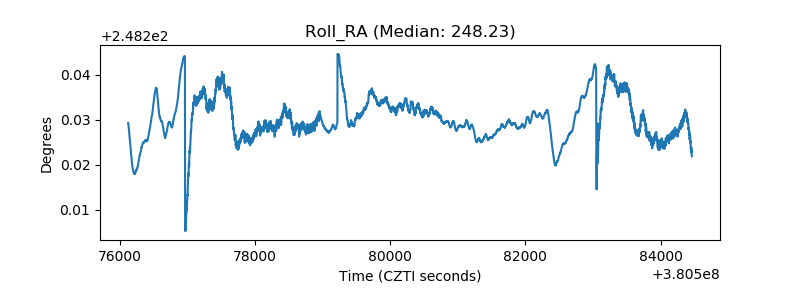 |
| Veto Counter | 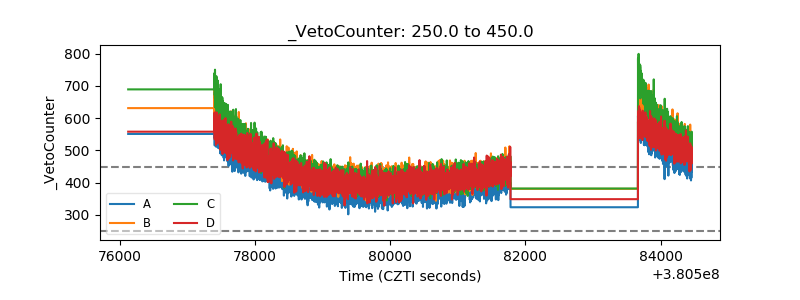 |