| Param | Original file | Final file |
|---|---|---|
| Filename | modeM0/AS1A11_047T15_9000004882_34176cztM0_level2.evt | modeM0/AS1A11_047T15_9000004882_34176cztM0_level2_quad_clean.evt |
| Size (bytes) | 423,167,040 | 95,558,400 |
| Size | 403.6 MB | 91.1 MB |
| Events in quadrant A | 2,459,537 | 647,137 |
| Events in quadrant B | 2,895,450 | 659,940 |
| Events in quadrant C | 3,424,429 | 641,984 |
| Events in quadrant D | 3,699,075 | 596,937 |
| Mode SS | |||
|---|---|---|---|
| Quadrant | BADHDUFLAG | Total packets | Discarded packets |
| A | 0 | 100 | 0 |
| B | 0 | 100 | 0 |
| C | 0 | 100 | 0 |
| D | 0 | 100 | 0 |
| Mode M9 | |||
|---|---|---|---|
| Quadrant | BADHDUFLAG | Total packets | Discarded packets |
| A | 0 | 31 | 0 |
| B | 0 | 31 | 0 |
| C | 0 | 31 | 0 |
| D | 0 | 32 | 0 |
| Mode M0 | |||
|---|---|---|---|
| Quadrant | BADHDUFLAG | Total packets | Discarded packets |
| A | 0 | 10248 | 3 |
| B | 0 | 11727 | 2 |
| C | 0 | 13449 | 2 |
| D | 0 | 14337 | 2 |
| Quadrant | Total seconds | Saturated seconds | Saturation percentage |
|---|---|---|---|
| A | 4967 | 4 | 0.080532% |
| B | 4967 | 68 | 1.369036% |
| C | 4967 | 149 | 2.999799% |
| D | 4967 | 143 | 2.879001% |
Noise dominated data is calculated using 1-second bins in cleaned event files. If a bin has >2000 counts, and if more than 50% of those come from <1% of pixels, then it is considered to be noise-dominated and hence unusable.
| Quadrant | # 1 sec bins | Bins with >0 counts | Bins with >2000 counts | High rate bins dominated by noise | Noise dominated (total time) | Noise dominated (detector-on time) | Marked lightcurve |
|---|---|---|---|---|---|---|---|
| A | 7060 | 4968 | 0 | 0 | 0.00% | 0.00% | 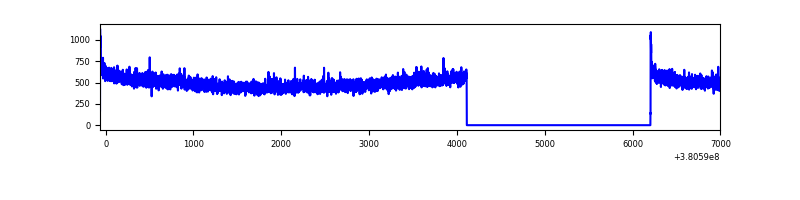 |
| B | 7060 | 4968 | 32 | 32 | 0.45% | 0.64% | 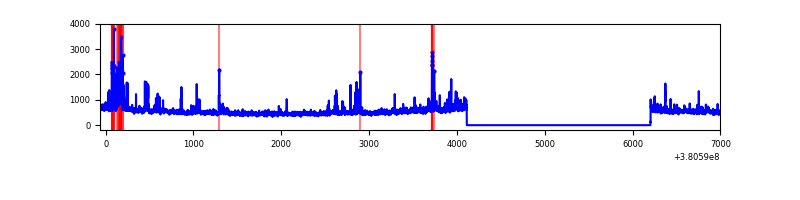 |
| C | 7060 | 4968 | 111 | 111 | 1.57% | 2.23% | 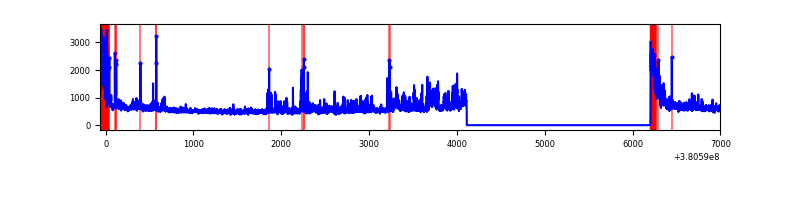 |
| D | 7060 | 4968 | 118 | 118 | 1.67% | 2.38% | 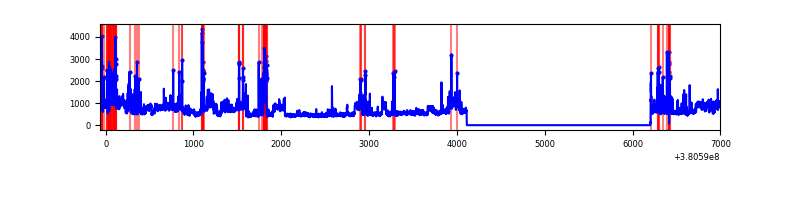 |
Top three noisy pixels from each quadrant. If the there are fewer than three noisy pixels in the level2.evt file, extra rows are filled as -1
| Pixel properties | Quadrant properties | ||||||
|---|---|---|---|---|---|---|---|
| Quadrant | DetID | PixID | Counts | Sigma | Mean | Median | Sigma |
| A | 10 | 83 | 21183 | 164.03 | 626 | 616 | 125.4 |
| A | 13 | 6 | 19989 | 154.51 | 626 | 616 | 125.4 |
| A | 13 | 254 | 9116 | 67.79 | 626 | 616 | 125.4 |
| B | 5 | 172 | 232844 | 1968.88 | 625 | 612 | 118.0 |
| B | 4 | 232 | 73371 | 616.86 | 625 | 612 | 118.0 |
| B | 0 | 219 | 42427 | 354.51 | 625 | 612 | 118.0 |
| C | 0 | 239 | 513485 | 3713.39 | 602 | 610 | 138.1 |
| C | 0 | 10 | 317626 | 2295.3 | 602 | 610 | 138.1 |
| C | 15 | 214 | 219182 | 1582.53 | 602 | 610 | 138.1 |
| D | 8 | 195 | 669553 | 4238.27 | 590 | 578 | 157.8 |
| D | 7 | 223 | 199965 | 1263.21 | 590 | 578 | 157.8 |
| D | 10 | 118 | 142995 | 902.28 | 590 | 578 | 157.8 |
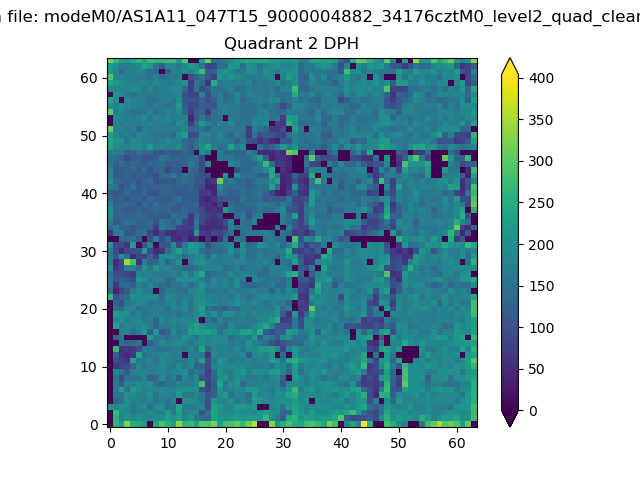
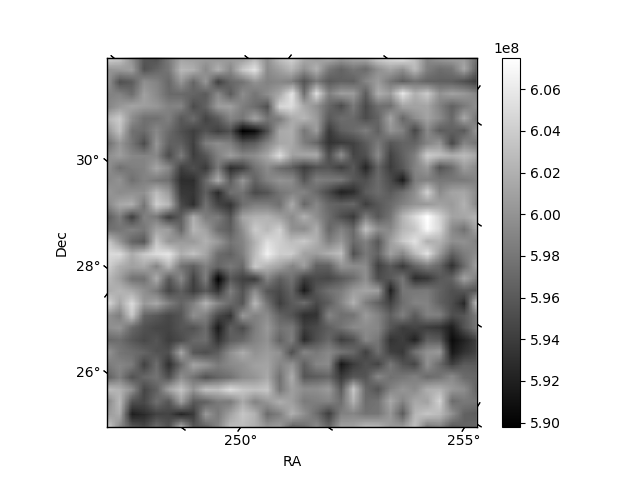
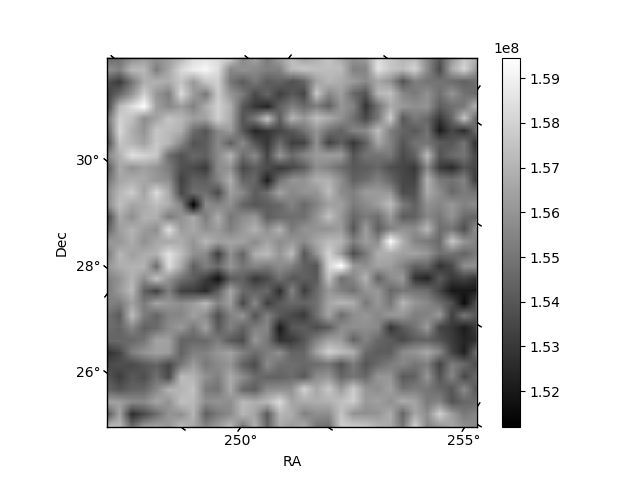
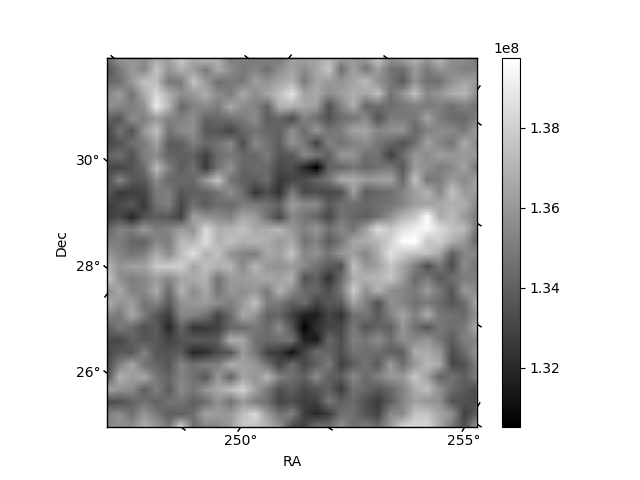
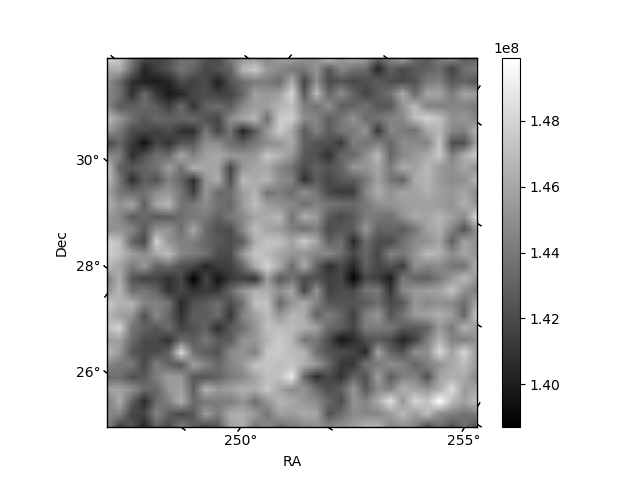
Histogram calculated using DETX and DETY for each event in the final _common_clean file
| Quadrant A | 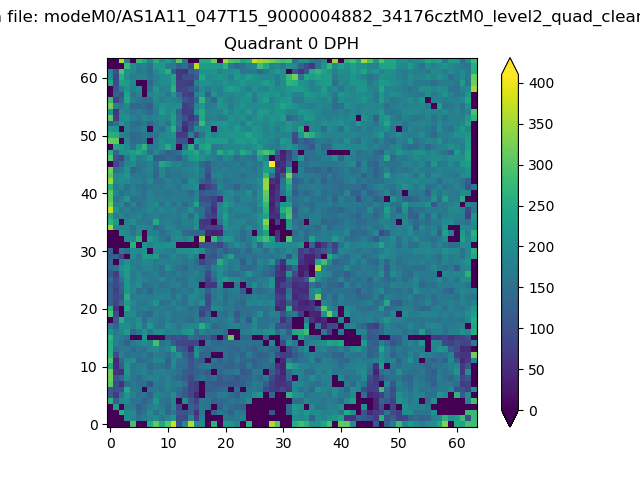 |
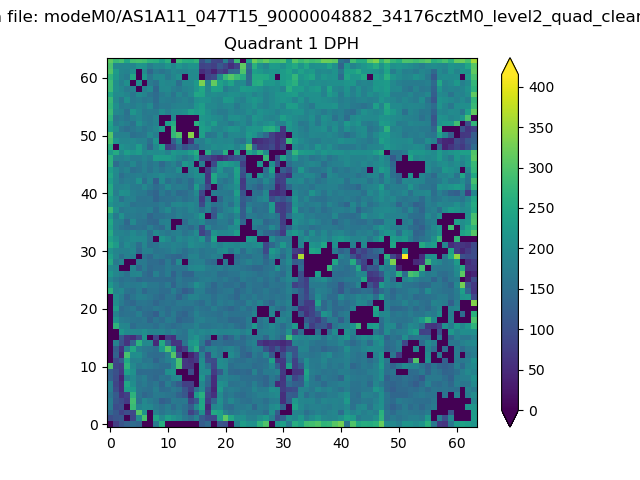 |
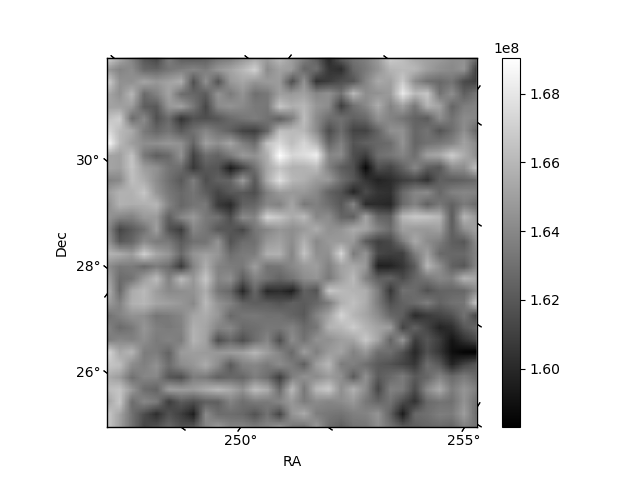
Quadrant B |
|---|---|---|---|
| Quadrant D | 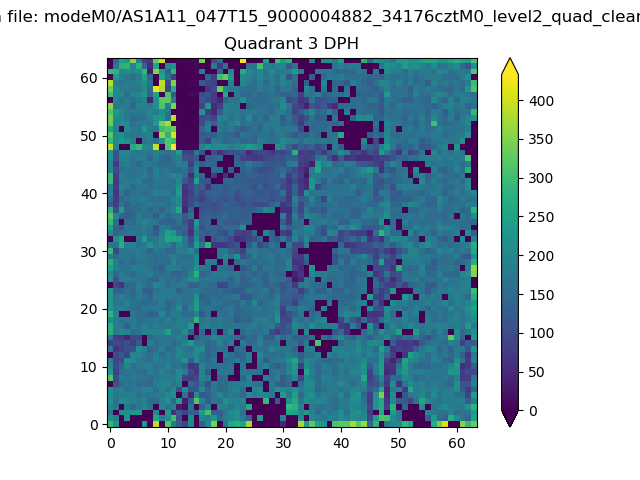 |
 |
Quadrant C |
| Plot type | Count rate plots | Images |
|---|---|---|
| Comparison with Poisson distribution Blue bars denote a histogram of data divided into 1 sec bins. Red curve is a Poisson curve with rate = median count rate of data. |
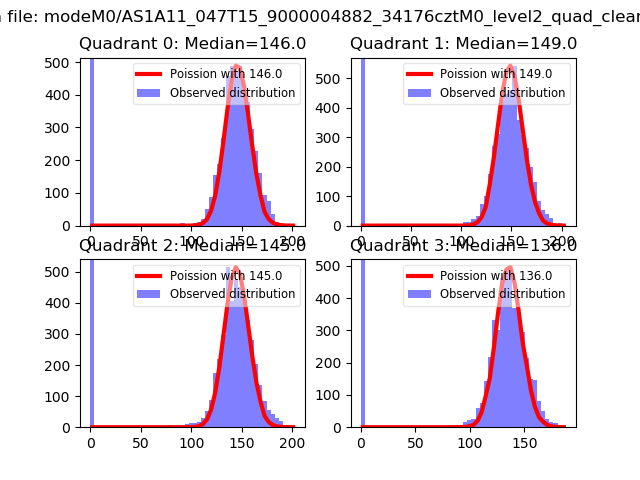 |
 |
| Quadrant-wise count rates Data is divided into 100 sec bins |
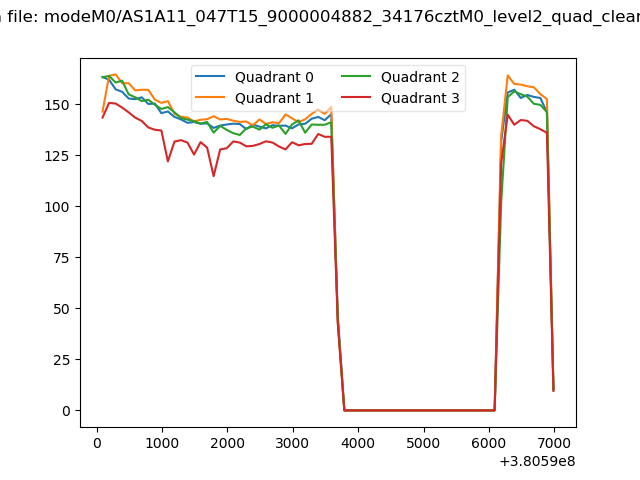 |
|
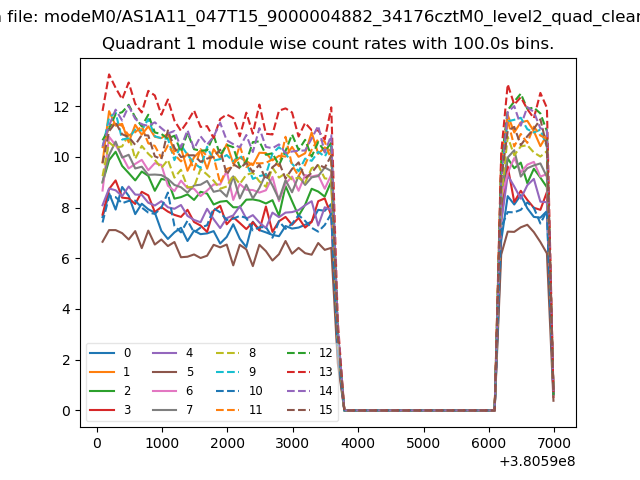
| Module-wise count rates for Quadrant A Data is divided into 100 sec bins |
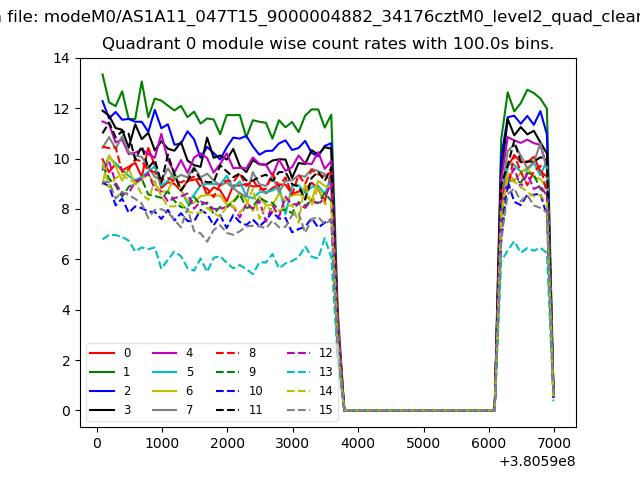 |
 |
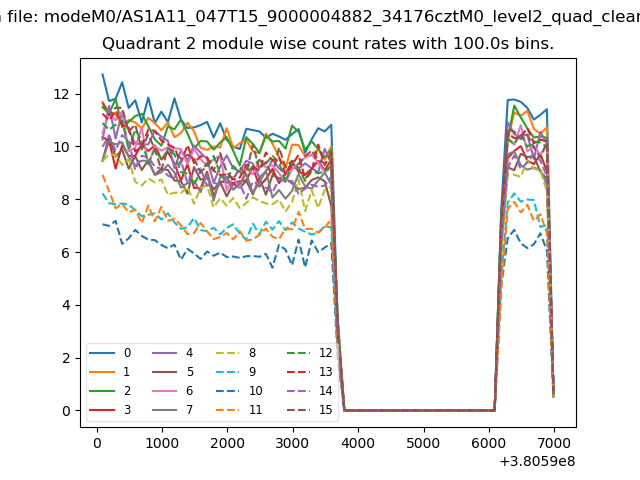
| Module-wise count rates for Quadrant B Data is divided into 100 sec bins |
 |
 |
| Module-wise count rates for Quadrant C Data is divided into 100 sec bins |
 |
 |
| Module-wise count rates for Quadrant D Data is divided into 100 sec bins |
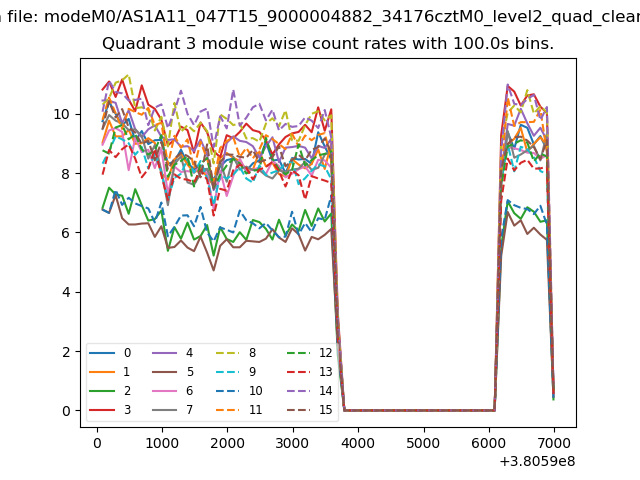 |
 |
| Parameter | Plot |
|---|---|
| CZT HV Monitor | 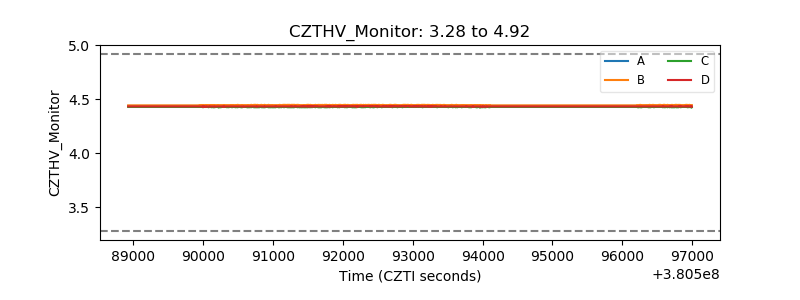 |
| D_VDD | 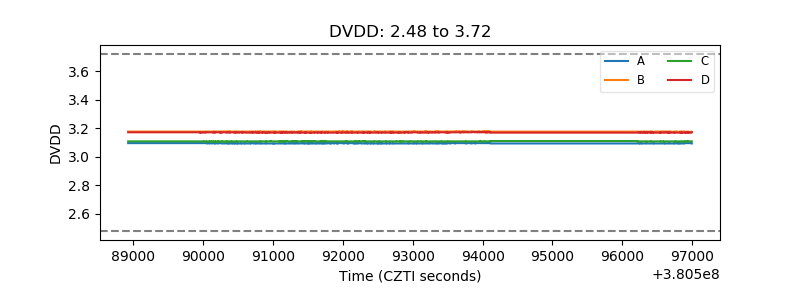 |
| Temperature 1 | 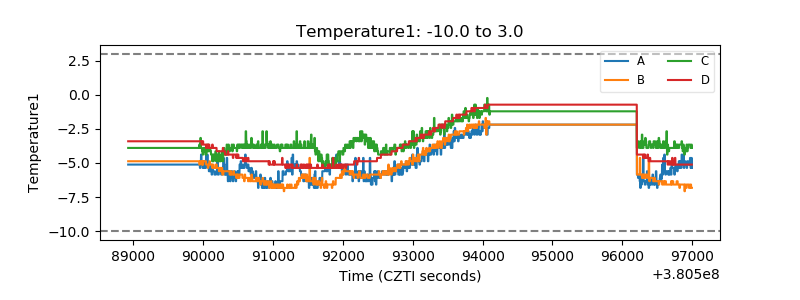 |
| Veto HV Monitor | 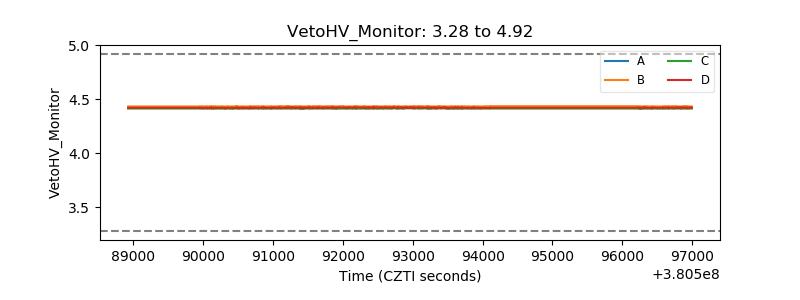 |
| Veto LLD | 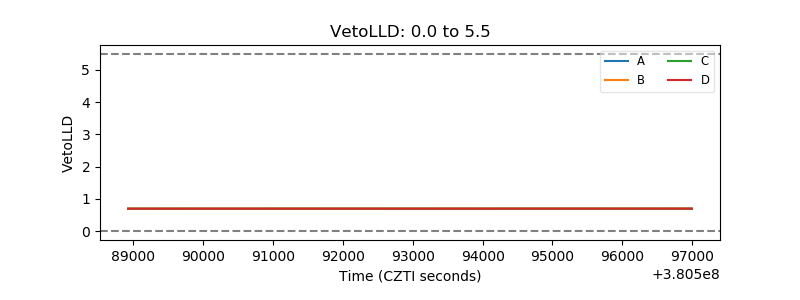 |
| Alpha Counter | 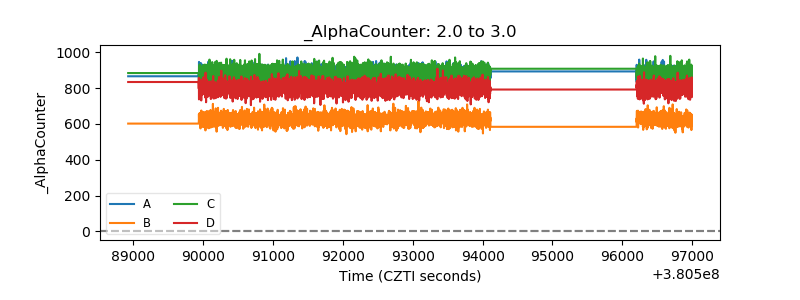 |
| _CPM_Rate | 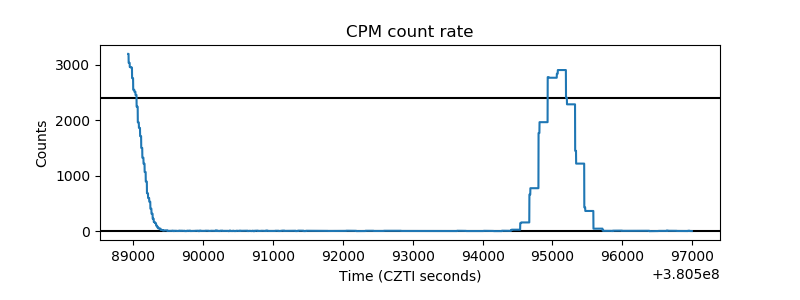 |
| CZT Counter | 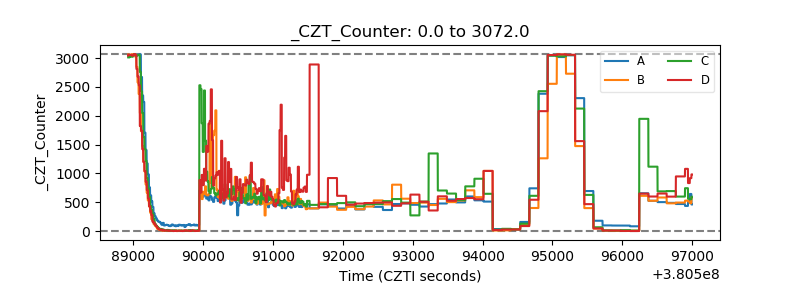 |
| +2.5 Volts monitor |  |
| +5 Volts monitor |  |
| _ROLL_ROT | 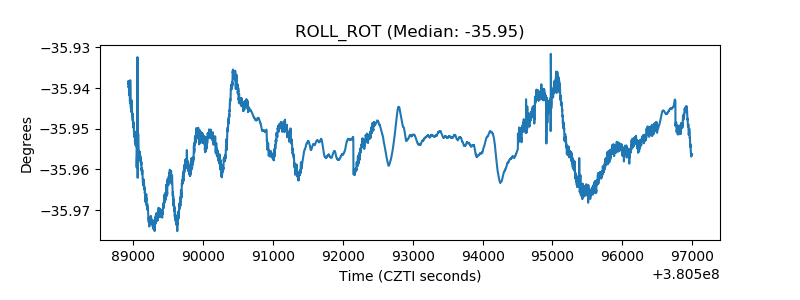 |
| _Roll_DEC | 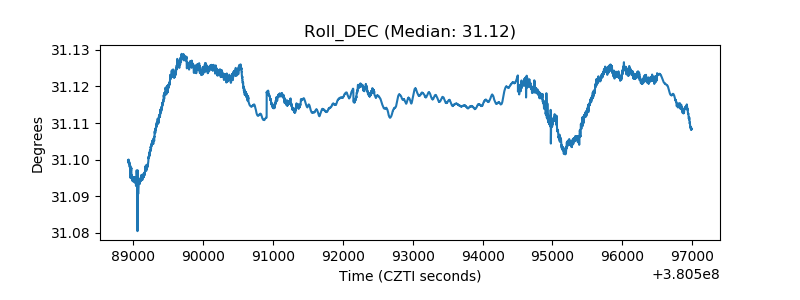 |
| _Roll_RA | 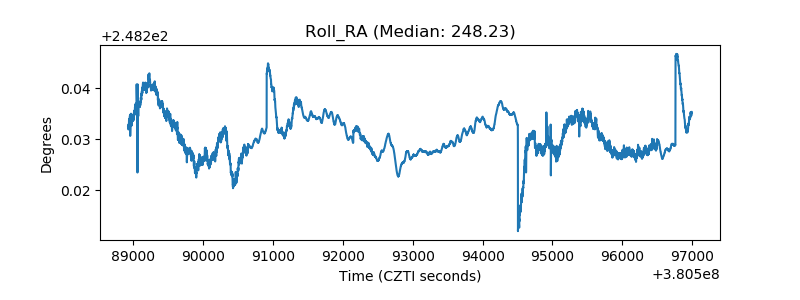 |
| Veto Counter | 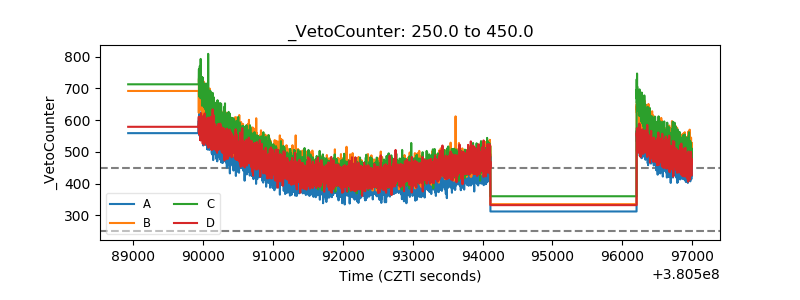 |