| Param | Original file | Final file |
|---|---|---|
| Filename | modeM0/AS1A11_047T15_9000004882_34177cztM0_level2.evt | modeM0/AS1A11_047T15_9000004882_34177cztM0_level2_quad_clean.evt |
| Size (bytes) | 480,548,160 | 92,393,280 |
| Size | 458.3 MB | 88.1 MB |
| Events in quadrant A | 2,500,041 | 628,930 |
| Events in quadrant B | 3,356,255 | 638,453 |
| Events in quadrant C | 4,041,517 | 601,756 |
| Events in quadrant D | 4,301,786 | 563,302 |
| Mode SS | |||
|---|---|---|---|
| Quadrant | BADHDUFLAG | Total packets | Discarded packets |
| A | 0 | 108 | 0 |
| B | 0 | 108 | 0 |
| C | 0 | 108 | 0 |
| D | 0 | 108 | 0 |
| Mode M9 | |||
|---|---|---|---|
| Quadrant | BADHDUFLAG | Total packets | Discarded packets |
| A | 0 | 31 | 0 |
| B | 0 | 31 | 0 |
| C | 0 | 31 | 0 |
| D | 0 | 32 | 0 |
| Mode M0 | |||
|---|---|---|---|
| Quadrant | BADHDUFLAG | Total packets | Discarded packets |
| A | 0 | 10638 | 3 |
| B | 0 | 13259 | 2 |
| C | 0 | 15470 | 2 |
| D | 0 | 16331 | 2 |
| Quadrant | Total seconds | Saturated seconds | Saturation percentage |
|---|---|---|---|
| A | 5212 | 7 | 0.134305% |
| B | 5212 | 223 | 4.278588% |
| C | 5212 | 252 | 4.834996% |
| D | 5212 | 236 | 4.528012% |
Noise dominated data is calculated using 1-second bins in cleaned event files. If a bin has >2000 counts, and if more than 50% of those come from <1% of pixels, then it is considered to be noise-dominated and hence unusable.
| Quadrant | # 1 sec bins | Bins with >0 counts | Bins with >2000 counts | High rate bins dominated by noise | Noise dominated (total time) | Noise dominated (detector-on time) | Marked lightcurve |
|---|---|---|---|---|---|---|---|
| A | 7367 | 5213 | 0 | 0 | 0.00% | 0.00% | 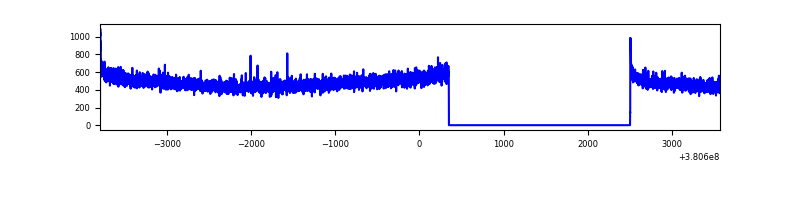 |
| B | 7367 | 5213 | 134 | 134 | 1.82% | 2.57% | 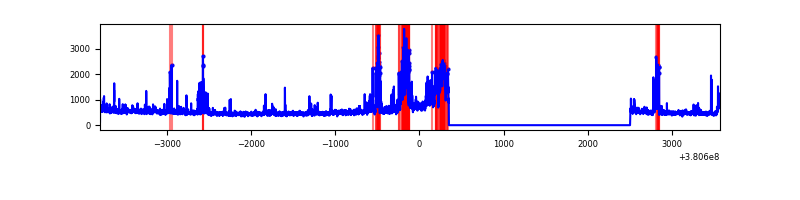 |
| C | 7367 | 5213 | 230 | 230 | 3.12% | 4.41% | 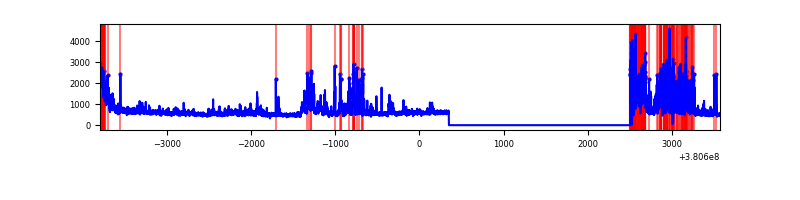 |
| D | 7367 | 5213 | 212 | 212 | 2.88% | 4.07% | 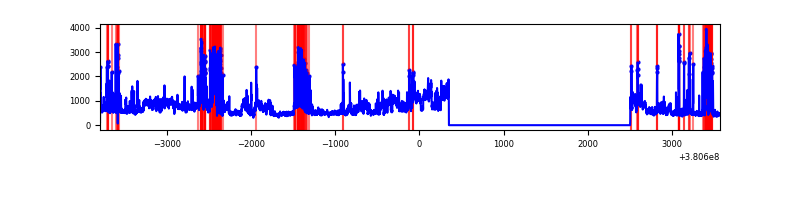 |
Top three noisy pixels from each quadrant. If the there are fewer than three noisy pixels in the level2.evt file, extra rows are filled as -1
| Pixel properties | Quadrant properties | ||||||
|---|---|---|---|---|---|---|---|
| Quadrant | DetID | PixID | Counts | Sigma | Mean | Median | Sigma |
| A | 10 | 83 | 21013 | 159.57 | 637 | 626 | 127.8 |
| A | 13 | 6 | 17501 | 132.08 | 637 | 626 | 127.8 |
| A | 13 | 254 | 9640 | 70.55 | 637 | 626 | 127.8 |
| B | 5 | 172 | 320411 | 2666.2 | 629 | 614 | 119.9 |
| B | 5 | 31 | 202307 | 1681.55 | 629 | 614 | 119.9 |
| B | 0 | 229 | 79293 | 655.96 | 629 | 614 | 119.9 |
| C | 0 | 239 | 697734 | 4988.43 | 605 | 611 | 139.7 |
| C | 0 | 10 | 355545 | 2539.82 | 605 | 611 | 139.7 |
| C | 14 | 254 | 322779 | 2305.35 | 605 | 611 | 139.7 |
| D | 8 | 195 | 1015015 | 7016.8 | 595 | 579 | 144.6 |
| D | 10 | 118 | 692372 | 4785.09 | 595 | 579 | 144.6 |
| D | 2 | 120 | 72523 | 497.63 | 595 | 579 | 144.6 |
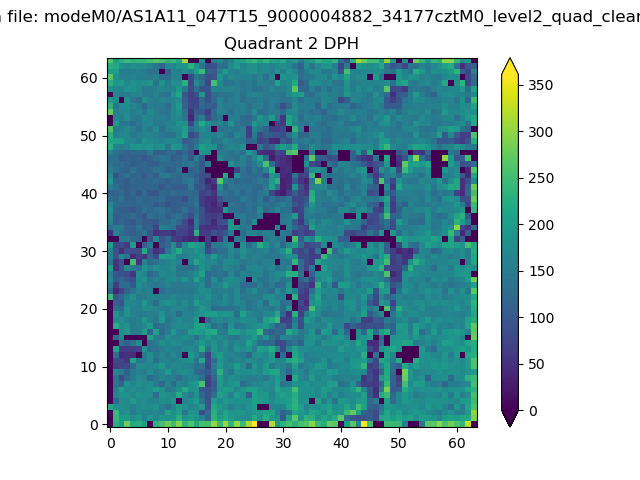
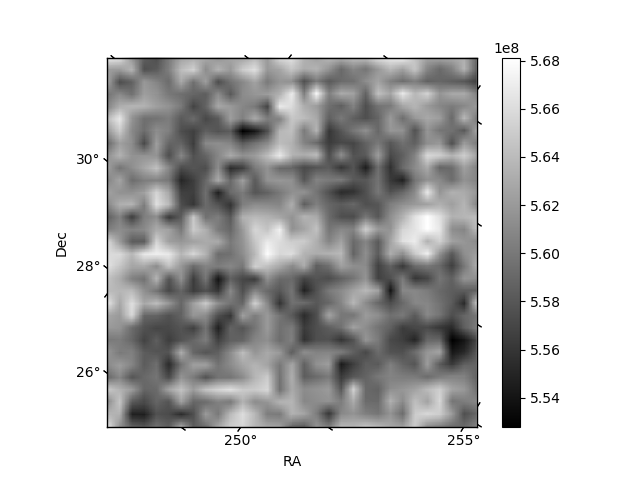
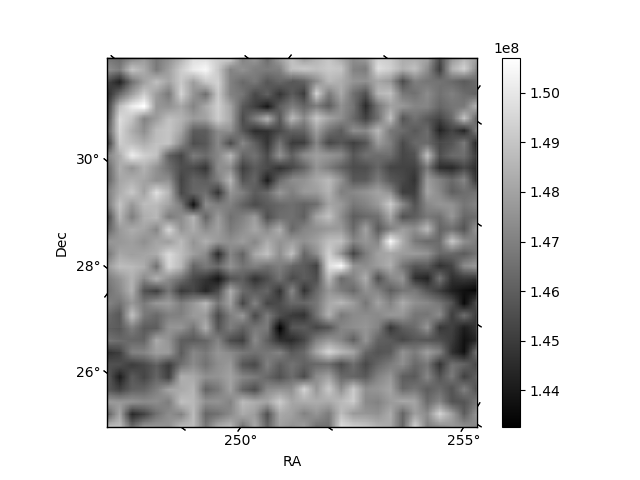
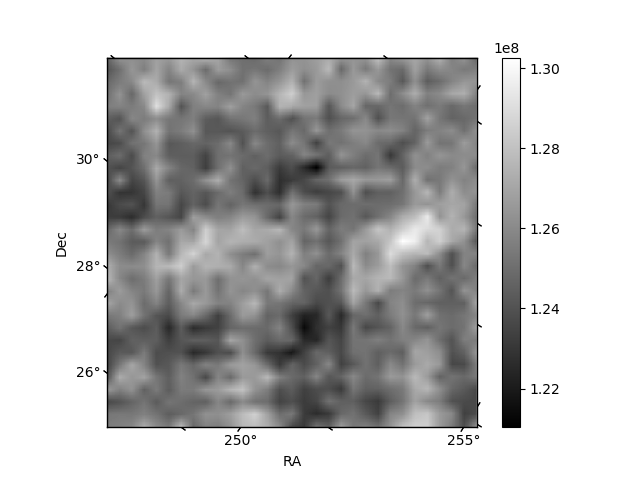
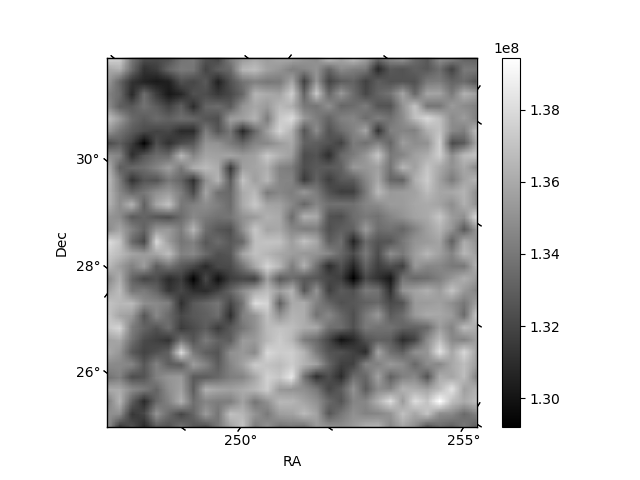
Histogram calculated using DETX and DETY for each event in the final _common_clean file
| Quadrant A | 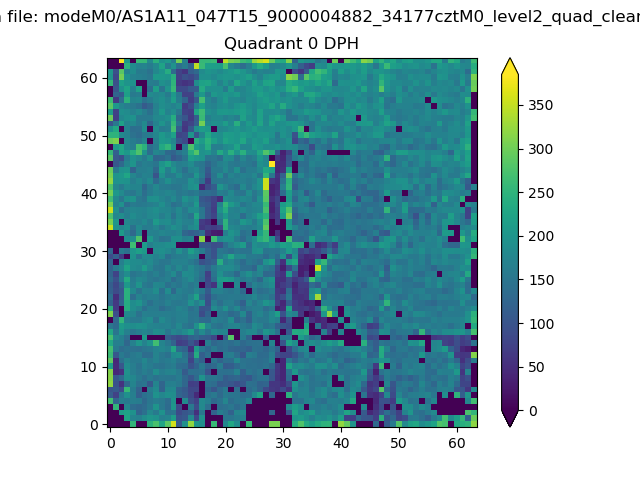 |
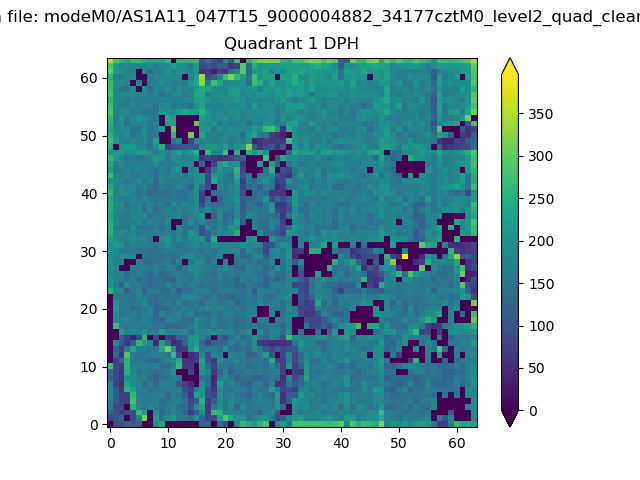 |
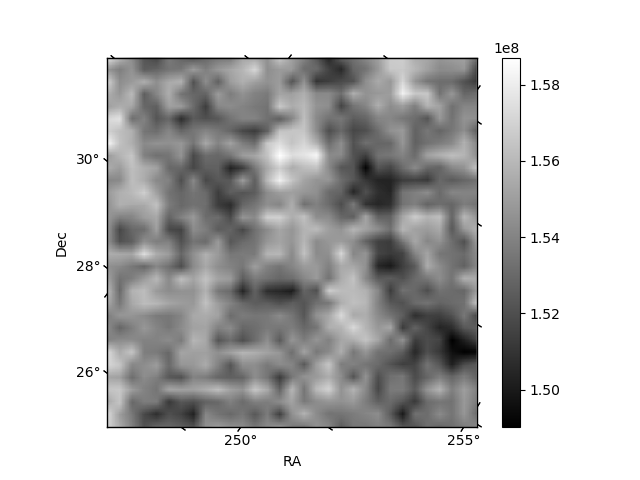
Quadrant B |
|---|---|---|---|
| Quadrant D | 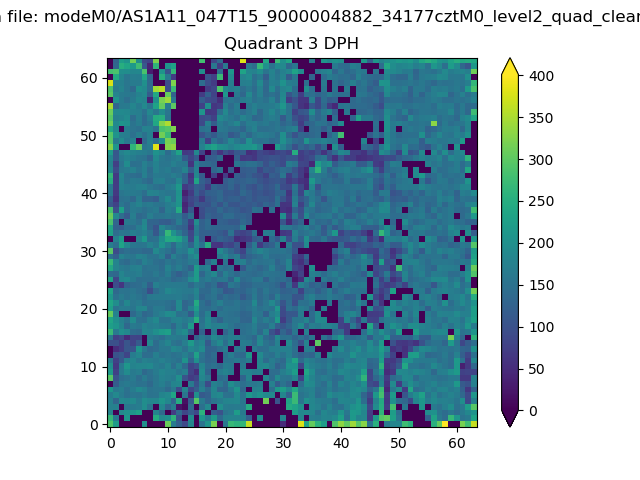 |
 |
Quadrant C |
| Plot type | Count rate plots | Images |
|---|---|---|
| Comparison with Poisson distribution Blue bars denote a histogram of data divided into 1 sec bins. Red curve is a Poisson curve with rate = median count rate of data. |
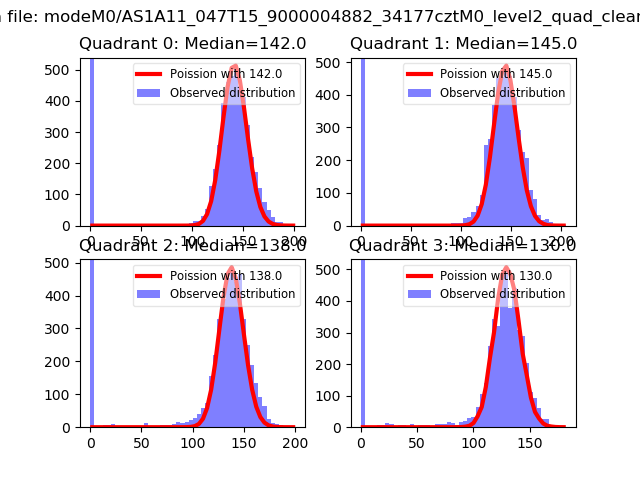 |
 |
| Quadrant-wise count rates Data is divided into 100 sec bins |
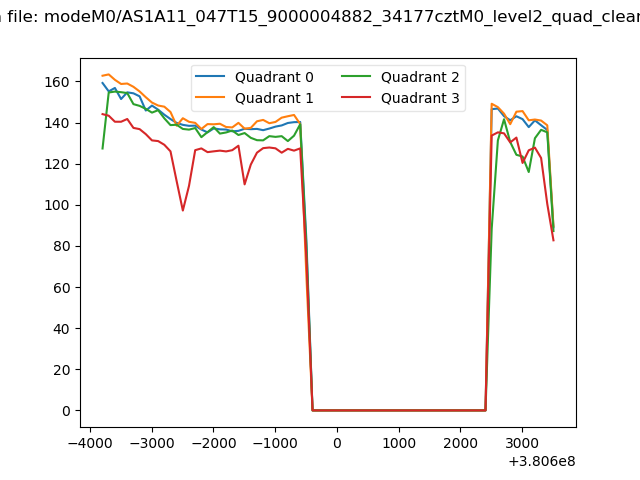 |
|
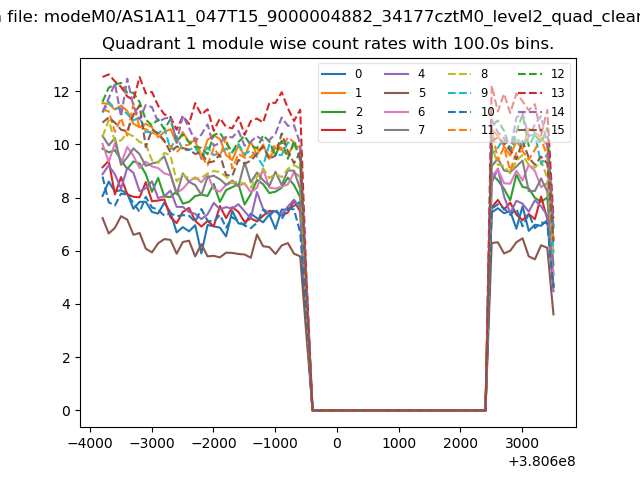
| Module-wise count rates for Quadrant A Data is divided into 100 sec bins |
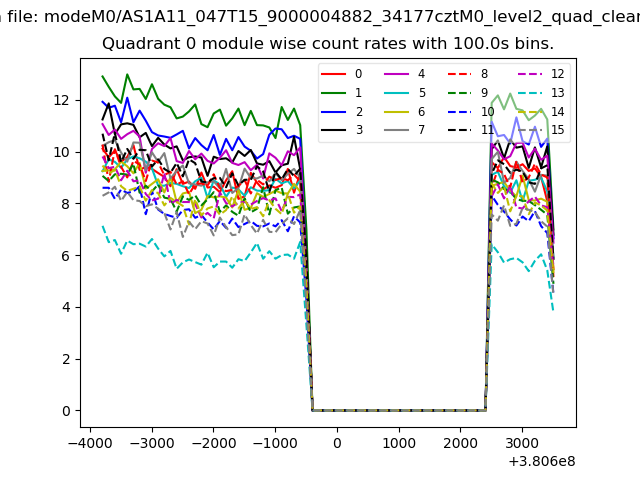 |
 |
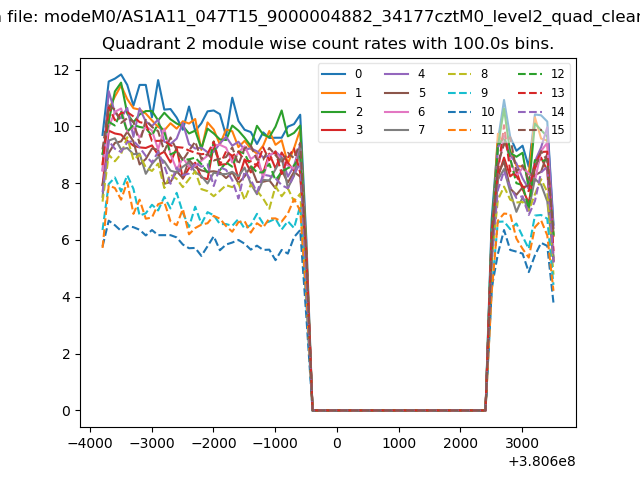
| Module-wise count rates for Quadrant B Data is divided into 100 sec bins |
 |
 |
| Module-wise count rates for Quadrant C Data is divided into 100 sec bins |
 |
 |
| Module-wise count rates for Quadrant D Data is divided into 100 sec bins |
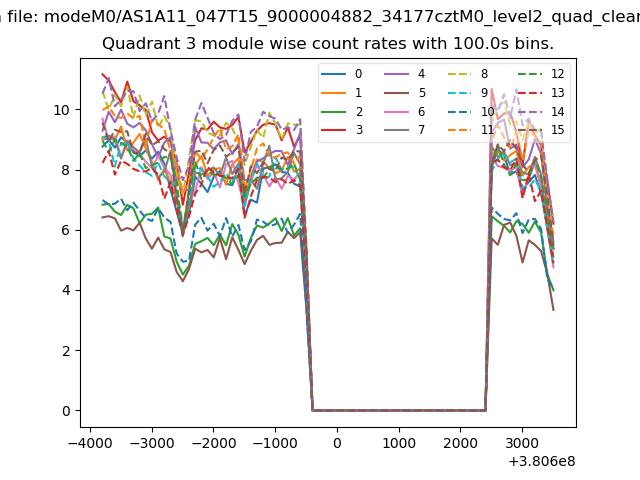 |
 |
| Parameter | Plot |
|---|---|
| CZT HV Monitor | 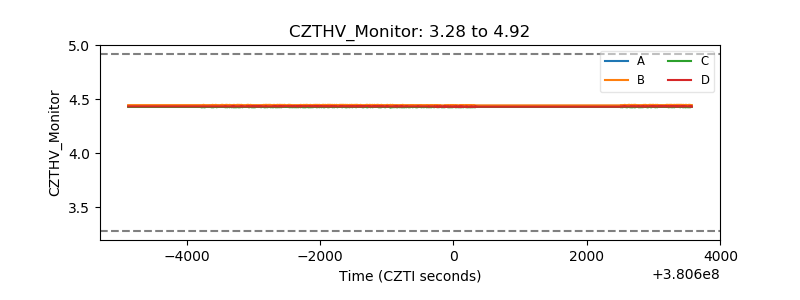 |
| D_VDD | 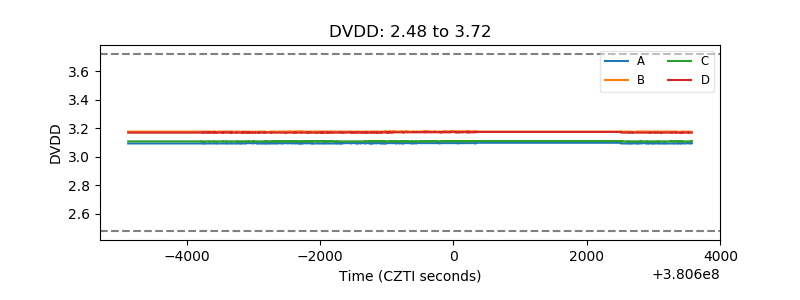 |
| Temperature 1 | 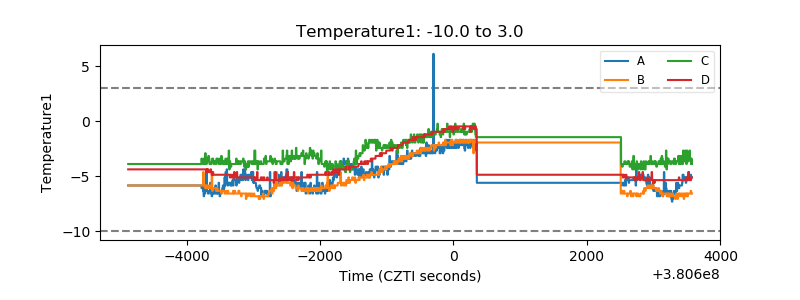 |
| Veto HV Monitor | 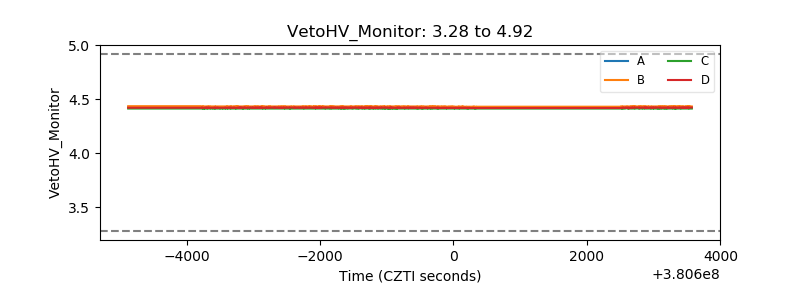 |
| Veto LLD | 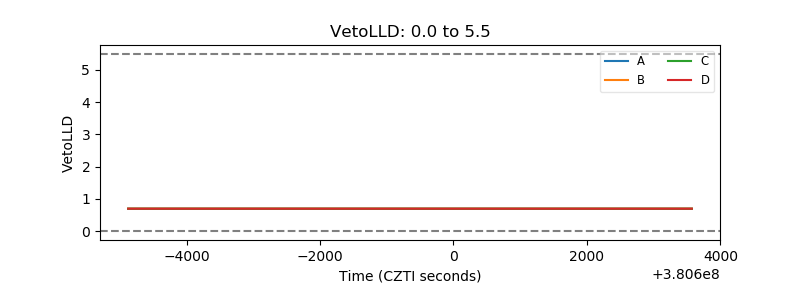 |
| Alpha Counter | 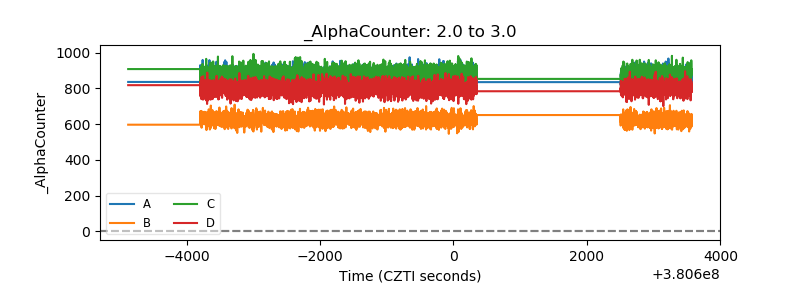 |
| _CPM_Rate | 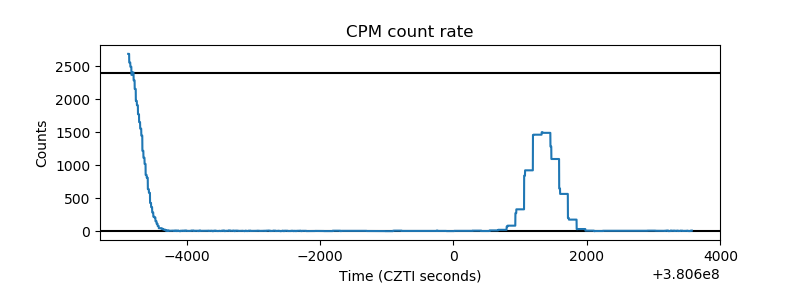 |
| CZT Counter | 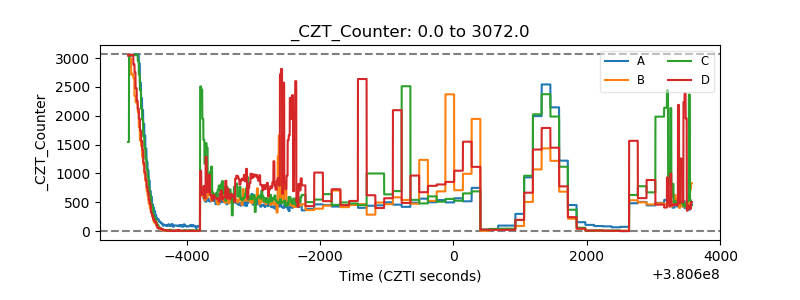 |
| +2.5 Volts monitor |  |
| +5 Volts monitor |  |
| _ROLL_ROT | 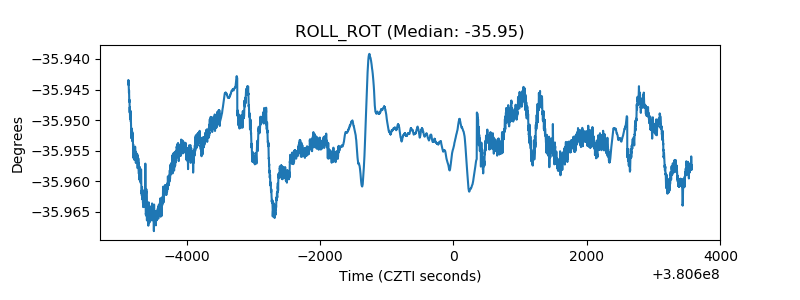 |
| _Roll_DEC | 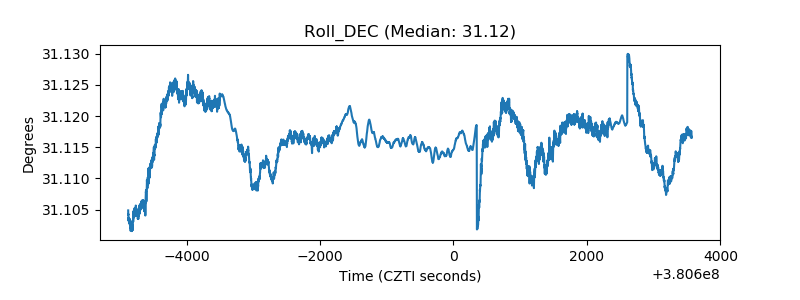 |
| _Roll_RA | 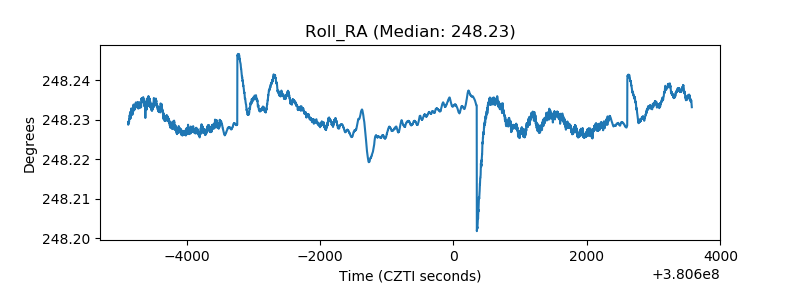 |
| Veto Counter | 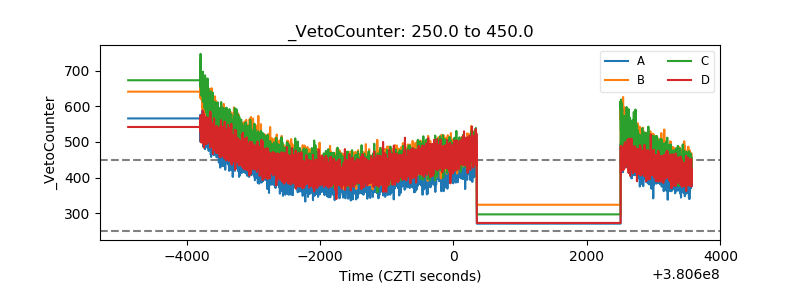 |