| Param | Original file | Final file |
|---|---|---|
| Filename | modeM0/AS1A11_047T15_9000004882_34181cztM0_level2.evt | modeM0/AS1A11_047T15_9000004882_34181cztM0_level2_quad_clean.evt |
| Size (bytes) | 468,051,840 | 70,657,920 |
| Size | 446.4 MB | 67.4 MB |
| Events in quadrant A | 2,623,464 | 445,167 |
| Events in quadrant B | 3,445,398 | 446,902 |
| Events in quadrant C | 3,927,307 | 432,783 |
| Events in quadrant D | 3,789,773 | 413,872 |
| Mode SS | |||
|---|---|---|---|
| Quadrant | BADHDUFLAG | Total packets | Discarded packets |
| A | 0 | 116 | 0 |
| B | 0 | 116 | 0 |
| C | 0 | 116 | 0 |
| D | 0 | 116 | 0 |
| Mode M9 | |||
|---|---|---|---|
| Quadrant | BADHDUFLAG | Total packets | Discarded packets |
| A | 0 | 13 | 0 |
| B | 0 | 13 | 0 |
| C | 0 | 13 | 0 |
| D | 0 | 13 | 0 |
| Mode M0 | |||
|---|---|---|---|
| Quadrant | BADHDUFLAG | Total packets | Discarded packets |
| A | 0 | 11520 | 2 |
| B | 0 | 14019 | 1 |
| C | 0 | 15263 | 1 |
| D | 0 | 15084 | 1 |
| Quadrant | Total seconds | Saturated seconds | Saturation percentage |
|---|---|---|---|
| A | 5735 | 2 | 0.034874% |
| B | 5735 | 143 | 2.493461% |
| C | 5735 | 228 | 3.975588% |
| D | 5735 | 39 | 0.680035% |
Noise dominated data is calculated using 1-second bins in cleaned event files. If a bin has >2000 counts, and if more than 50% of those come from <1% of pixels, then it is considered to be noise-dominated and hence unusable.
| Quadrant | # 1 sec bins | Bins with >0 counts | Bins with >2000 counts | High rate bins dominated by noise | Noise dominated (total time) | Noise dominated (detector-on time) | Marked lightcurve |
|---|---|---|---|---|---|---|---|
| A | 7048 | 5736 | 0 | 0 | 0.00% | 0.00% | 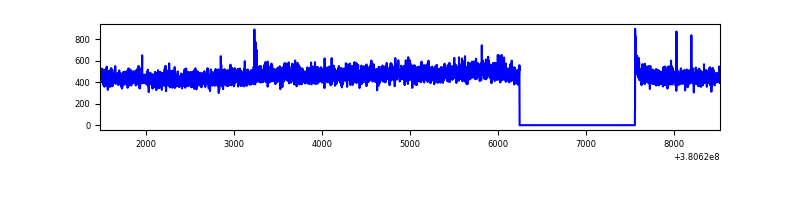 |
| B | 7048 | 5736 | 88 | 88 | 1.25% | 1.53% | 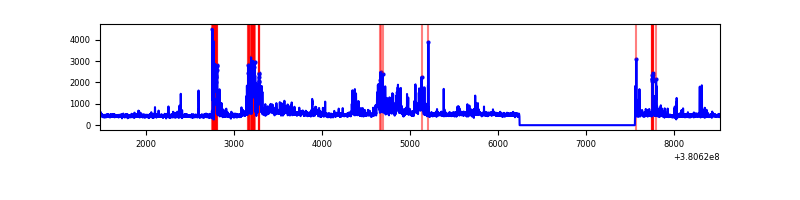 |
| C | 7048 | 5736 | 187 | 187 | 2.65% | 3.26% | 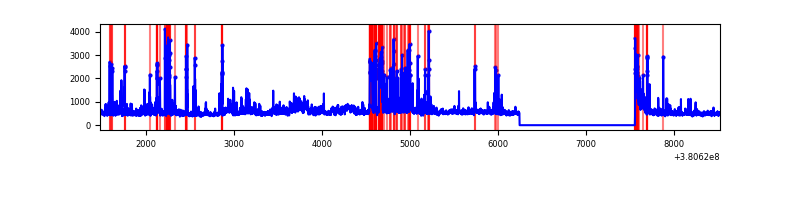 |
| D | 7048 | 5736 | 24 | 24 | 0.34% | 0.42% | 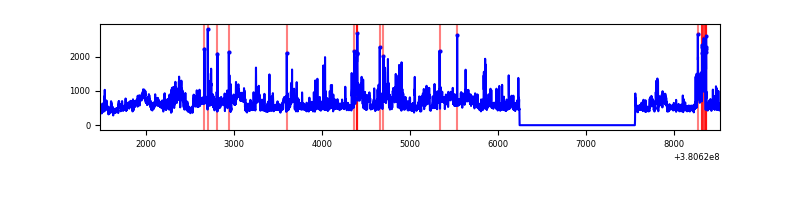 |
Top three noisy pixels from each quadrant. If the there are fewer than three noisy pixels in the level2.evt file, extra rows are filled as -1
| Pixel properties | Quadrant properties | ||||||
|---|---|---|---|---|---|---|---|
| Quadrant | DetID | PixID | Counts | Sigma | Mean | Median | Sigma |
| A | 10 | 83 | 13905 | 97.09 | 673 | 660 | 136.4 |
| A | 13 | 254 | 10219 | 70.07 | 673 | 660 | 136.4 |
| A | 13 | 6 | 10003 | 68.49 | 673 | 660 | 136.4 |
| B | 5 | 172 | 401552 | 3142.31 | 660 | 644 | 127.6 |
| B | 5 | 31 | 155058 | 1210.29 | 660 | 644 | 127.6 |
| B | 0 | 197 | 92025 | 716.24 | 660 | 644 | 127.6 |
| C | 14 | 254 | 439426 | 2938.07 | 642 | 645 | 149.3 |
| C | 15 | 214 | 259212 | 1731.36 | 642 | 645 | 149.3 |
| C | 0 | 10 | 258070 | 1723.72 | 642 | 645 | 149.3 |
| D | 8 | 195 | 913617 | 5210.41 | 645 | 631 | 175.2 |
| D | 7 | 38 | 124497 | 706.9 | 645 | 631 | 175.2 |
| D | 10 | 118 | 118076 | 670.26 | 645 | 631 | 175.2 |
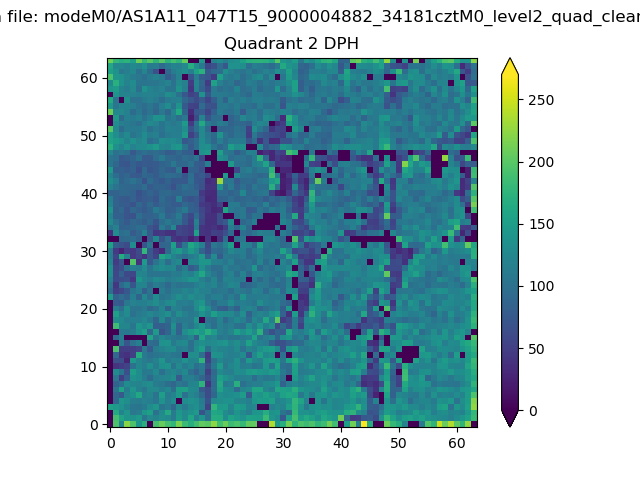
Histogram calculated using DETX and DETY for each event in the final _common_clean file
| Quadrant A | 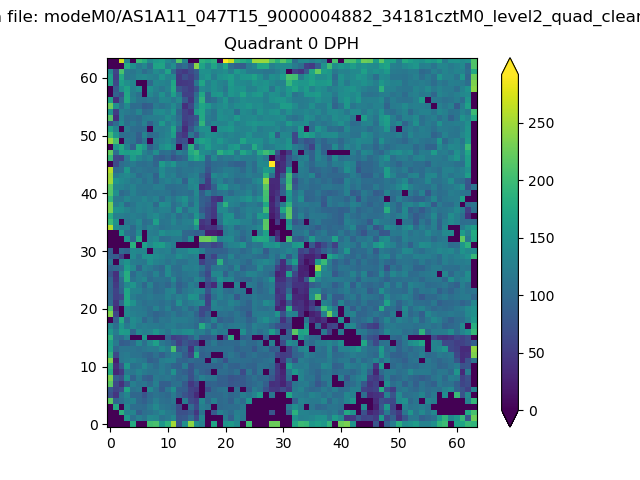 |
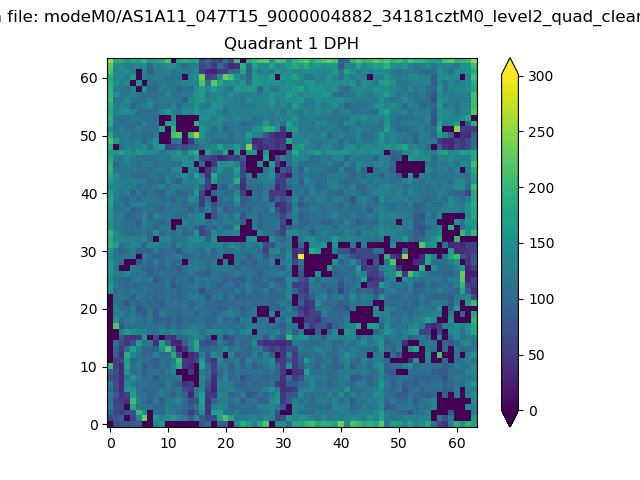 |
Quadrant B |
|---|---|---|---|
| Quadrant D | 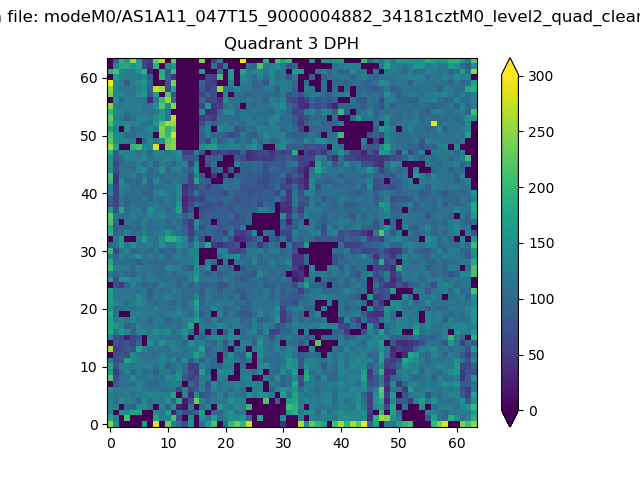 |
 |
Quadrant C |
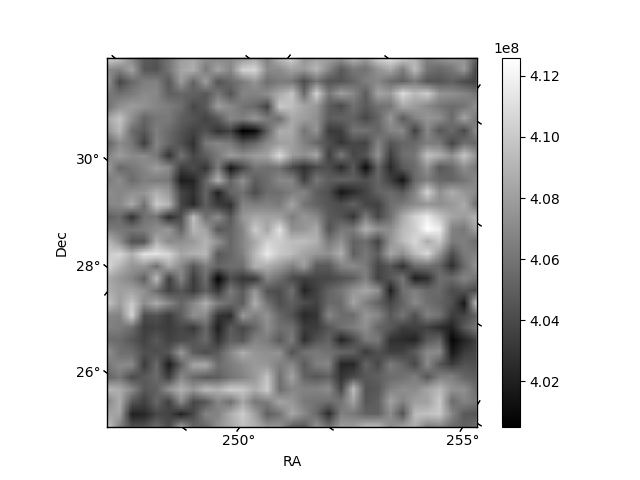
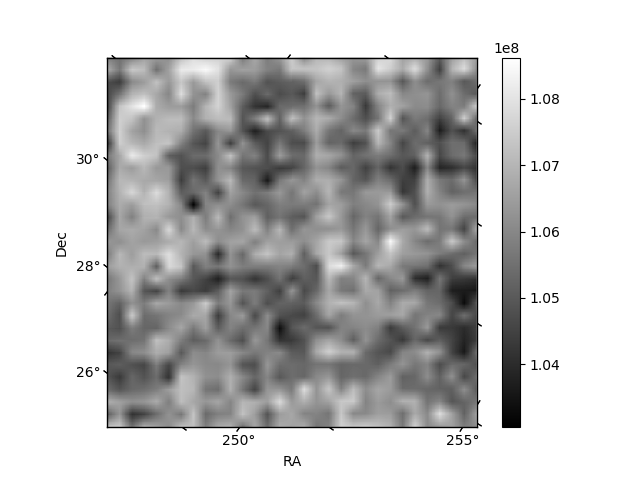
| Plot type | Count rate plots | Images |
|---|---|---|
| Comparison with Poisson distribution Blue bars denote a histogram of data divided into 1 sec bins. Red curve is a Poisson curve with rate = median count rate of data. |
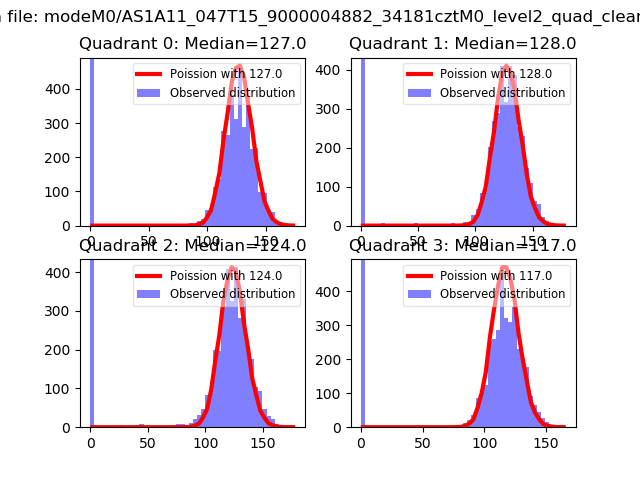 |
 |
| Quadrant-wise count rates Data is divided into 100 sec bins |
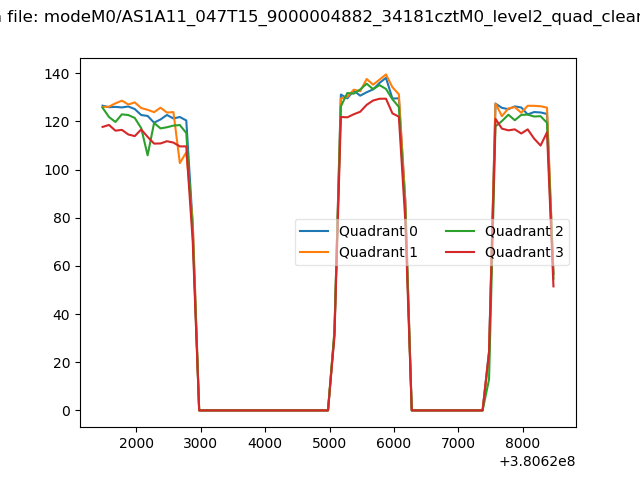 |
|
| Module-wise count rates for Quadrant A Data is divided into 100 sec bins |
 |
 |
| Module-wise count rates for Quadrant B Data is divided into 100 sec bins |
 |
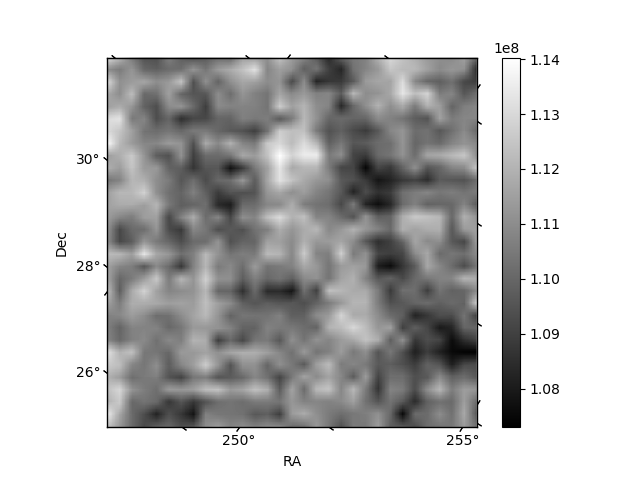 |
| Module-wise count rates for Quadrant C Data is divided into 100 sec bins |
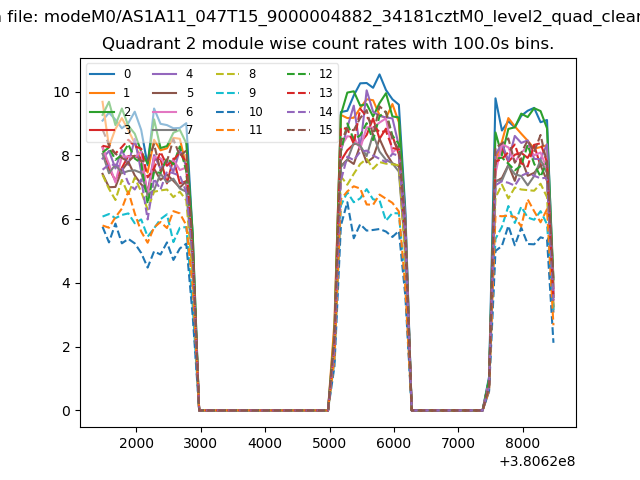 |
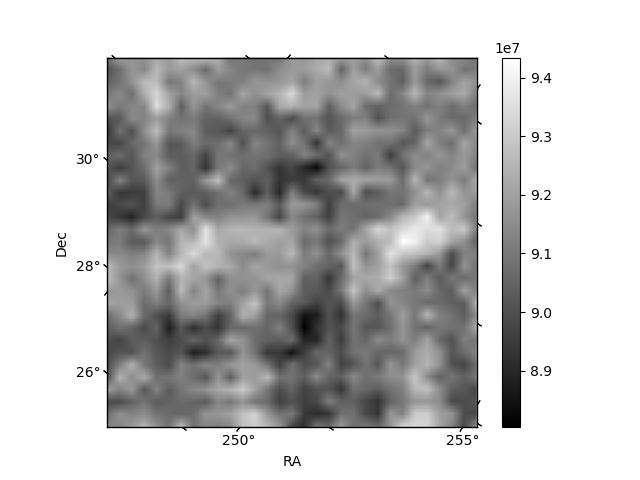 |
| Module-wise count rates for Quadrant D Data is divided into 100 sec bins |
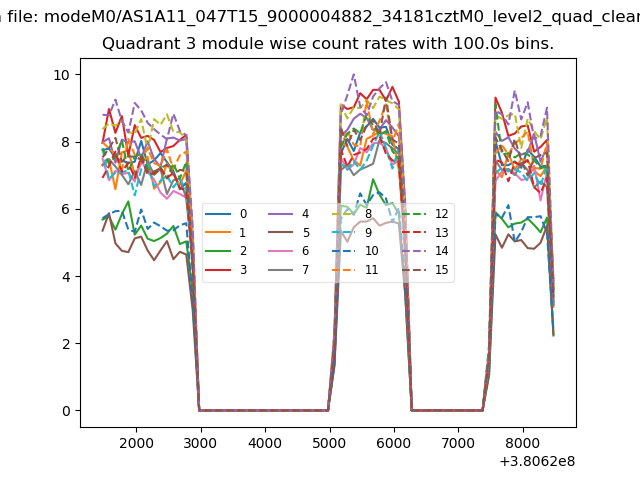 |
 |
| Parameter | Plot |
|---|---|
| CZT HV Monitor |  |
| D_VDD | 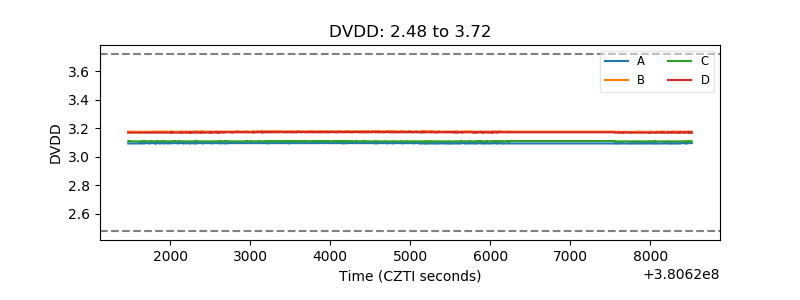 |
| Temperature 1 | 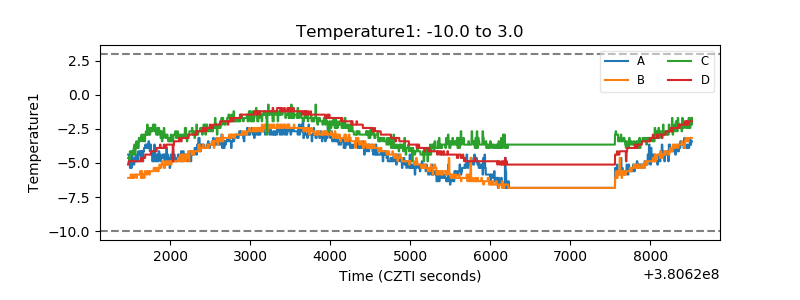 |
| Veto HV Monitor |  |
| Veto LLD | 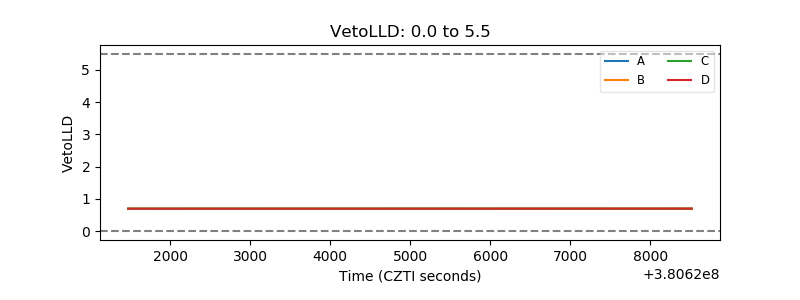 |
| Alpha Counter | 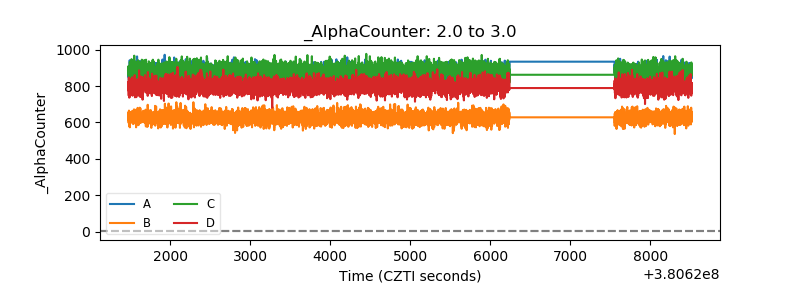 |
| _CPM_Rate | 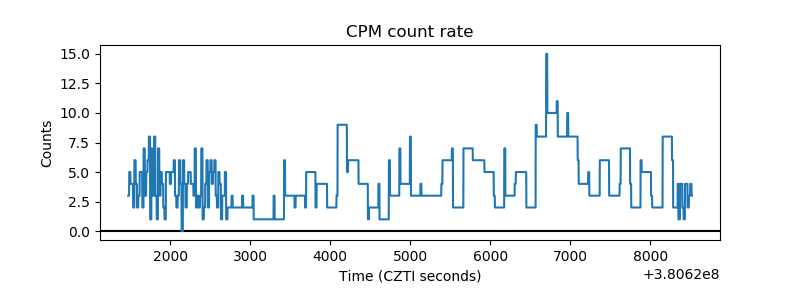 |
| CZT Counter | 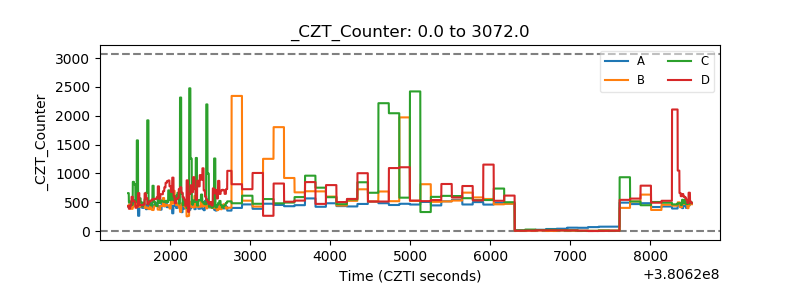 |
| +2.5 Volts monitor | 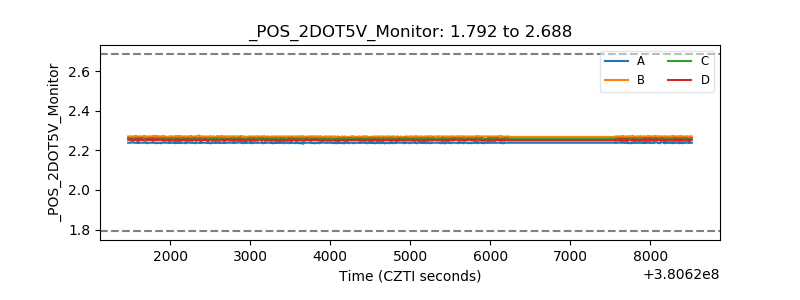 |
| +5 Volts monitor |  |
| _ROLL_ROT | 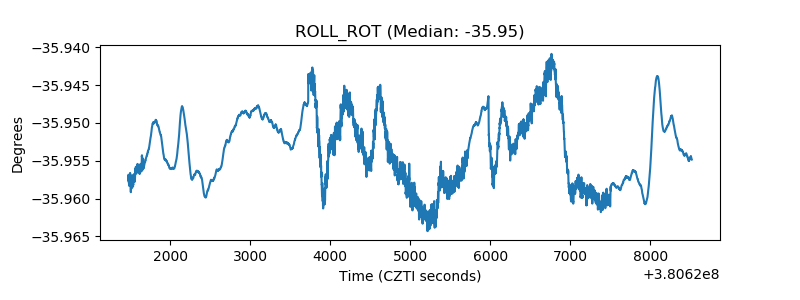 |
| _Roll_DEC | 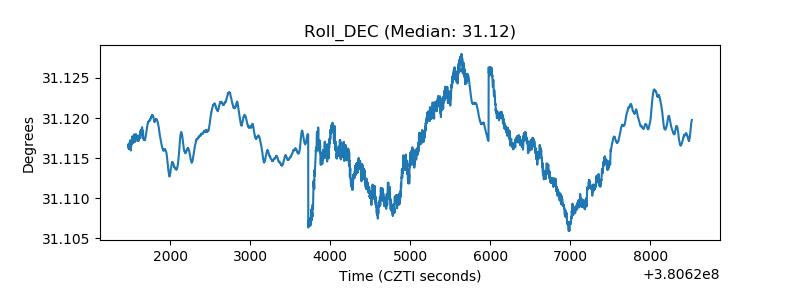 |
| _Roll_RA | 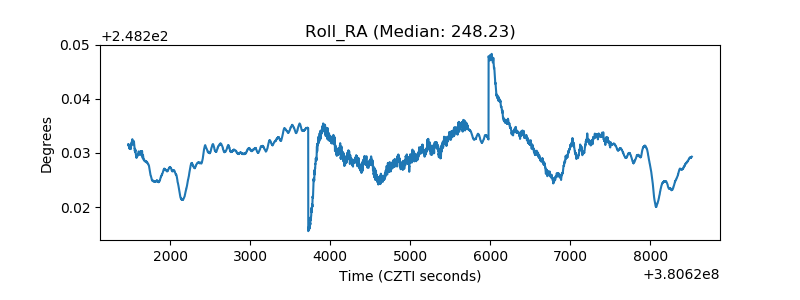 |
| Veto Counter |  |