| Param | Original file | Final file |
|---|---|---|
| Filename | modeM0/AS1A11_047T15_9000004882_34185cztM0_level2.evt | modeM0/AS1A11_047T15_9000004882_34185cztM0_level2_quad_clean.evt |
| Size (bytes) | 587,629,440 | 54,993,600 |
| Size | 560.4 MB | 52.4 MB |
| Events in quadrant A | 2,665,459 | 326,816 |
| Events in quadrant B | 5,913,831 | 320,714 |
| Events in quadrant C | 3,222,163 | 324,302 |
| Events in quadrant D | 5,612,445 | 297,381 |
| Mode SS | |||
|---|---|---|---|
| Quadrant | BADHDUFLAG | Total packets | Discarded packets |
| A | 0 | 114 | 0 |
| B | 0 | 114 | 0 |
| C | 0 | 114 | 0 |
| D | 0 | 114 | 0 |
| Mode M9 | |||
|---|---|---|---|
| Quadrant | BADHDUFLAG | Total packets | Discarded packets |
| A | 0 | 18 | 0 |
| B | 0 | 18 | 0 |
| C | 0 | 18 | 0 |
| D | 0 | 19 | 0 |
| Mode M0 | |||
|---|---|---|---|
| Quadrant | BADHDUFLAG | Total packets | Discarded packets |
| A | 0 | 11529 | 3 |
| B | 0 | 21516 | 2 |
| C | 0 | 12829 | 2 |
| D | 0 | 20655 | 2 |
| Quadrant | Total seconds | Saturated seconds | Saturation percentage |
|---|---|---|---|
| A | 5661 | 7 | 0.123653% |
| B | 5661 | 821 | 14.502738% |
| C | 5661 | 92 | 1.625155% |
| D | 5661 | 459 | 8.108108% |
Noise dominated data is calculated using 1-second bins in cleaned event files. If a bin has >2000 counts, and if more than 50% of those come from <1% of pixels, then it is considered to be noise-dominated and hence unusable.
| Quadrant | # 1 sec bins | Bins with >0 counts | Bins with >2000 counts | High rate bins dominated by noise | Noise dominated (total time) | Noise dominated (detector-on time) | Marked lightcurve |
|---|---|---|---|---|---|---|---|
| A | 7214 | 5662 | 0 | 0 | 0.00% | 0.00% | 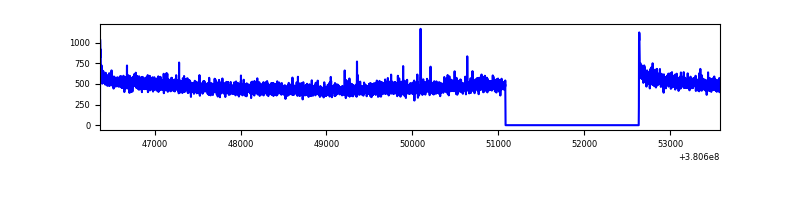 |
| B | 7214 | 5662 | 611 | 611 | 8.47% | 10.79% | 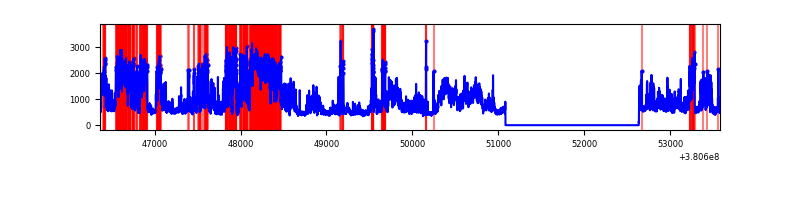 |
| C | 7214 | 5662 | 67 | 67 | 0.93% | 1.18% | 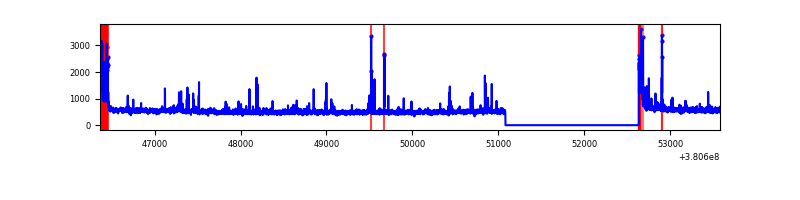 |
| D | 7214 | 5662 | 364 | 364 | 5.05% | 6.43% | 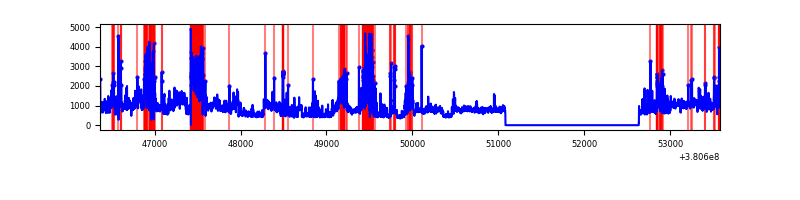 |
Top three noisy pixels from each quadrant. If the there are fewer than three noisy pixels in the level2.evt file, extra rows are filled as -1
| Pixel properties | Quadrant properties | ||||||
|---|---|---|---|---|---|---|---|
| Quadrant | DetID | PixID | Counts | Sigma | Mean | Median | Sigma |
| A | 10 | 83 | 23655 | 168.71 | 678 | 665 | 136.3 |
| A | 13 | 6 | 16158 | 113.7 | 678 | 665 | 136.3 |
| A | 13 | 254 | 10316 | 70.82 | 678 | 665 | 136.3 |
| B | 5 | 31 | 1693786 | 13541.67 | 648 | 630 | 125.0 |
| B | 5 | 15 | 754804 | 6031.8 | 648 | 630 | 125.0 |
| B | 5 | 172 | 627817 | 5016.17 | 648 | 630 | 125.0 |
| C | 0 | 10 | 300714 | 1957.08 | 658 | 662 | 153.3 |
| C | 15 | 214 | 260566 | 1695.22 | 658 | 662 | 153.3 |
| C | 14 | 254 | 76199 | 492.69 | 658 | 662 | 153.3 |
| D | 8 | 195 | 1476195 | 8900.53 | 631 | 615 | 165.8 |
| D | 7 | 80 | 653276 | 3936.78 | 631 | 615 | 165.8 |
| D | 7 | 223 | 427263 | 2573.49 | 631 | 615 | 165.8 |
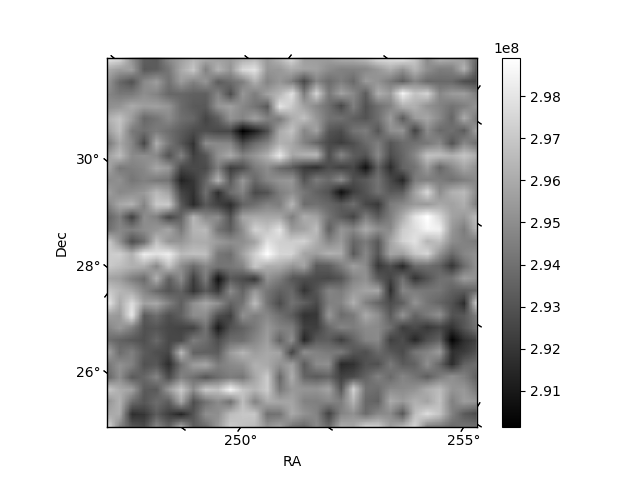
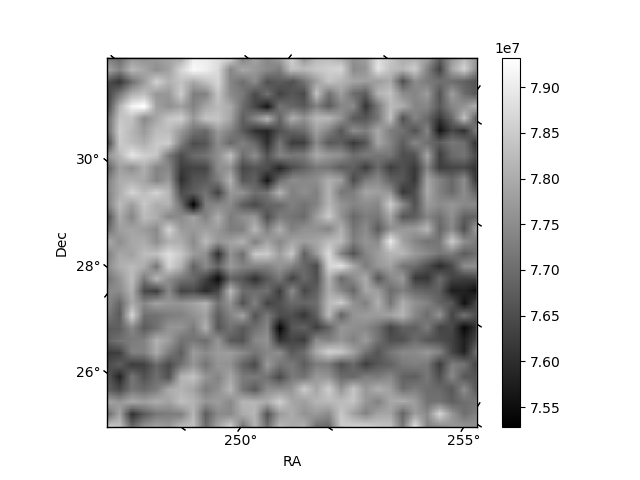
Histogram calculated using DETX and DETY for each event in the final _common_clean file
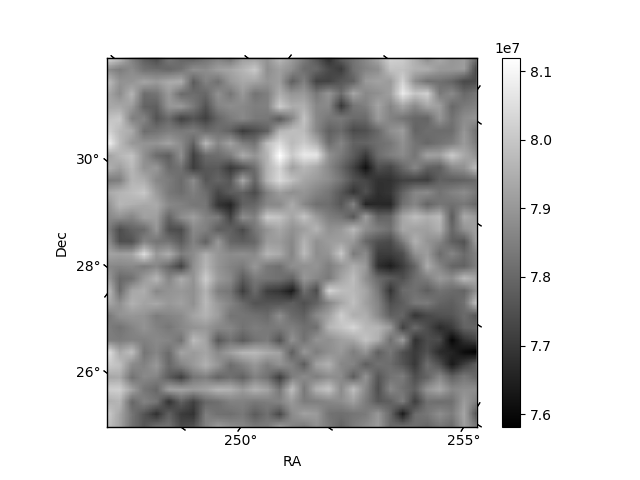
| Quadrant A | 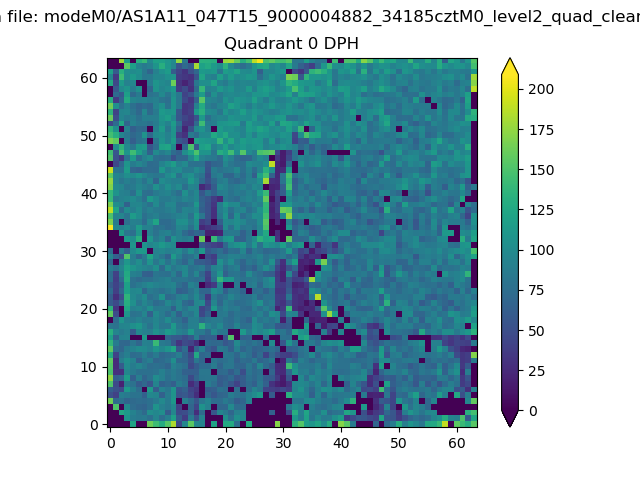 |
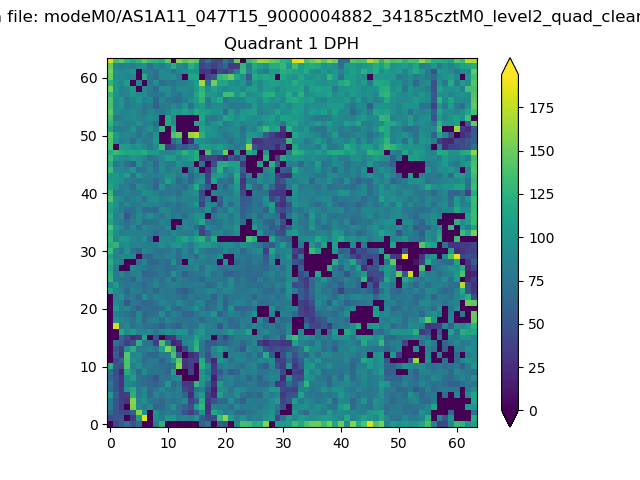 |
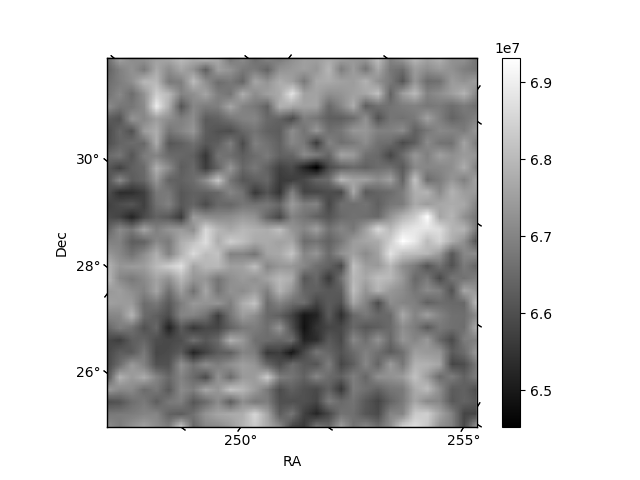
Quadrant B |
|---|---|---|---|
| Quadrant D | 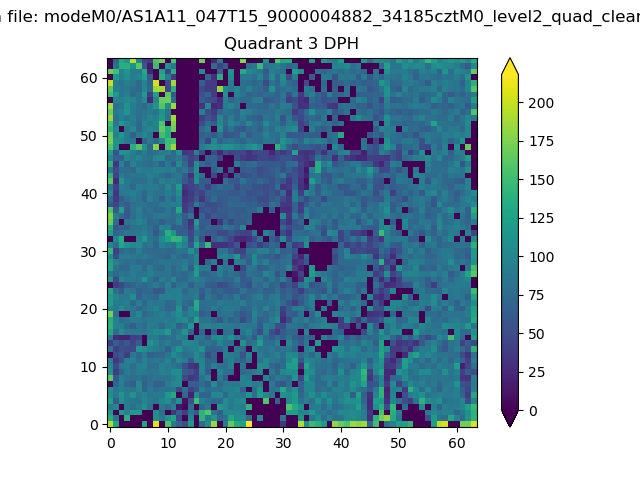 |
 |
Quadrant C |
| Plot type | Count rate plots | Images |
|---|---|---|
| Comparison with Poisson distribution Blue bars denote a histogram of data divided into 1 sec bins. Red curve is a Poisson curve with rate = median count rate of data. |
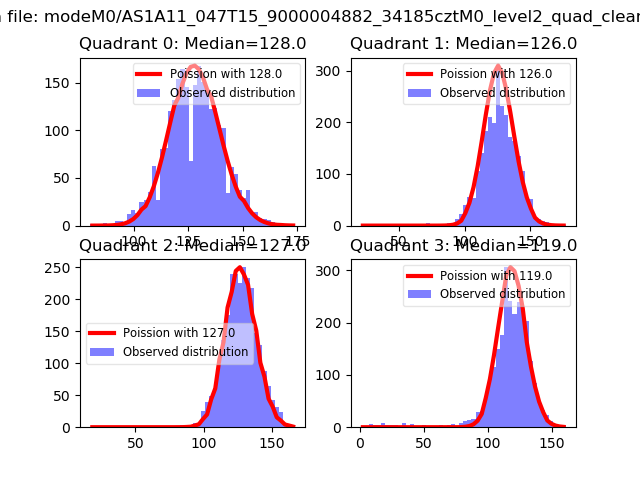 |
 |
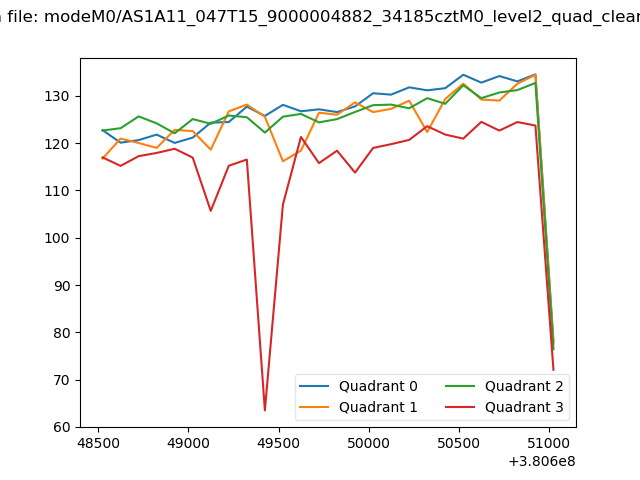
| Quadrant-wise count rates Data is divided into 100 sec bins |
 |
|
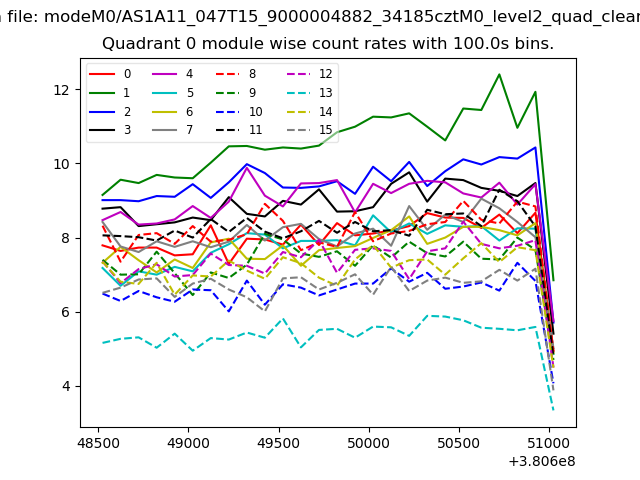
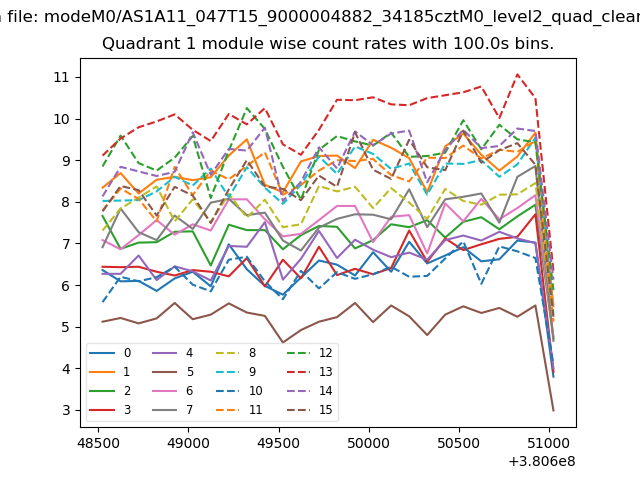
| Module-wise count rates for Quadrant A Data is divided into 100 sec bins |
 |
 |
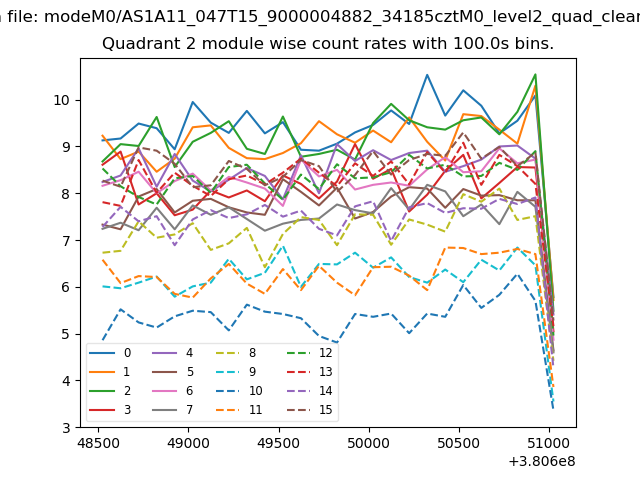
| Module-wise count rates for Quadrant B Data is divided into 100 sec bins |
 |
 |
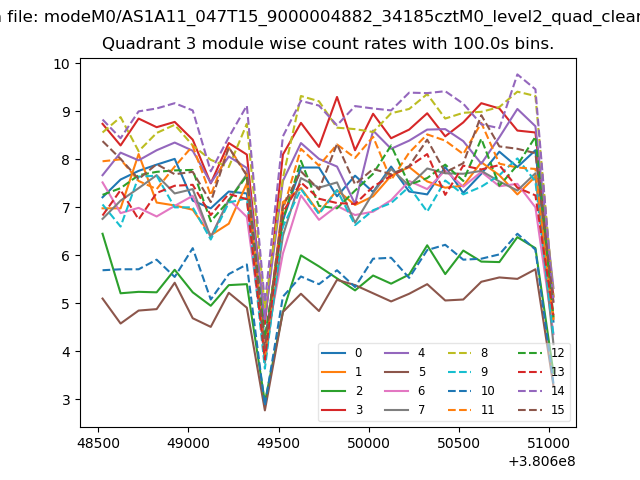
| Module-wise count rates for Quadrant C Data is divided into 100 sec bins |
 |
 |
| Module-wise count rates for Quadrant D Data is divided into 100 sec bins |
 |
 |
| Parameter | Plot |
|---|---|
| CZT HV Monitor | 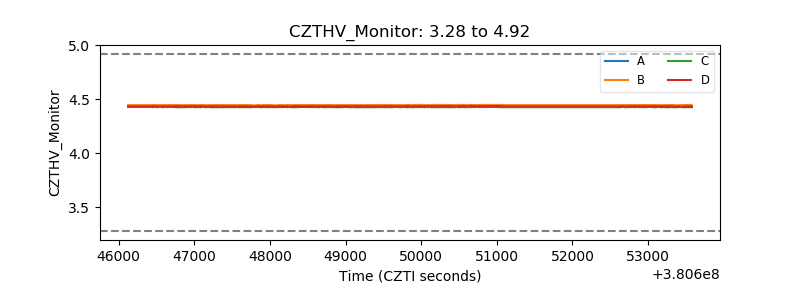 |
| D_VDD | 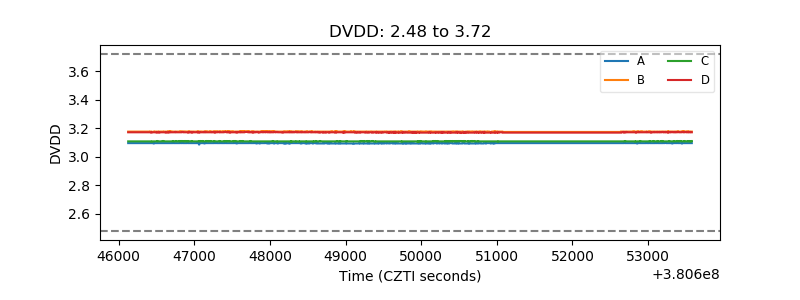 |
| Temperature 1 | 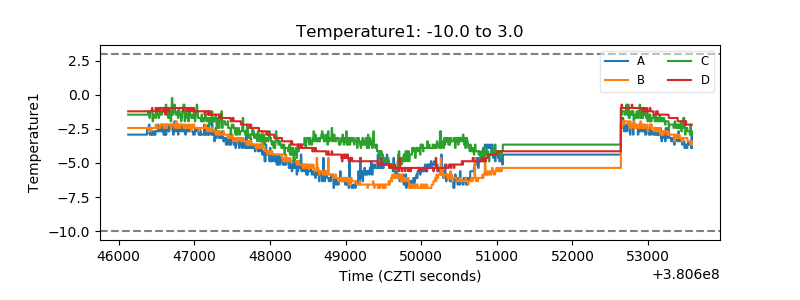 |
| Veto HV Monitor | 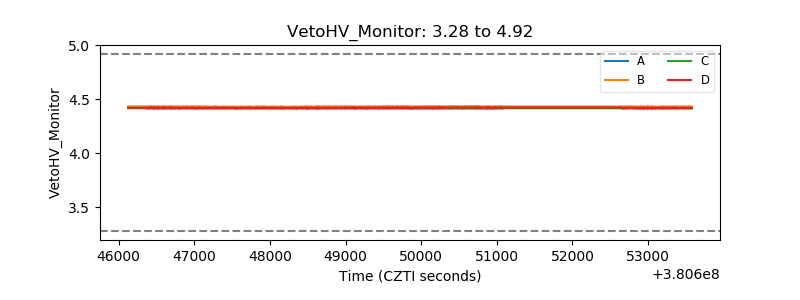 |
| Veto LLD | 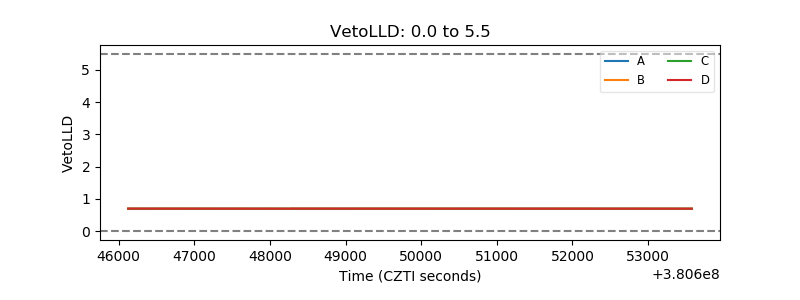 |
| Alpha Counter | 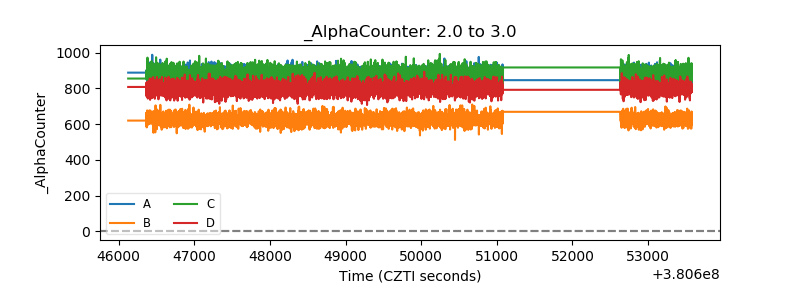 |
| _CPM_Rate | 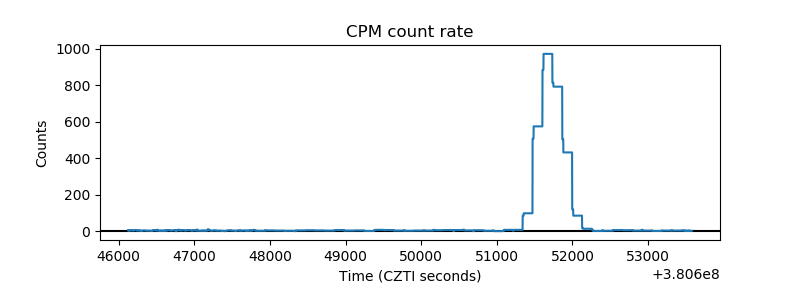 |
| CZT Counter | 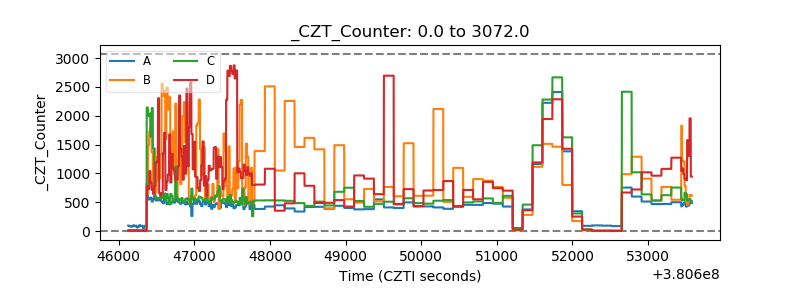 |
| +2.5 Volts monitor |  |
| +5 Volts monitor |  |
| _ROLL_ROT | 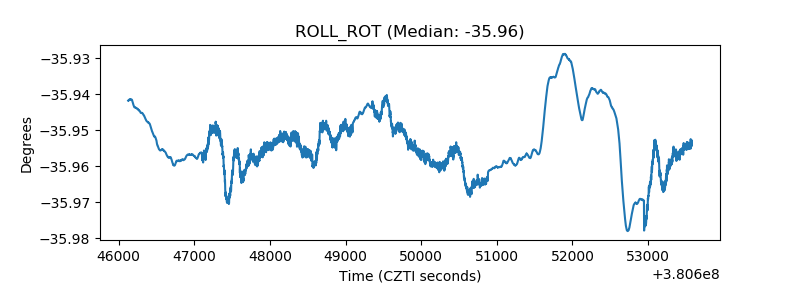 |
| _Roll_DEC | 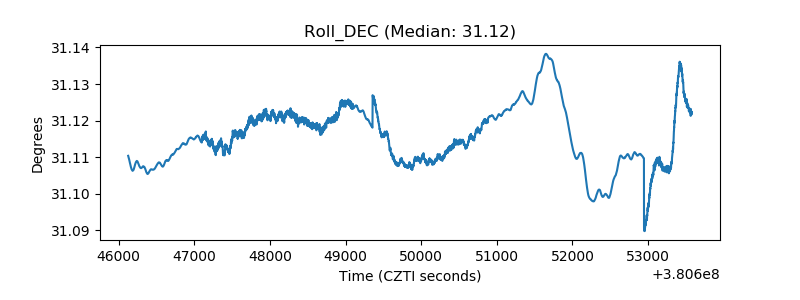 |
| _Roll_RA | 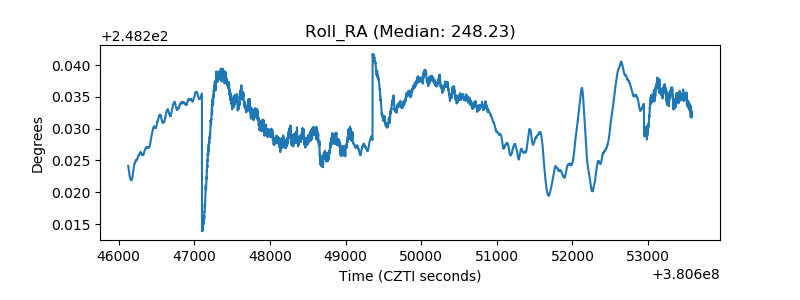 |
| Veto Counter | 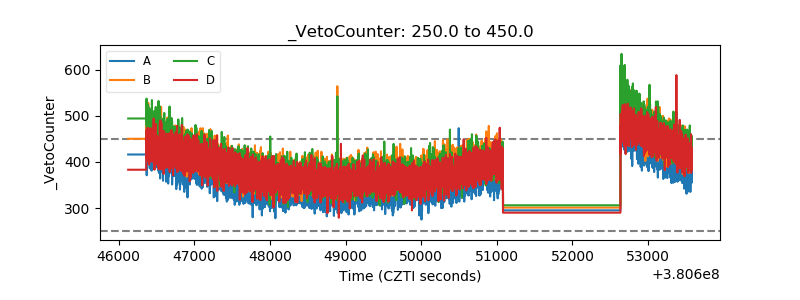 |