| Param | Original file | Final file |
|---|---|---|
| Filename | modeM0/AS1A11_047T15_9000004882_34186cztM0_level2.evt | modeM0/AS1A11_047T15_9000004882_34186cztM0_level2_quad_clean.evt |
| Size (bytes) | 523,552,320 | 59,716,800 |
| Size | 499.3 MB | 57.0 MB |
| Events in quadrant A | 2,618,800 | 364,123 |
| Events in quadrant B | 5,139,119 | 358,401 |
| Events in quadrant C | 3,141,589 | 364,673 |
| Events in quadrant D | 4,588,023 | 340,063 |
| Mode SS | |||
|---|---|---|---|
| Quadrant | BADHDUFLAG | Total packets | Discarded packets |
| A | 0 | 110 | 0 |
| B | 0 | 110 | 0 |
| C | 0 | 110 | 0 |
| D | 0 | 110 | 0 |
| Mode M9 | |||
|---|---|---|---|
| Quadrant | BADHDUFLAG | Total packets | Discarded packets |
| A | 0 | 22 | 0 |
| B | 0 | 22 | 0 |
| C | 0 | 22 | 0 |
| D | 0 | 23 | 0 |
| Mode M0 | |||
|---|---|---|---|
| Quadrant | BADHDUFLAG | Total packets | Discarded packets |
| A | 0 | 11295 | 3 |
| B | 0 | 18992 | 2 |
| C | 0 | 12668 | 2 |
| D | 0 | 17510 | 2 |
| Quadrant | Total seconds | Saturated seconds | Saturation percentage |
|---|---|---|---|
| A | 5441 | 9 | 0.165411% |
| B | 5441 | 561 | 10.310605% |
| C | 5441 | 99 | 1.819518% |
| D | 5441 | 128 | 2.352509% |
Noise dominated data is calculated using 1-second bins in cleaned event files. If a bin has >2000 counts, and if more than 50% of those come from <1% of pixels, then it is considered to be noise-dominated and hence unusable.
| Quadrant | # 1 sec bins | Bins with >0 counts | Bins with >2000 counts | High rate bins dominated by noise | Noise dominated (total time) | Noise dominated (detector-on time) | Marked lightcurve |
|---|---|---|---|---|---|---|---|
| A | 7143 | 5442 | 1 | 1 | 0.01% | 0.02% | 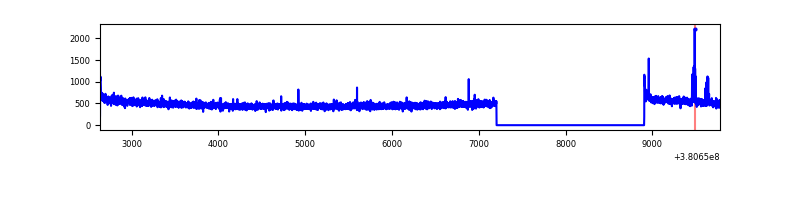 |
| B | 7143 | 5442 | 363 | 363 | 5.08% | 6.67% | 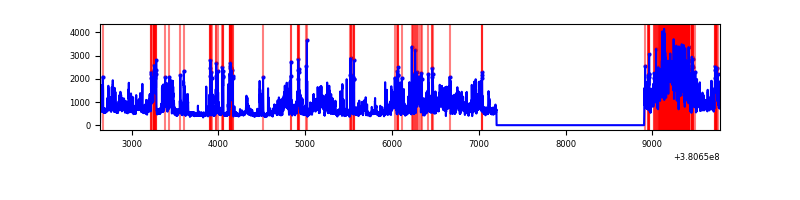 |
| C | 7143 | 5442 | 61 | 61 | 0.85% | 1.12% | 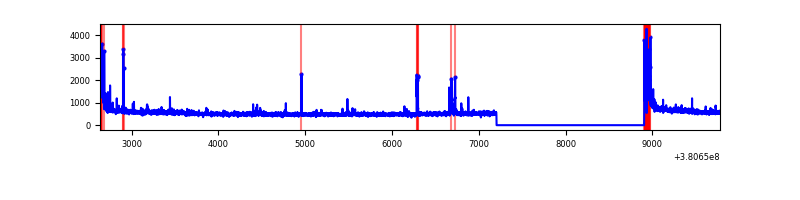 |
| D | 7143 | 5442 | 84 | 84 | 1.18% | 1.54% | 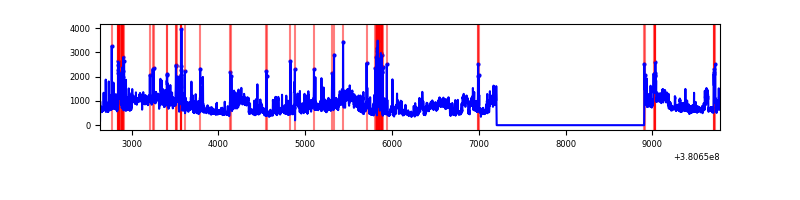 |
Top three noisy pixels from each quadrant. If the there are fewer than three noisy pixels in the level2.evt file, extra rows are filled as -1
| Pixel properties | Quadrant properties | ||||||
|---|---|---|---|---|---|---|---|
| Quadrant | DetID | PixID | Counts | Sigma | Mean | Median | Sigma |
| A | 15 | 169 | 28042 | 207.03 | 660 | 647 | 132.3 |
| A | 10 | 83 | 23733 | 174.47 | 660 | 647 | 132.3 |
| A | 13 | 6 | 11956 | 85.47 | 660 | 647 | 132.3 |
| B | 5 | 172 | 1195751 | 9965.97 | 625 | 610 | 119.9 |
| B | 5 | 31 | 985038 | 8208.89 | 625 | 610 | 119.9 |
| B | 5 | 15 | 270094 | 2247.16 | 625 | 610 | 119.9 |
| C | 0 | 10 | 291232 | 1940.62 | 643 | 649 | 149.7 |
| C | 15 | 214 | 248265 | 1653.67 | 643 | 649 | 149.7 |
| C | 14 | 254 | 58860 | 388.75 | 643 | 649 | 149.7 |
| D | 8 | 195 | 1063299 | 6702.45 | 640 | 624 | 158.6 |
| D | 7 | 223 | 523333 | 3296.8 | 640 | 624 | 158.6 |
| D | 2 | 249 | 268773 | 1691.26 | 640 | 624 | 158.6 |
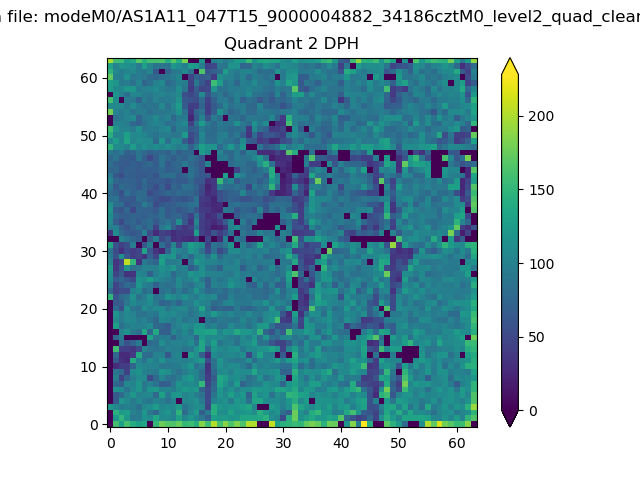
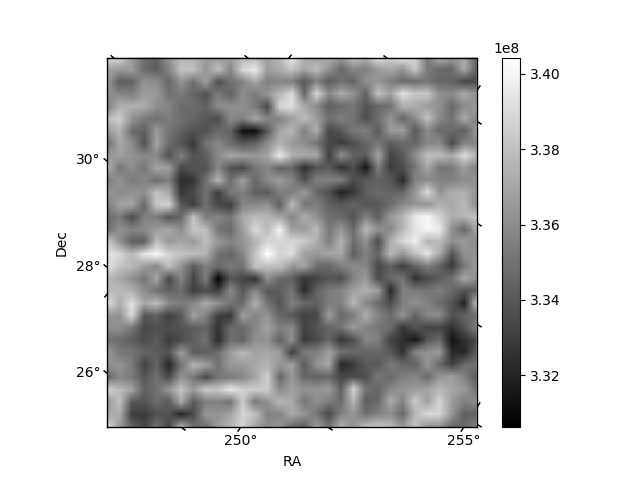
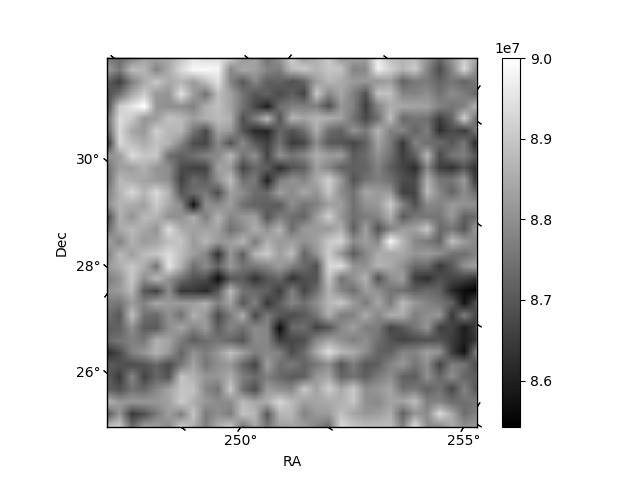
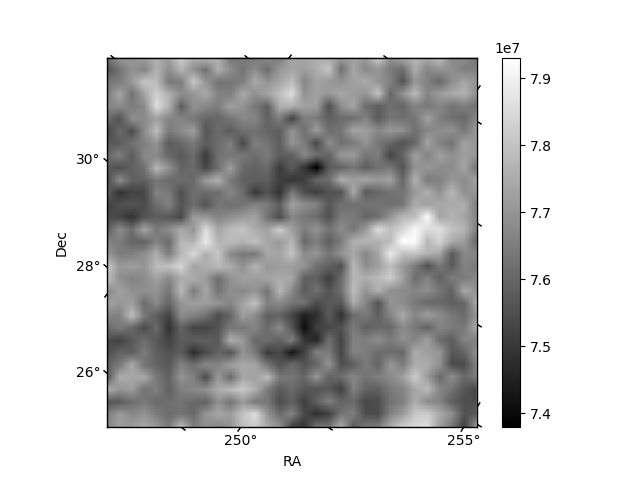
Histogram calculated using DETX and DETY for each event in the final _common_clean file
| Quadrant A | 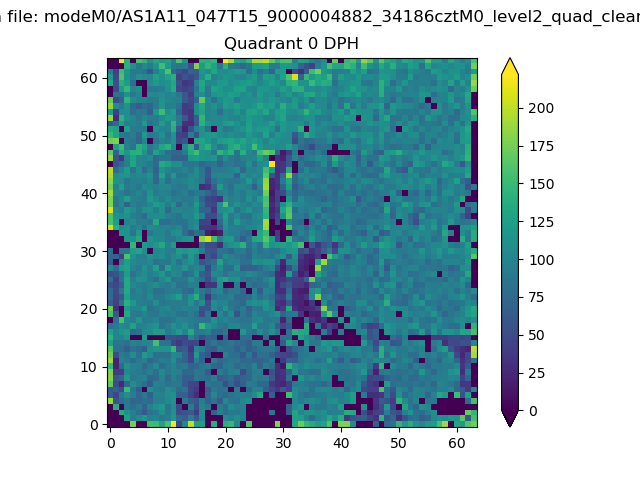 |
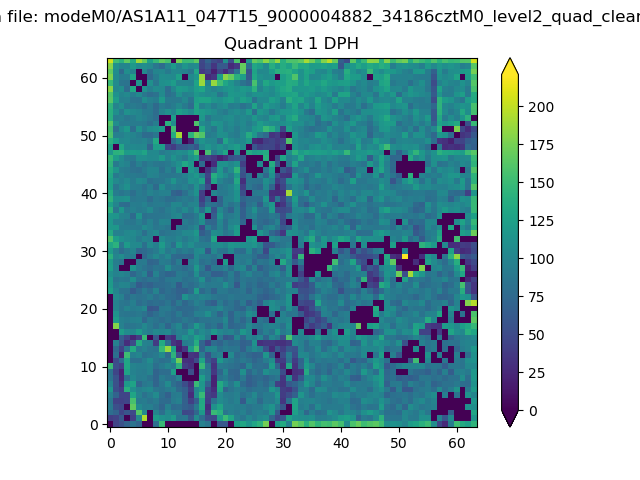 |
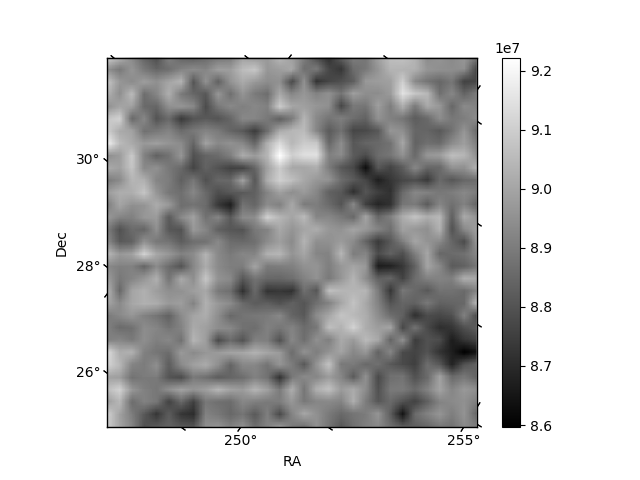
Quadrant B |
|---|---|---|---|
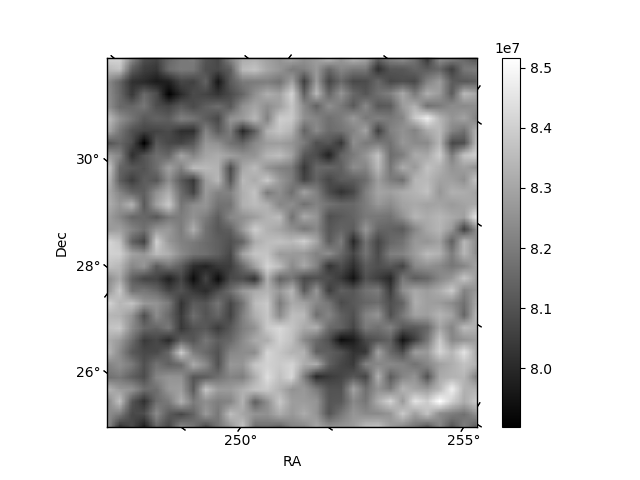
| Quadrant D | 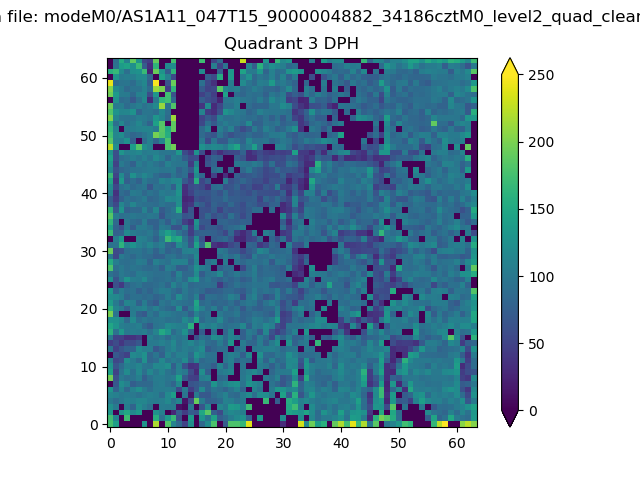 |
 |
Quadrant C |
| Plot type | Count rate plots | Images |
|---|---|---|
| Comparison with Poisson distribution Blue bars denote a histogram of data divided into 1 sec bins. Red curve is a Poisson curve with rate = median count rate of data. |
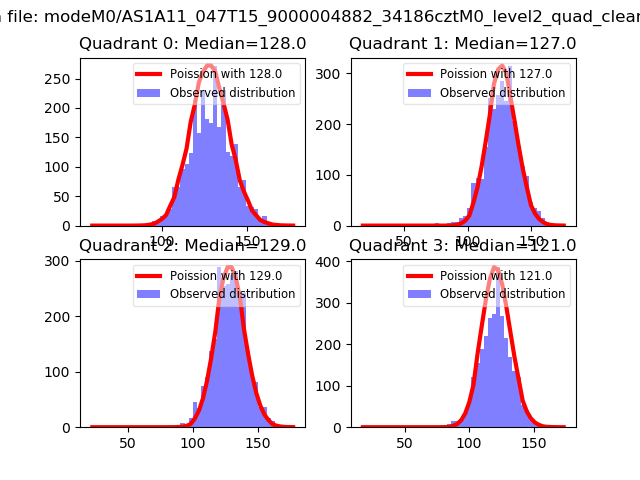 |
 |
| Quadrant-wise count rates Data is divided into 100 sec bins |
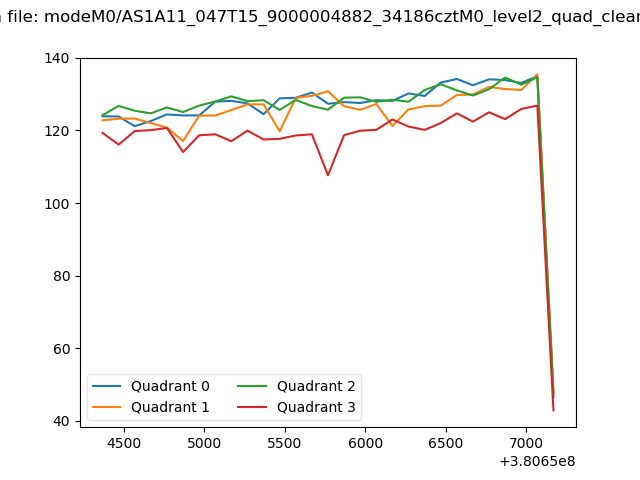 |
|
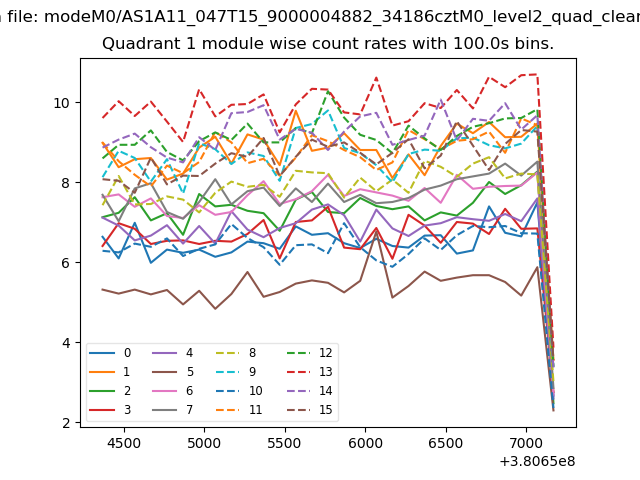
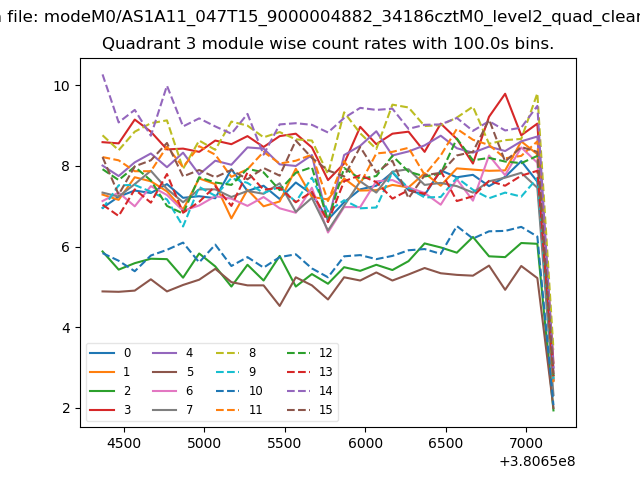
| Module-wise count rates for Quadrant A Data is divided into 100 sec bins |
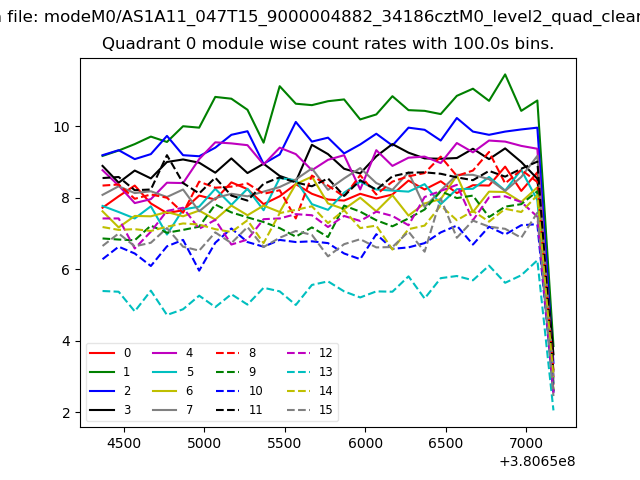 |
 |
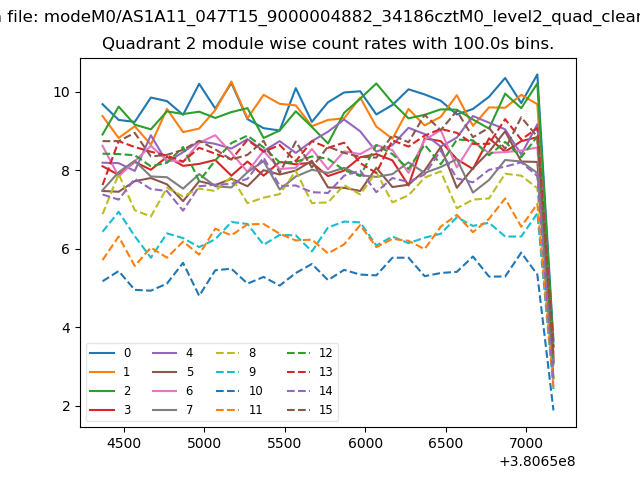
| Module-wise count rates for Quadrant B Data is divided into 100 sec bins |
 |
 |
| Module-wise count rates for Quadrant C Data is divided into 100 sec bins |
 |
 |
| Module-wise count rates for Quadrant D Data is divided into 100 sec bins |
 |
 |
| Parameter | Plot |
|---|---|
| CZT HV Monitor | 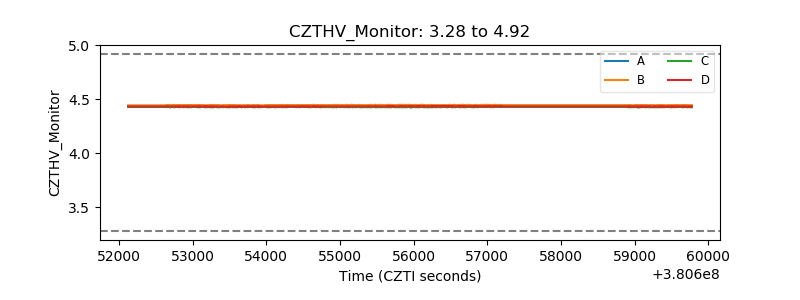 |
| D_VDD | 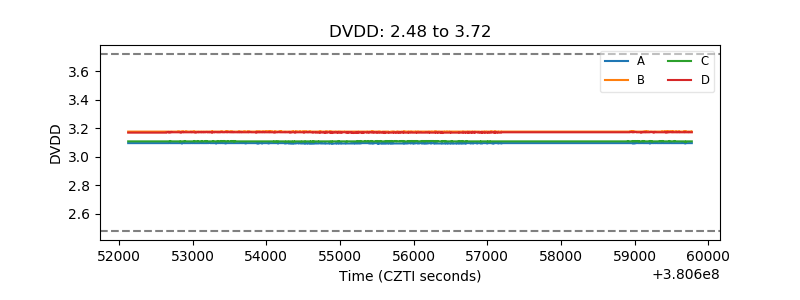 |
| Temperature 1 | 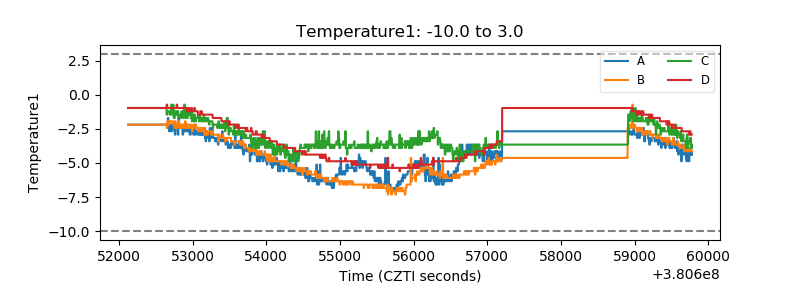 |
| Veto HV Monitor | 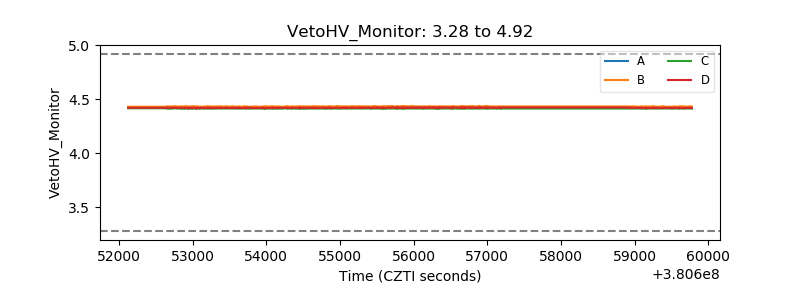 |
| Veto LLD | 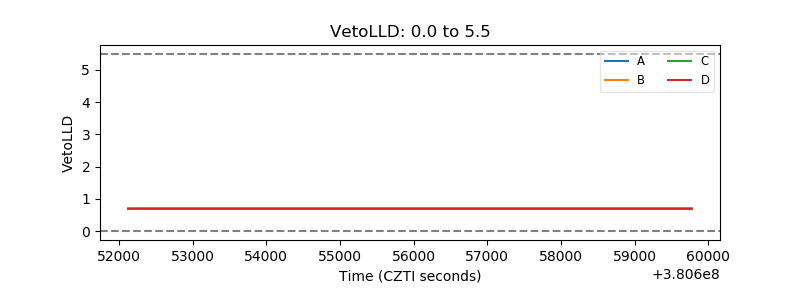 |
| Alpha Counter | 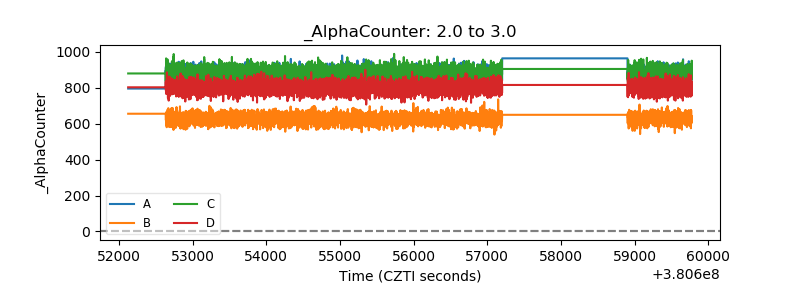 |
| _CPM_Rate | 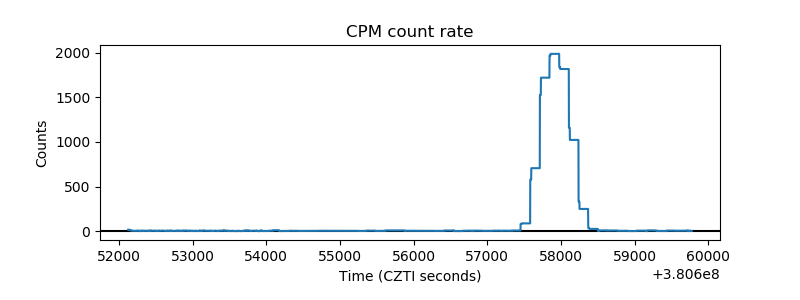 |
| CZT Counter | 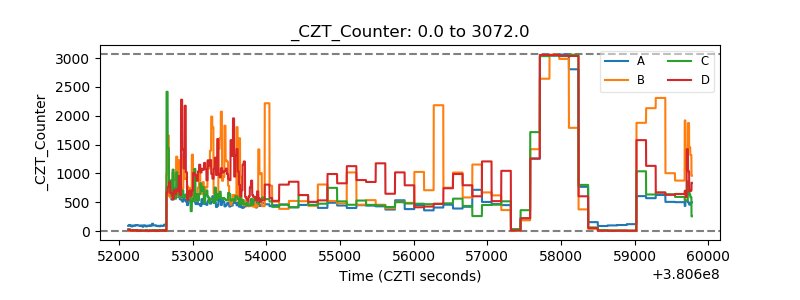 |
| +2.5 Volts monitor |  |
| +5 Volts monitor |  |
| _ROLL_ROT | 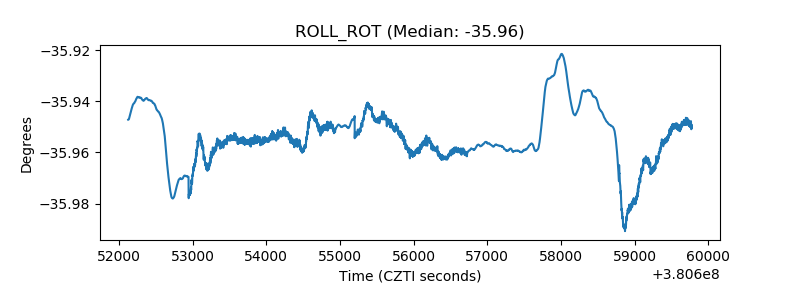 |
| _Roll_DEC | 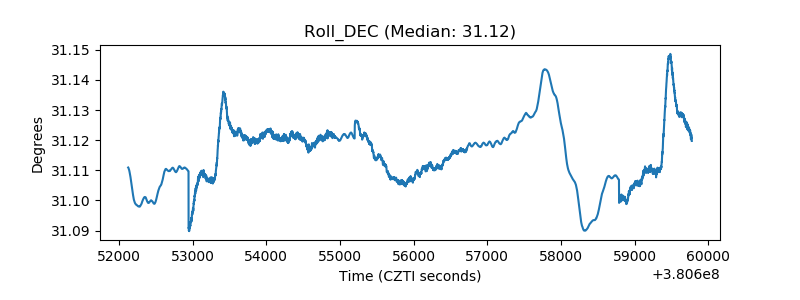 |
| _Roll_RA | 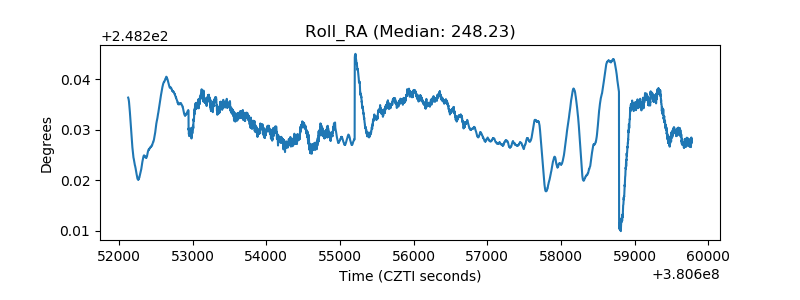 |
| Veto Counter | 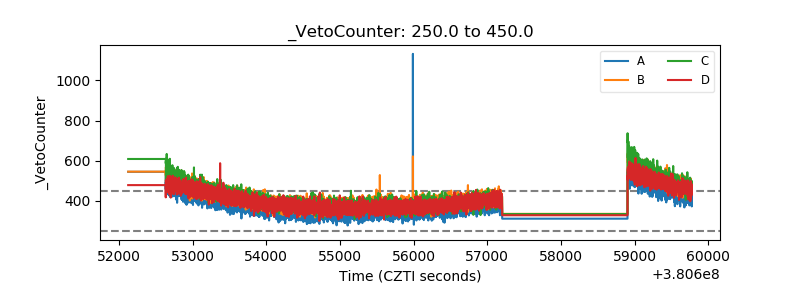 |