| Param | Original file | Final file |
|---|---|---|
| Filename | modeM0/AS1A11_047T15_9000004882_34189cztM0_level2.evt | modeM0/AS1A11_047T15_9000004882_34189cztM0_level2_quad_clean.evt |
| Size (bytes) | 553,023,360 | 78,039,360 |
| Size | 527.4 MB | 74.4 MB |
| Events in quadrant A | 2,971,346 | 519,196 |
| Events in quadrant B | 3,923,866 | 523,263 |
| Events in quadrant C | 5,329,424 | 482,989 |
| Events in quadrant D | 4,182,726 | 484,103 |
| Mode SS | |||
|---|---|---|---|
| Quadrant | BADHDUFLAG | Total packets | Discarded packets |
| A | 0 | 102 | 0 |
| B | 0 | 102 | 0 |
| C | 0 | 102 | 0 |
| D | 0 | 102 | 0 |
| Mode M9 | |||
|---|---|---|---|
| Quadrant | BADHDUFLAG | Total packets | Discarded packets |
| A | 0 | 36 | 0 |
| B | 0 | 36 | 0 |
| C | 0 | 36 | 0 |
| D | 0 | 37 | 0 |
| Mode M0 | |||
|---|---|---|---|
| Quadrant | BADHDUFLAG | Total packets | Discarded packets |
| A | 0 | 11955 | 3 |
| B | 0 | 15089 | 2 |
| C | 0 | 19158 | 2 |
| D | 0 | 15976 | 2 |
| Quadrant | Total seconds | Saturated seconds | Saturation percentage |
|---|---|---|---|
| A | 5042 | 247 | 4.898850% |
| B | 5042 | 299 | 5.930186% |
| C | 5042 | 934 | 18.524395% |
| D | 5042 | 146 | 2.895676% |
Noise dominated data is calculated using 1-second bins in cleaned event files. If a bin has >2000 counts, and if more than 50% of those come from <1% of pixels, then it is considered to be noise-dominated and hence unusable.
| Quadrant | # 1 sec bins | Bins with >0 counts | Bins with >2000 counts | High rate bins dominated by noise | Noise dominated (total time) | Noise dominated (detector-on time) | Marked lightcurve |
|---|---|---|---|---|---|---|---|
| A | 6985 | 5043 | 211 | 211 | 3.02% | 4.18% | 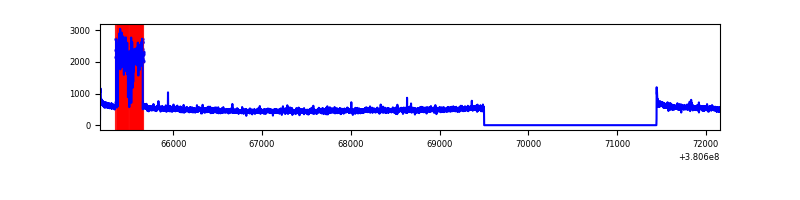 |
| B | 6985 | 5043 | 200 | 200 | 2.86% | 3.97% | 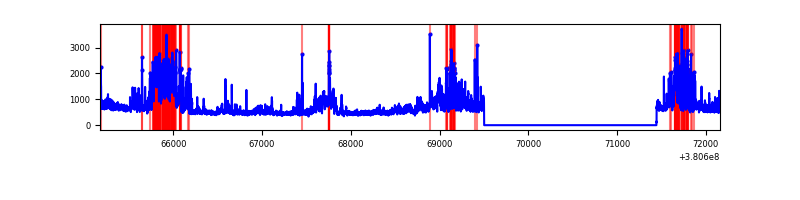 |
| C | 6985 | 5043 | 716 | 716 | 10.25% | 14.20% | 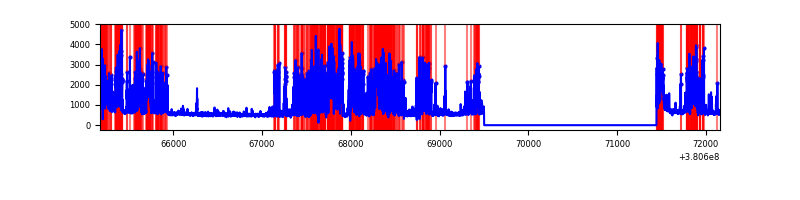 |
| D | 6985 | 5043 | 108 | 108 | 1.55% | 2.14% | 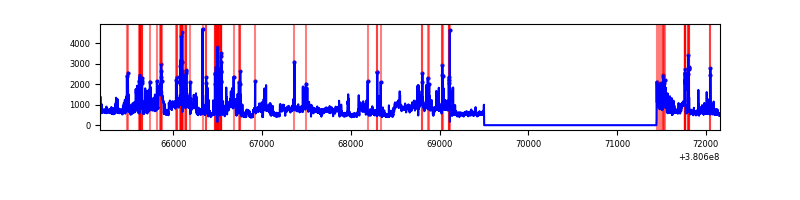 |
Top three noisy pixels from each quadrant. If the there are fewer than three noisy pixels in the level2.evt file, extra rows are filled as -1
| Pixel properties | Quadrant properties | ||||||
|---|---|---|---|---|---|---|---|
| Quadrant | DetID | PixID | Counts | Sigma | Mean | Median | Sigma |
| A | 15 | 169 | 501729 | 4005.49 | 627 | 618 | 125.1 |
| A | 10 | 83 | 22560 | 175.39 | 627 | 618 | 125.1 |
| A | 13 | 6 | 21130 | 163.96 | 627 | 618 | 125.1 |
| B | 5 | 31 | 609206 | 5171.83 | 627 | 613 | 117.7 |
| B | 5 | 172 | 538828 | 4573.76 | 627 | 613 | 117.7 |
| B | 5 | 15 | 197393 | 1672.24 | 627 | 613 | 117.7 |
| C | 14 | 254 | 2451368 | 18497.55 | 576 | 583 | 132.5 |
| C | 0 | 10 | 299645 | 2257.2 | 576 | 583 | 132.5 |
| C | 15 | 214 | 215679 | 1623.46 | 576 | 583 | 132.5 |
| D | 8 | 195 | 997949 | 5997.15 | 609 | 597 | 166.3 |
| D | 7 | 223 | 186348 | 1116.93 | 609 | 597 | 166.3 |
| D | 7 | 80 | 164056 | 982.89 | 609 | 597 | 166.3 |
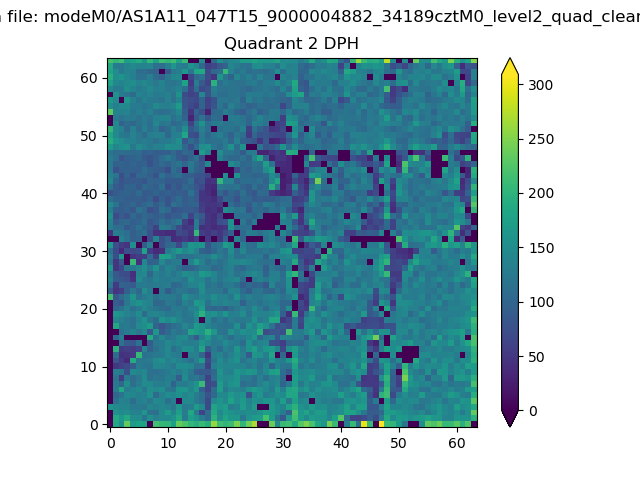
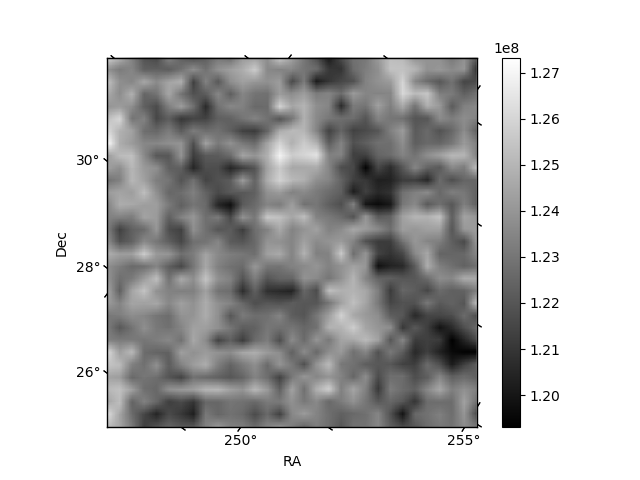
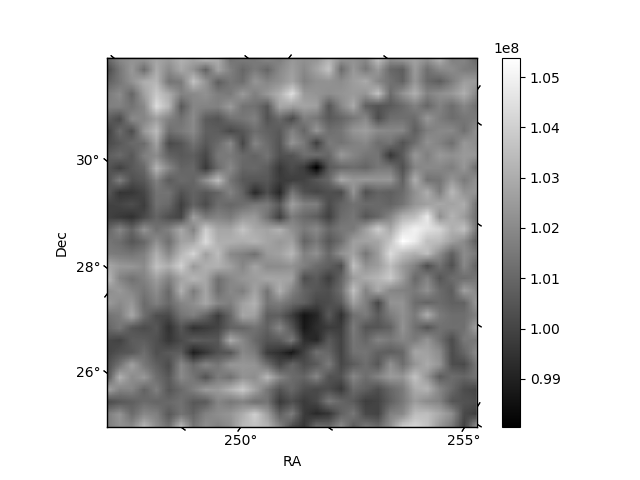
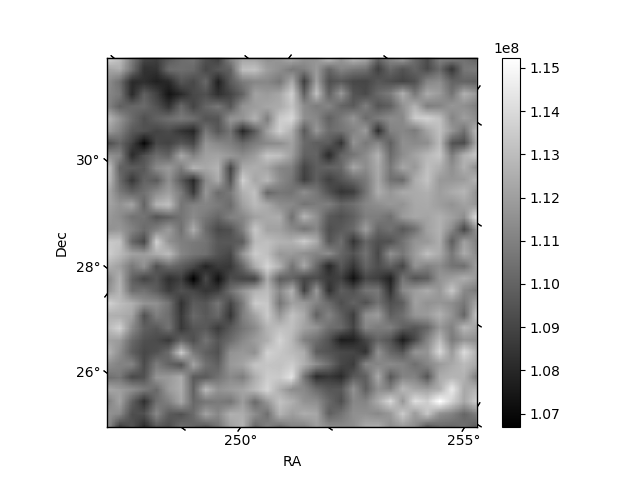
Histogram calculated using DETX and DETY for each event in the final _common_clean file
| Quadrant A | 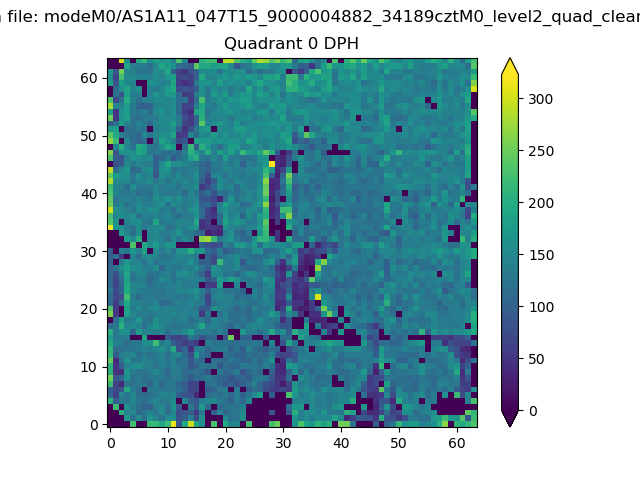 |
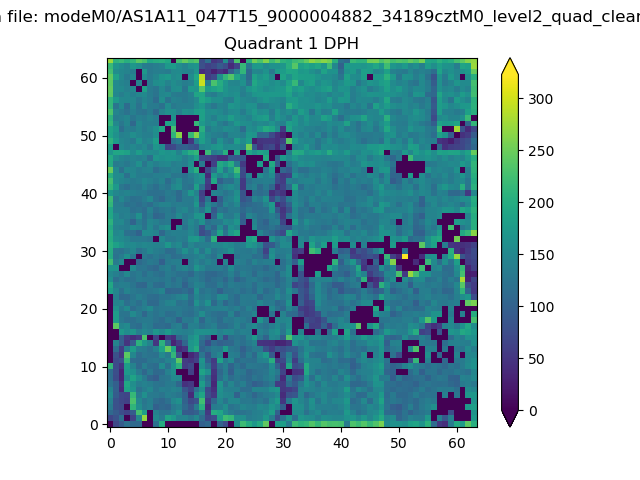 |
Quadrant B |
|---|---|---|---|
| Quadrant D | 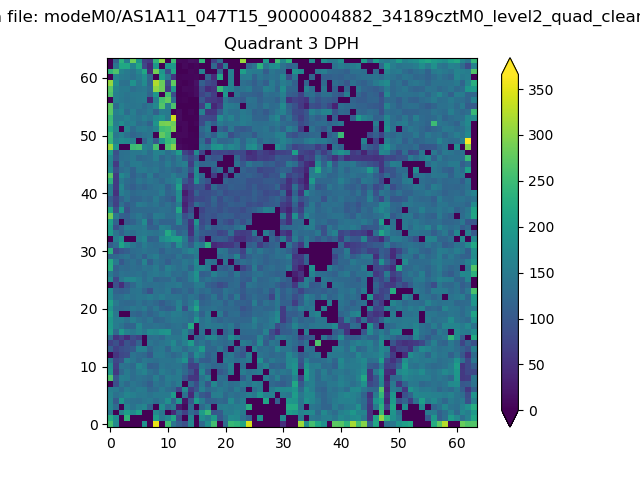 |
 |
Quadrant C |
| Plot type | Count rate plots | Images |
|---|---|---|
| Comparison with Poisson distribution Blue bars denote a histogram of data divided into 1 sec bins. Red curve is a Poisson curve with rate = median count rate of data. |
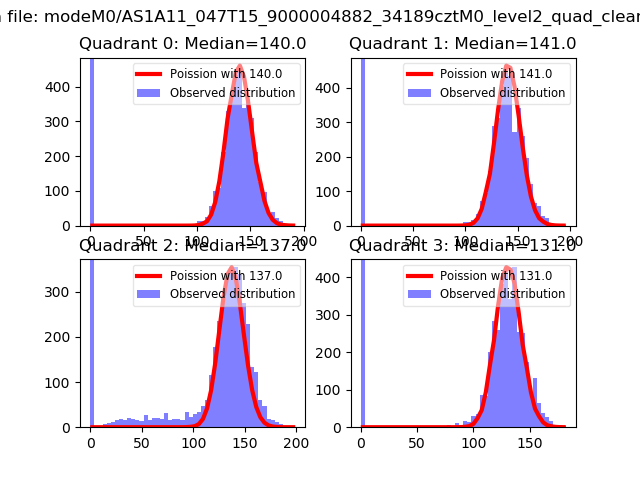 |
 |
| Quadrant-wise count rates Data is divided into 100 sec bins |
 |
|
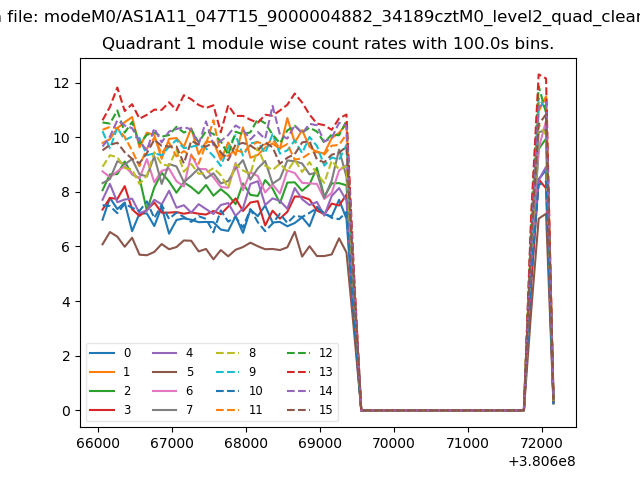
| Module-wise count rates for Quadrant A Data is divided into 100 sec bins |
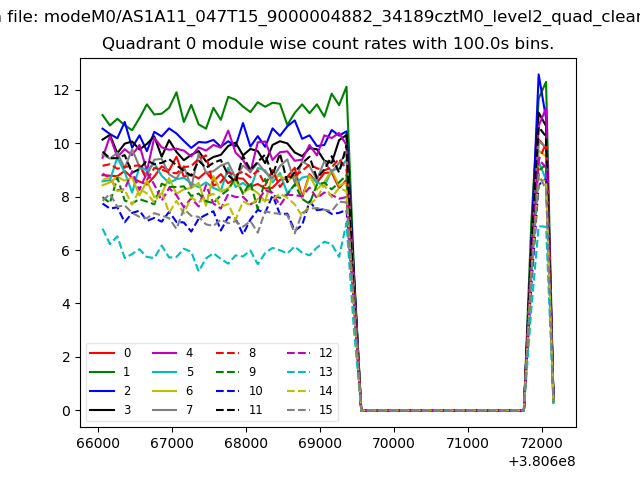 |
 |
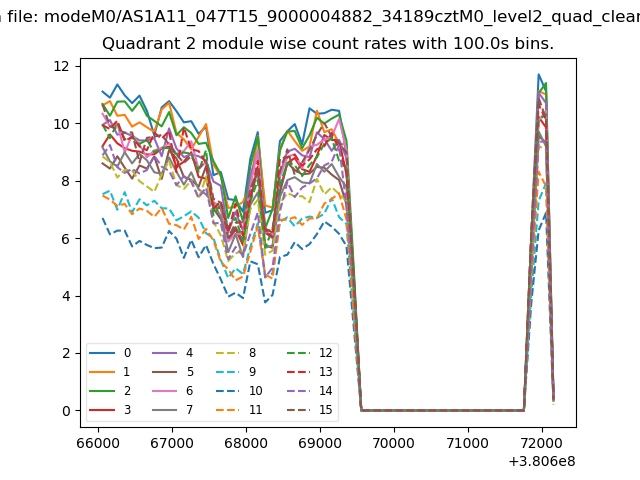
| Module-wise count rates for Quadrant B Data is divided into 100 sec bins |
 |
 |
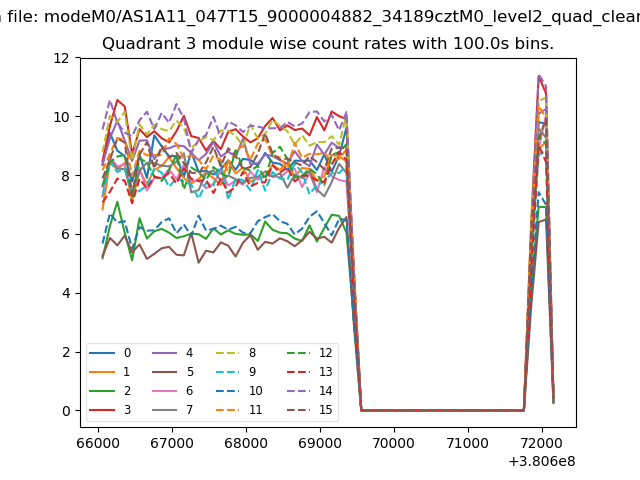
| Module-wise count rates for Quadrant C Data is divided into 100 sec bins |
 |
 |
| Module-wise count rates for Quadrant D Data is divided into 100 sec bins |
 |
 |
| Parameter | Plot |
|---|---|
| CZT HV Monitor | 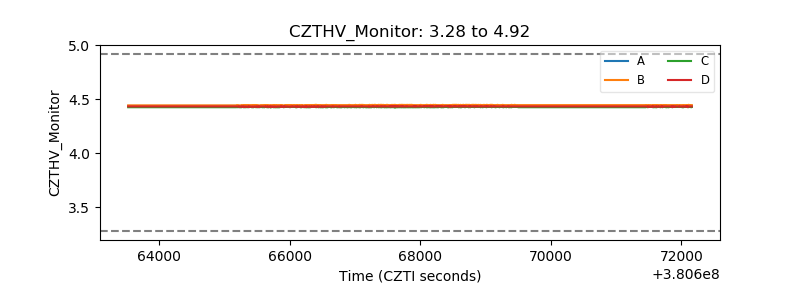 |
| D_VDD | 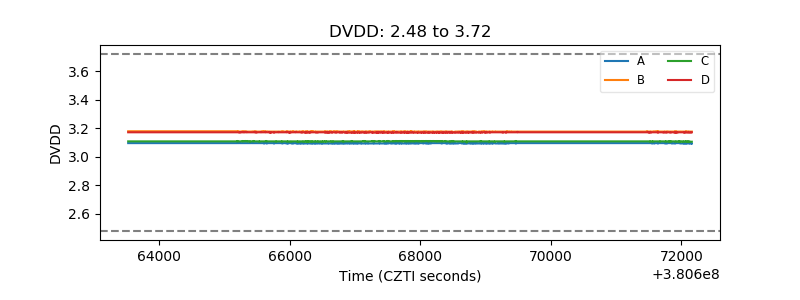 |
| Temperature 1 | 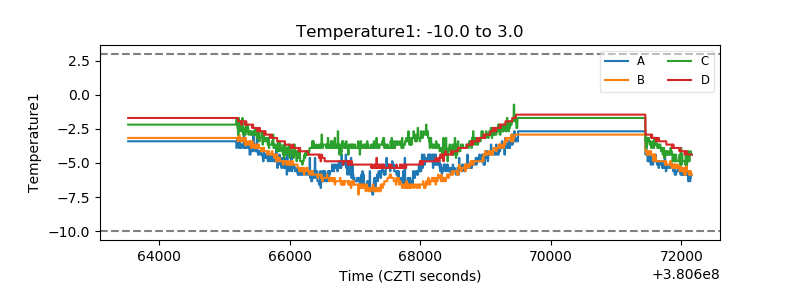 |
| Veto HV Monitor | 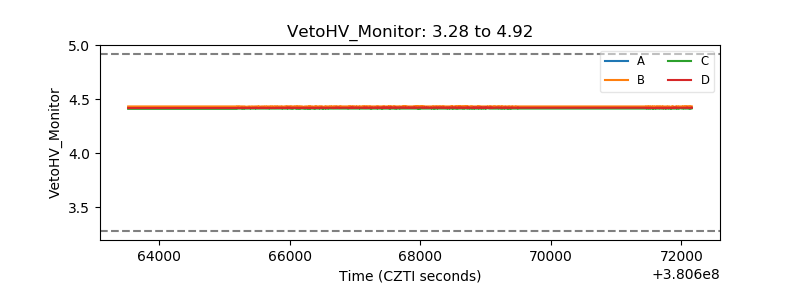 |
| Veto LLD | 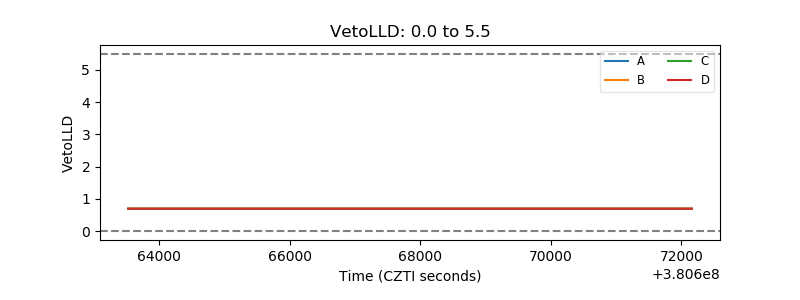 |
| Alpha Counter |  |
| _CPM_Rate | 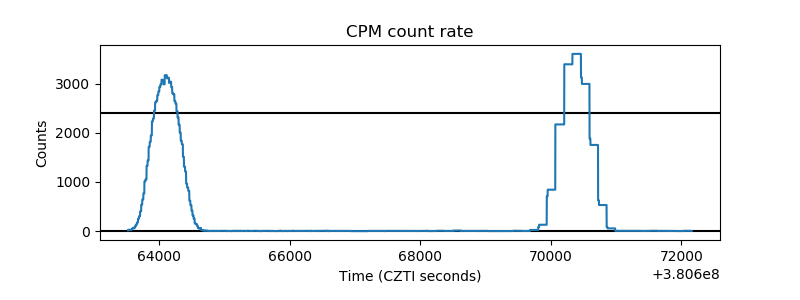 |
| CZT Counter | 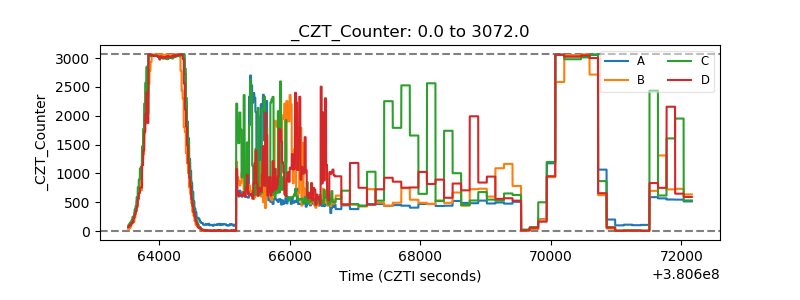 |
| +2.5 Volts monitor |  |
| +5 Volts monitor |  |
| _ROLL_ROT | 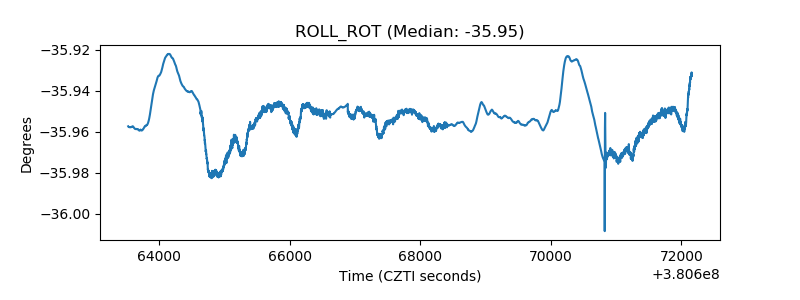 |
| _Roll_DEC | 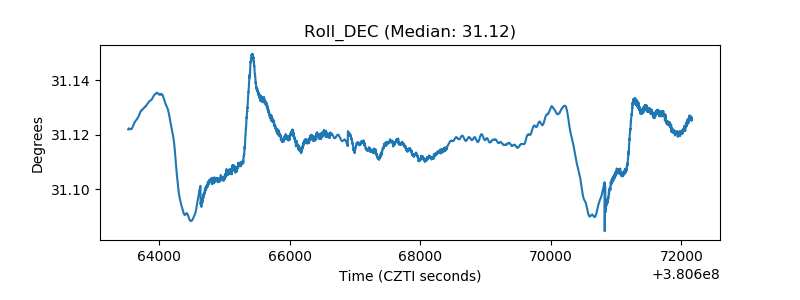 |
| _Roll_RA | 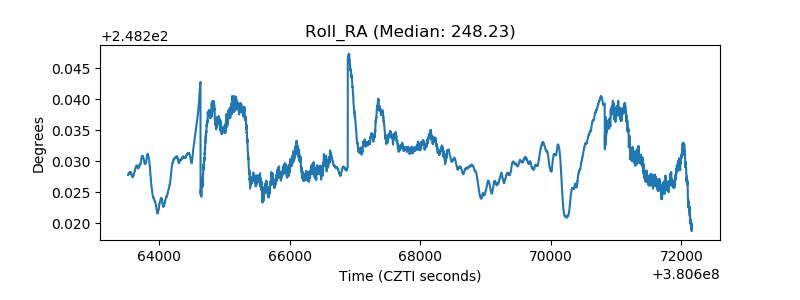 |
| Veto Counter | 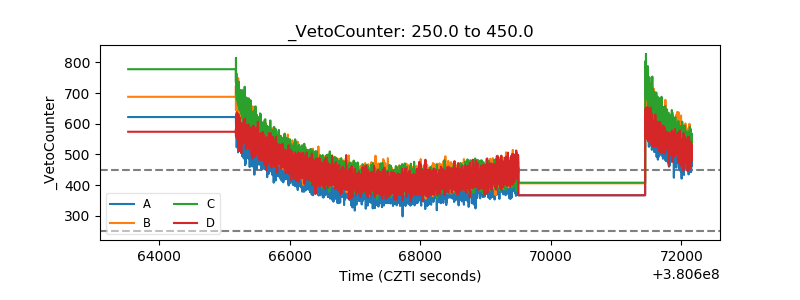 |