| Param | Original file | Final file |
|---|---|---|
| Filename | modeM0/AS1T04_086T01_9000004884_34213cztM0_level2.evt | modeM0/AS1T04_086T01_9000004884_34213cztM0_level2_quad_clean.evt |
| Size (bytes) | 1,485,792,000 | 198,671,040 |
| Size | 1.4 GB | 189.5 MB |
| Events in quadrant A | 7,214,445 | 1,278,208 |
| Events in quadrant B | 14,020,662 | 1,217,492 |
| Events in quadrant C | 9,744,030 | 1,256,775 |
| Events in quadrant D | 12,961,022 | 1,181,056 |
| Mode SS | |||
|---|---|---|---|
| Quadrant | BADHDUFLAG | Total packets | Discarded packets |
| A | 0 | 318 | 0 |
| B | 0 | 318 | 0 |
| C | 0 | 318 | 0 |
| D | 0 | 318 | 0 |
| Mode M9 | |||
|---|---|---|---|
| Quadrant | BADHDUFLAG | Total packets | Discarded packets |
| A | 0 | 51 | 0 |
| B | 0 | 51 | 0 |
| C | 0 | 51 | 0 |
| D | 0 | 52 | 0 |
| Mode M0 | |||
|---|---|---|---|
| Quadrant | BADHDUFLAG | Total packets | Discarded packets |
| A | 0 | 32013 | 5 |
| B | 0 | 52121 | 4 |
| C | 0 | 38557 | 4 |
| D | 0 | 48947 | 4 |
| Quadrant | Total seconds | Saturated seconds | Saturation percentage |
|---|---|---|---|
| A | 15702 | 28 | 0.178321% |
| B | 15702 | 1910 | 12.164056% |
| C | 15702 | 541 | 3.445421% |
| D | 15702 | 1042 | 6.636097% |
Noise dominated data is calculated using 1-second bins in cleaned event files. If a bin has >2000 counts, and if more than 50% of those come from <1% of pixels, then it is considered to be noise-dominated and hence unusable.
| Quadrant | # 1 sec bins | Bins with >0 counts | Bins with >2000 counts | High rate bins dominated by noise | Noise dominated (total time) | Noise dominated (detector-on time) | Marked lightcurve |
|---|---|---|---|---|---|---|---|
| A | 19850 | 15705 | 7 | 7 | 0.04% | 0.04% | 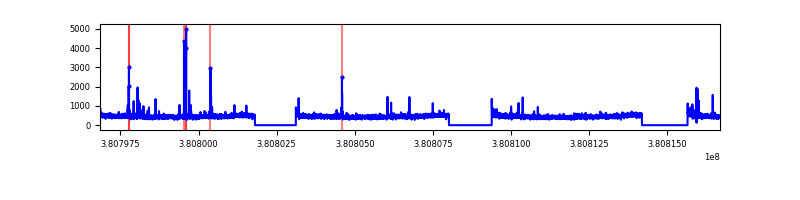 |
| B | 19850 | 15705 | 1276 | 1276 | 6.43% | 8.12% | 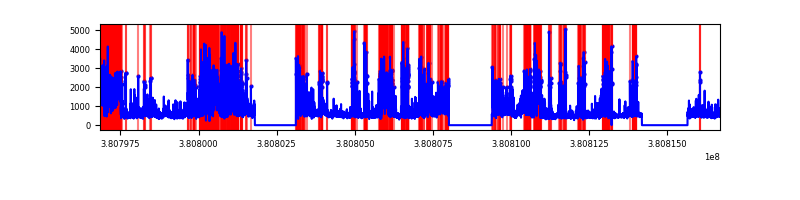 |
| C | 19850 | 15705 | 339 | 339 | 1.71% | 2.16% | 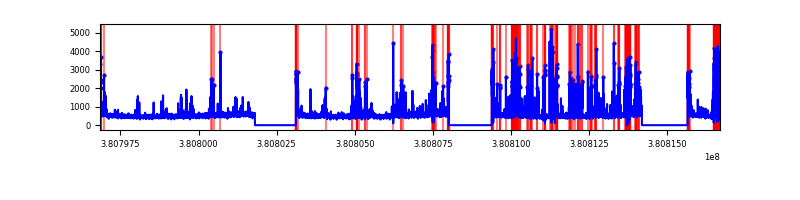 |
| D | 19850 | 15705 | 906 | 906 | 4.56% | 5.77% | 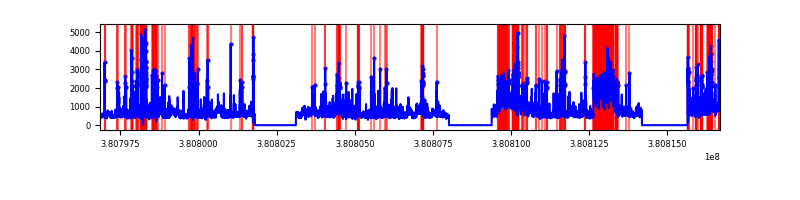 |
Top three noisy pixels from each quadrant. If the there are fewer than three noisy pixels in the level2.evt file, extra rows are filled as -1
| Pixel properties | Quadrant properties | ||||||
|---|---|---|---|---|---|---|---|
| Quadrant | DetID | PixID | Counts | Sigma | Mean | Median | Sigma |
| A | 9 | 143 | 152513 | 420.39 | 1800 | 1760 | 358.6 |
| A | 10 | 83 | 50292 | 135.33 | 1800 | 1760 | 358.6 |
| A | 13 | 6 | 42283 | 113.0 | 1800 | 1760 | 358.6 |
| B | 5 | 172 | 3055649 | 9266.17 | 1725 | 1677 | 329.6 |
| B | 5 | 31 | 2631133 | 7978.13 | 1725 | 1677 | 329.6 |
| B | 5 | 15 | 709492 | 2147.61 | 1725 | 1677 | 329.6 |
| C | 4 | 254 | 1651940 | 4158.39 | 1740 | 1757 | 396.8 |
| C | 15 | 214 | 678960 | 1706.52 | 1740 | 1757 | 396.8 |
| C | 0 | 10 | 309326 | 775.06 | 1740 | 1757 | 396.8 |
| D | 10 | 118 | 2443395 | 5849.79 | 1728 | 1684 | 417.4 |
| D | 8 | 195 | 2235048 | 5350.63 | 1728 | 1684 | 417.4 |
| D | 2 | 250 | 465467 | 1111.12 | 1728 | 1684 | 417.4 |
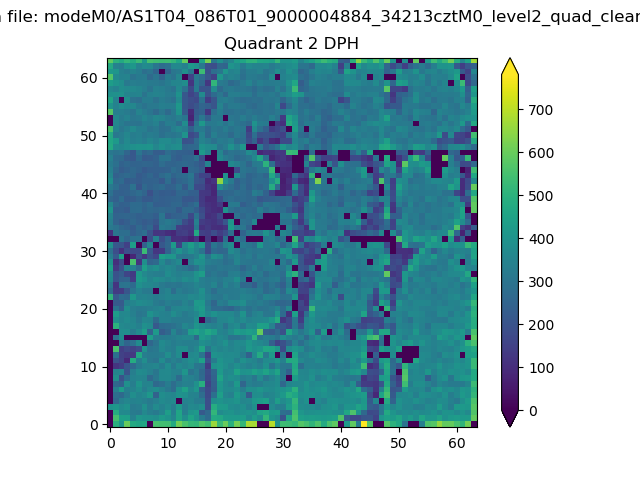
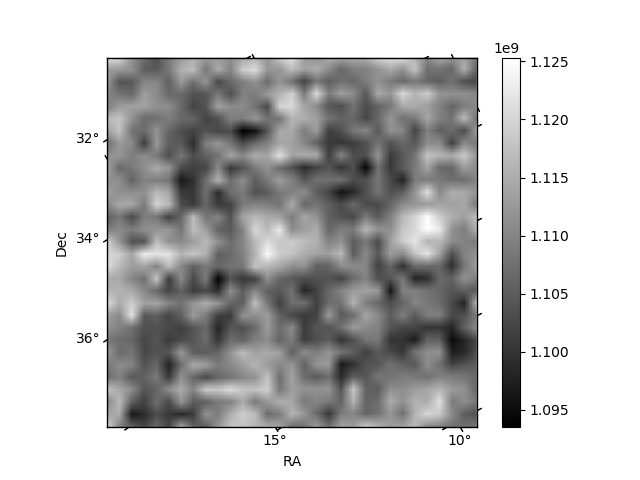
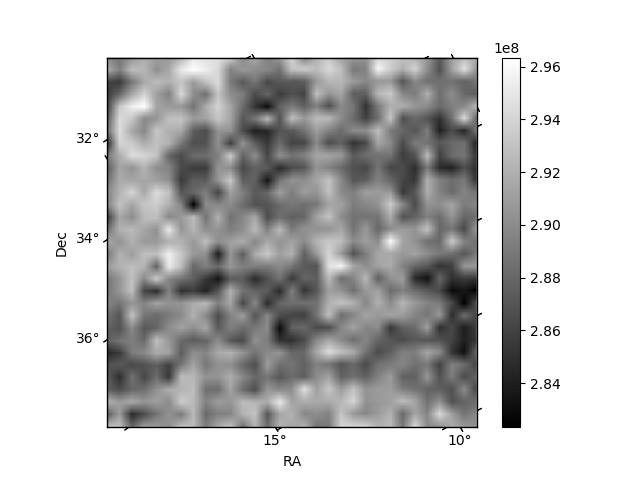
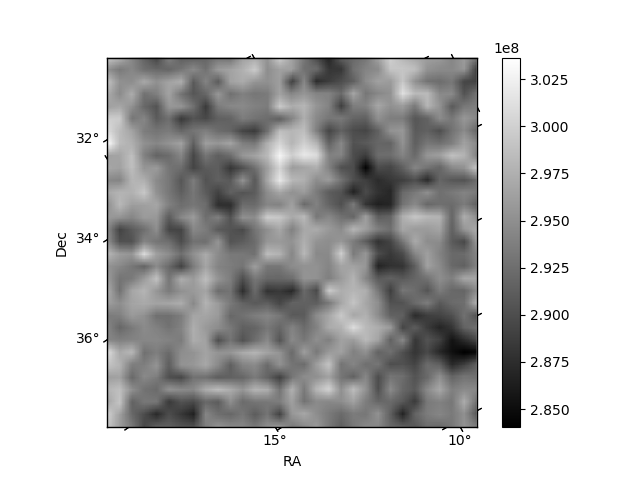
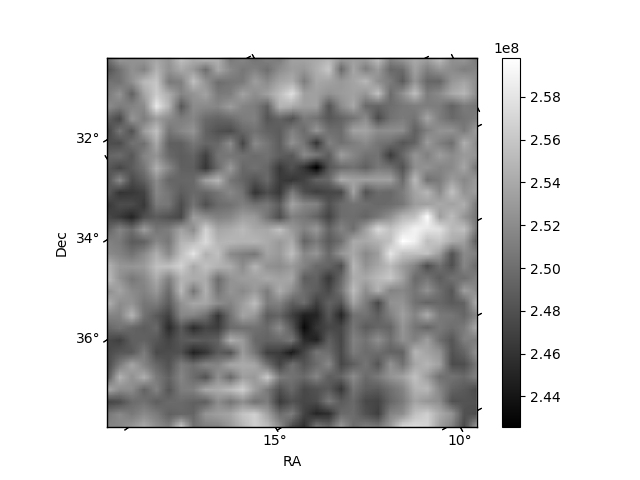
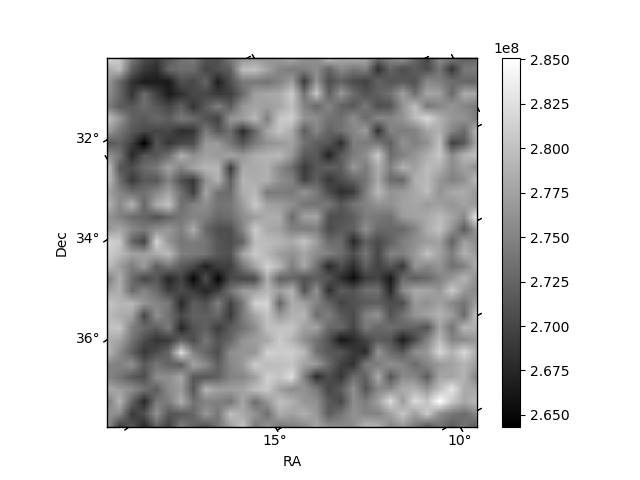
Histogram calculated using DETX and DETY for each event in the final _common_clean file
| Quadrant A | 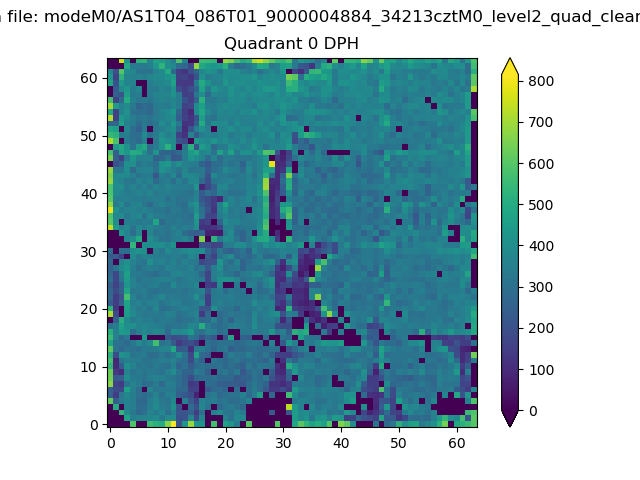 |
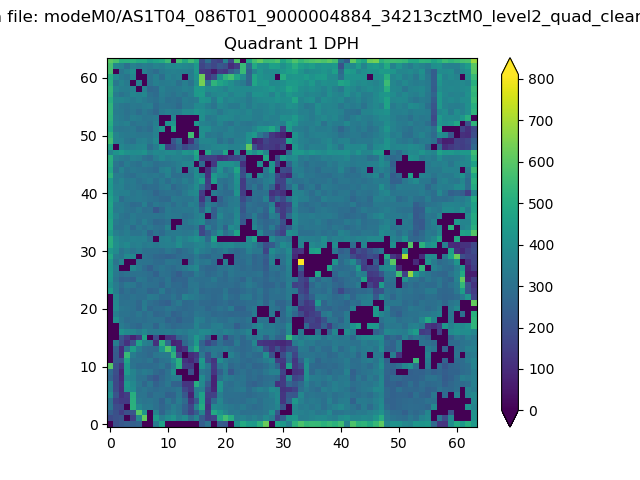 |
Quadrant B |
|---|---|---|---|
| Quadrant D | 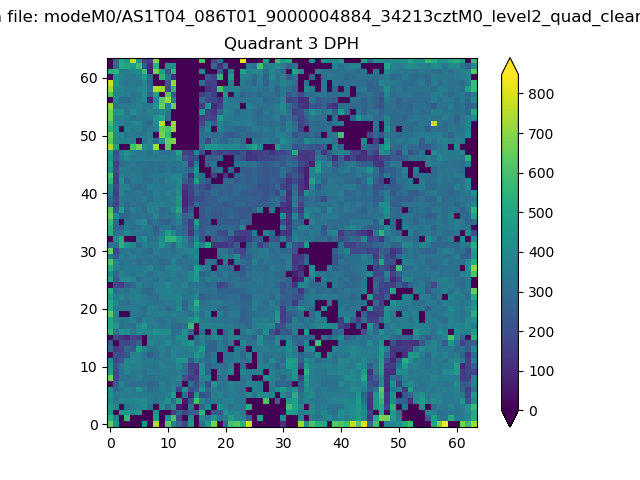 |
 |
Quadrant C |
| Plot type | Count rate plots | Images |
|---|---|---|
| Comparison with Poisson distribution Blue bars denote a histogram of data divided into 1 sec bins. Red curve is a Poisson curve with rate = median count rate of data. |
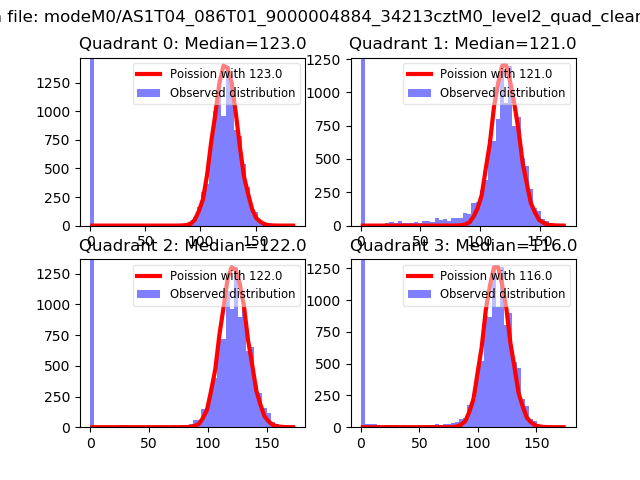 |
 |
| Quadrant-wise count rates Data is divided into 100 sec bins |
 |
|
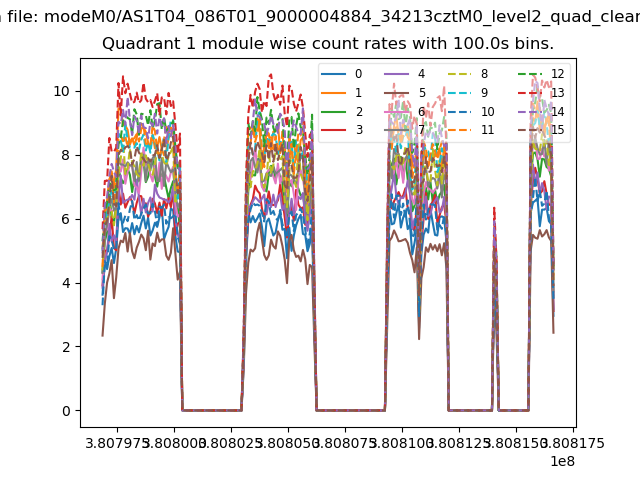
| Module-wise count rates for Quadrant A Data is divided into 100 sec bins |
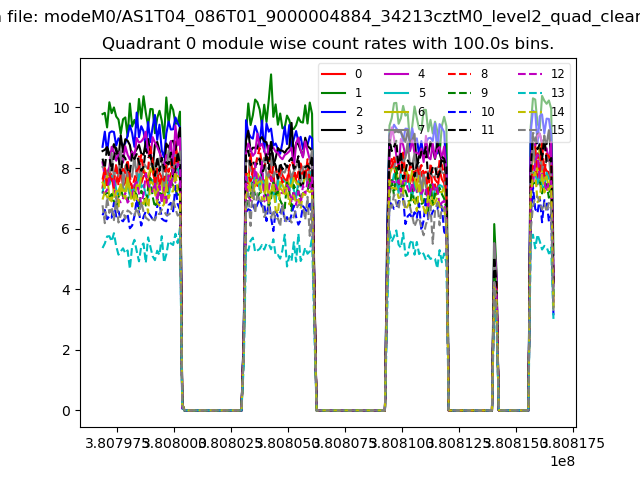 |
 |
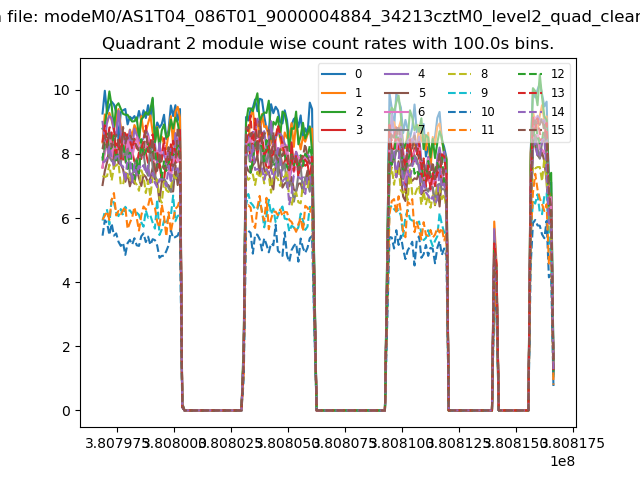
| Module-wise count rates for Quadrant B Data is divided into 100 sec bins |
 |
 |
| Module-wise count rates for Quadrant C Data is divided into 100 sec bins |
 |
 |
| Module-wise count rates for Quadrant D Data is divided into 100 sec bins |
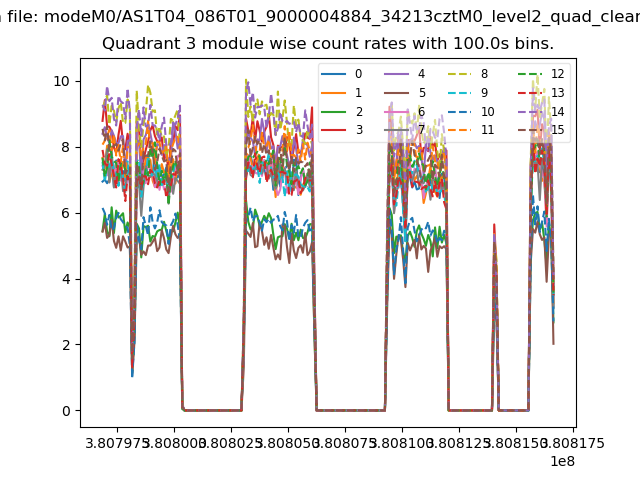 |
 |
| Parameter | Plot |
|---|---|
| CZT HV Monitor | 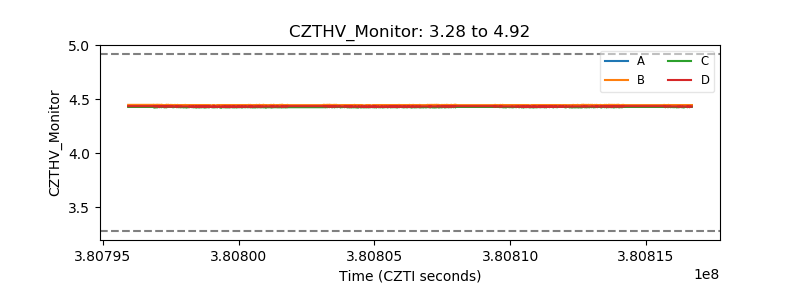 |
| D_VDD | 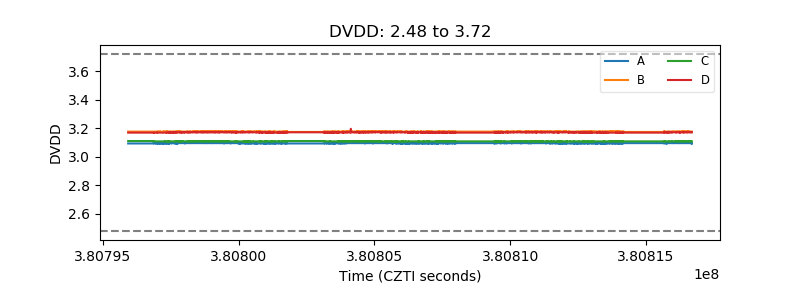 |
| Temperature 1 | 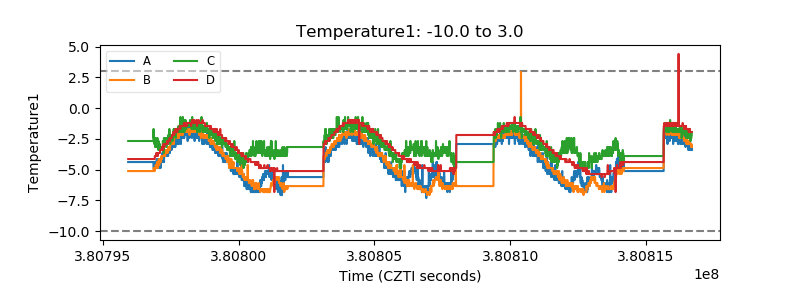 |
| Veto HV Monitor | 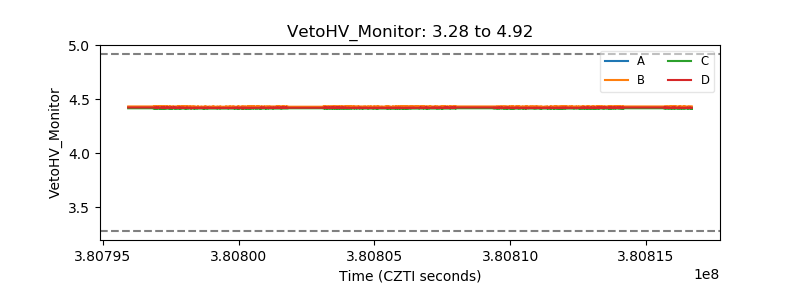 |
| Veto LLD |  |
| Alpha Counter | 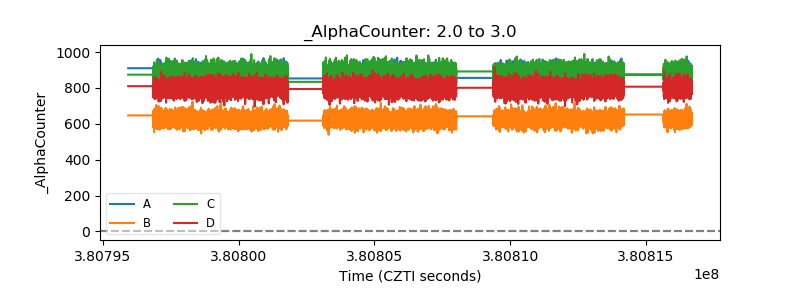 |
| _CPM_Rate |  |
| CZT Counter | 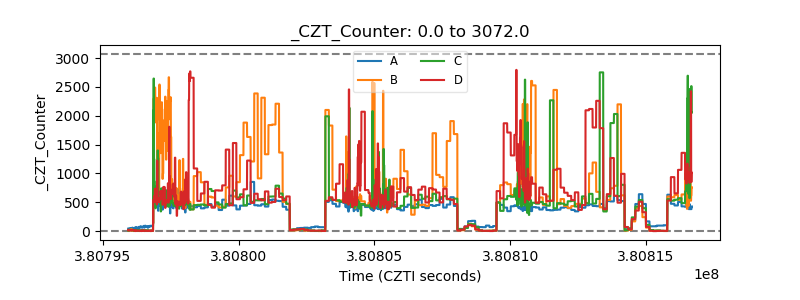 |
| +2.5 Volts monitor |  |
| +5 Volts monitor |  |
| _ROLL_ROT | 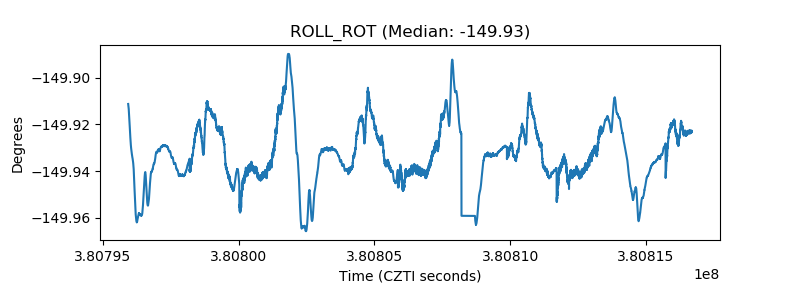 |
| _Roll_DEC | 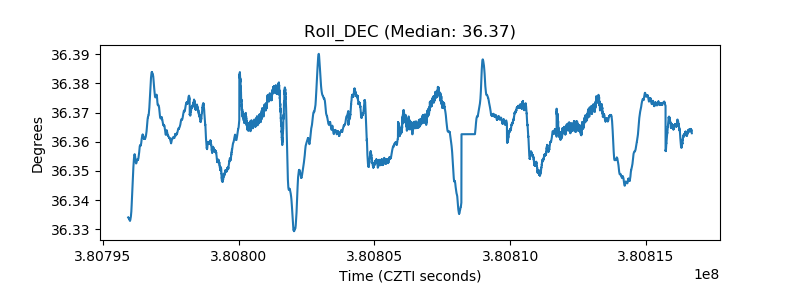 |
| _Roll_RA | 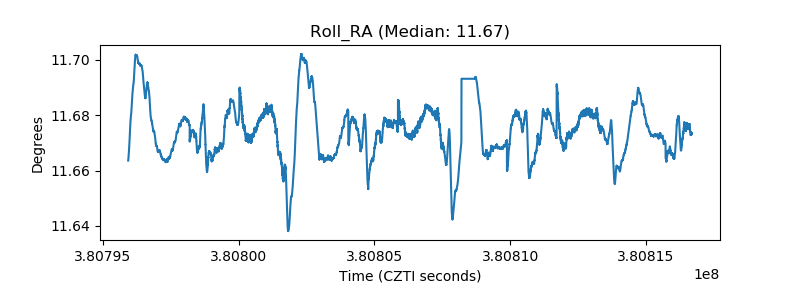 |
| Veto Counter | 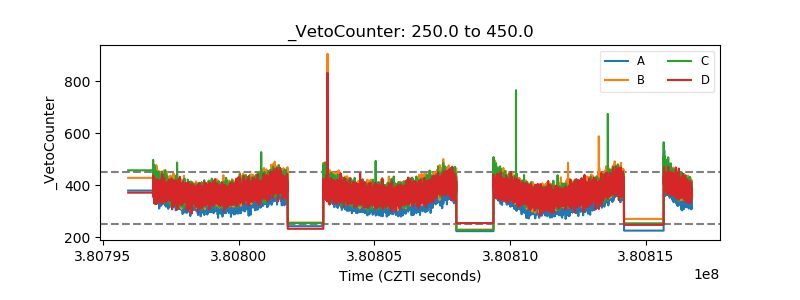 |