| Param | Original file | Final file |
|---|---|---|
| Filename | modeM0/AS1A11_059T09_9000004888_34234cztM0_level2.evt | modeM0/AS1A11_059T09_9000004888_34234cztM0_level2_quad_clean.evt |
| Size (bytes) | 65,381,760 | 15,024,960 |
| Size | 62.4 MB | 14.3 MB |
| Events in quadrant A | 366,905 | 100,652 |
| Events in quadrant B | 395,569 | 104,491 |
| Events in quadrant C | 600,980 | 98,577 |
| Events in quadrant D | 567,296 | 95,726 |
| Mode M0 | |||
|---|---|---|---|
| Quadrant | BADHDUFLAG | Total packets | Discarded packets |
| A | 0 | 1452 | 2 |
| B | 0 | 1548 | 1 |
| C | 0 | 2245 | 1 |
| D | 0 | 2180 | 1 |
| Mode SS | |||
|---|---|---|---|
| Quadrant | BADHDUFLAG | Total packets | Discarded packets |
| A | 0 | 14 | 0 |
| B | 0 | 14 | 0 |
| C | 0 | 14 | 0 |
| D | 0 | 14 | 0 |
| Mode M9 | |||
|---|---|---|---|
| Quadrant | BADHDUFLAG | Total packets | Discarded packets |
| A | 0 | 2 | 0 |
| B | 0 | 2 | 0 |
| C | 0 | 2 | 0 |
| D | 0 | 2 | 0 |
| Quadrant | Total seconds | Saturated seconds | Saturation percentage |
|---|---|---|---|
| A | 677 | 1 | 0.147710% |
| B | 677 | 9 | 1.329394% |
| C | 677 | 74 | 10.930576% |
| D | 677 | 2 | 0.295421% |
Noise dominated data is calculated using 1-second bins in cleaned event files. If a bin has >2000 counts, and if more than 50% of those come from <1% of pixels, then it is considered to be noise-dominated and hence unusable.
| Quadrant | # 1 sec bins | Bins with >0 counts | Bins with >2000 counts | High rate bins dominated by noise | Noise dominated (total time) | Noise dominated (detector-on time) | Marked lightcurve |
|---|---|---|---|---|---|---|---|
| A | 677 | 677 | 0 | 0 | 0.00% | 0.00% | 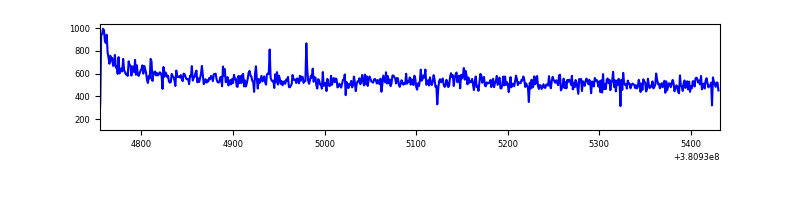 |
| B | 676 | 676 | 1 | 1 | 0.15% | 0.15% | 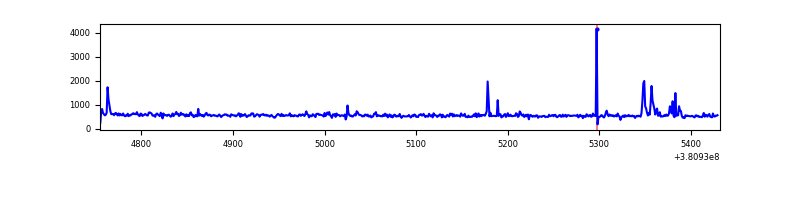 |
| C | 677 | 677 | 59 | 59 | 8.71% | 8.71% | 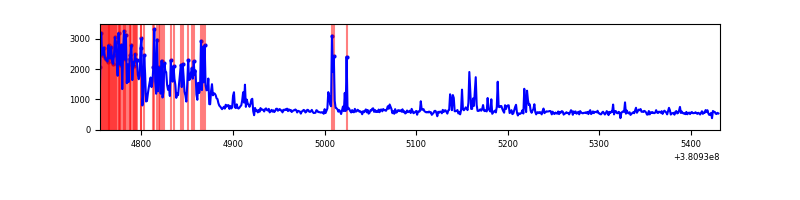 |
| D | 677 | 677 | 1 | 1 | 0.15% | 0.15% | 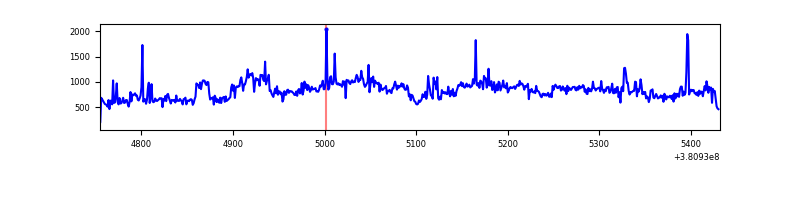 |
Top three noisy pixels from each quadrant. If the there are fewer than three noisy pixels in the level2.evt file, extra rows are filled as -1
| Pixel properties | Quadrant properties | ||||||
|---|---|---|---|---|---|---|---|
| Quadrant | DetID | PixID | Counts | Sigma | Mean | Median | Sigma |
| A | 10 | 83 | 9527 | 478.57 | 91 | 89 | 19.7 |
| A | 15 | 169 | 3417 | 168.75 | 91 | 89 | 19.7 |
| A | 13 | 254 | 1249 | 58.82 | 91 | 89 | 19.7 |
| B | 5 | 172 | 26044 | 1323.57 | 91 | 89 | 19.6 |
| B | 0 | 189 | 2097 | 102.4 | 91 | 89 | 19.6 |
| B | 12 | 111 | 1969 | 95.87 | 91 | 89 | 19.6 |
| C | 0 | 10 | 191631 | 8803.41 | 86 | 86 | 21.8 |
| C | 14 | 254 | 31984 | 1466.03 | 86 | 86 | 21.8 |
| C | 15 | 214 | 31913 | 1462.77 | 86 | 86 | 21.8 |
| D | 8 | 195 | 185393 | 7685.4 | 89 | 86 | 24.1 |
| D | 7 | 223 | 15664 | 646.08 | 89 | 86 | 24.1 |
| D | 2 | 120 | 10634 | 437.47 | 89 | 86 | 24.1 |
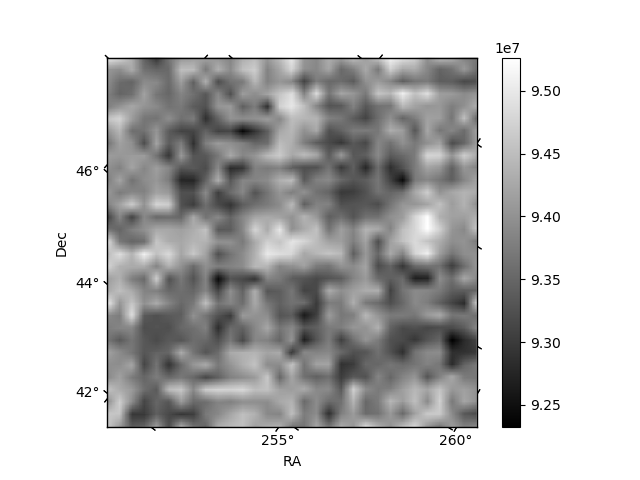
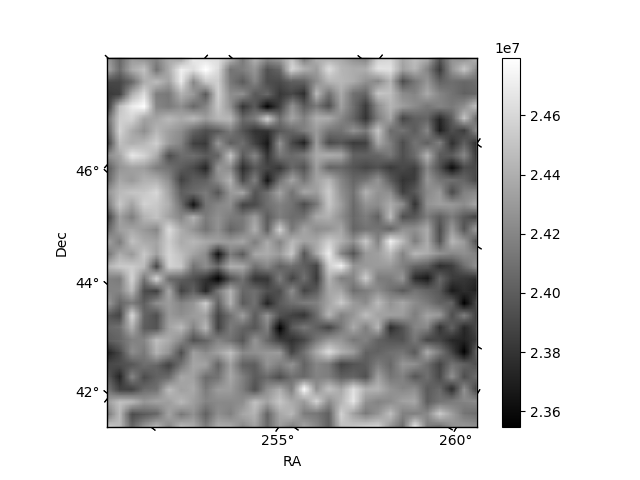
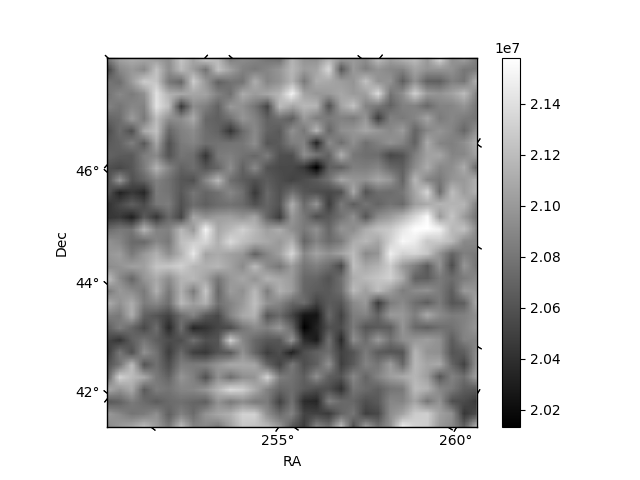
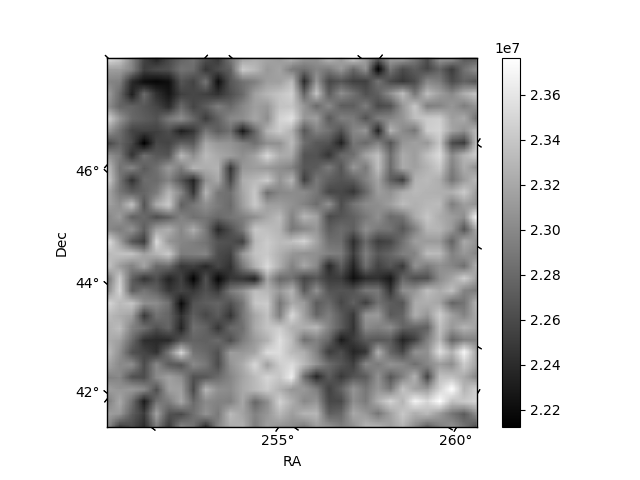
Histogram calculated using DETX and DETY for each event in the final _common_clean file
| Quadrant A | 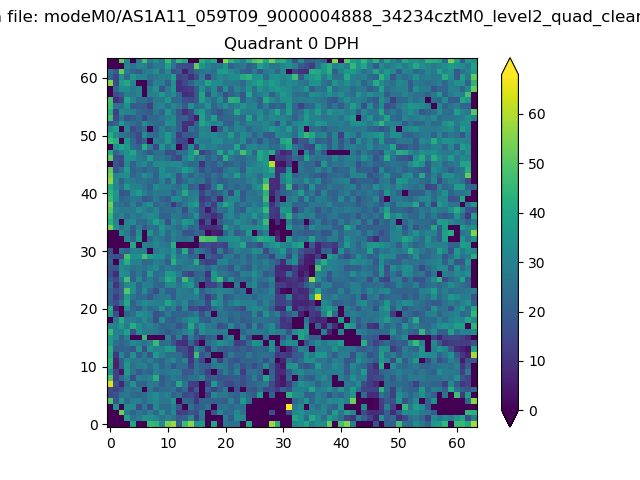 |
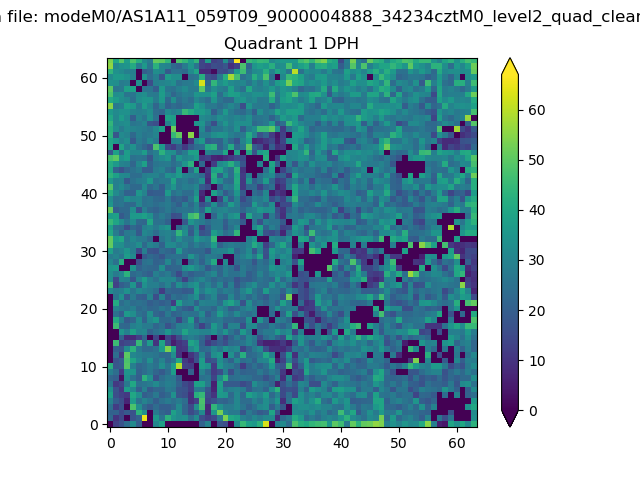 |
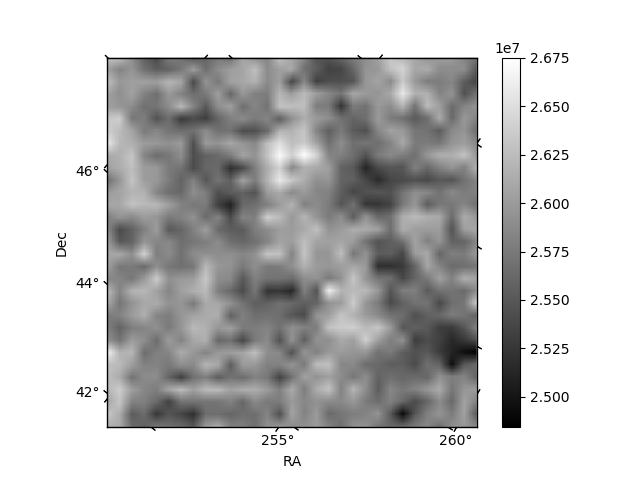
Quadrant B |
|---|---|---|---|
| Quadrant D | 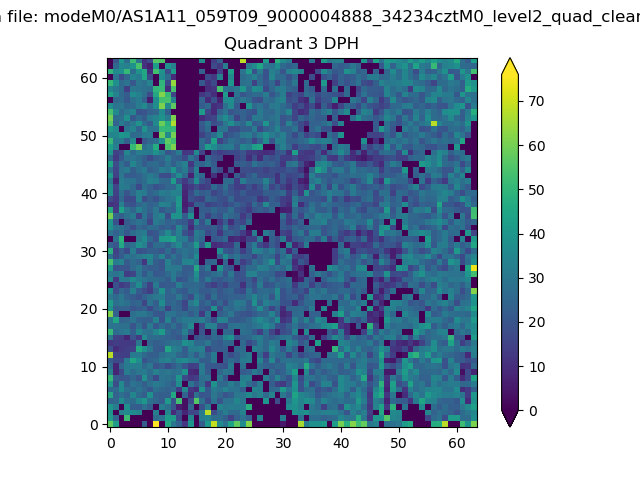 |
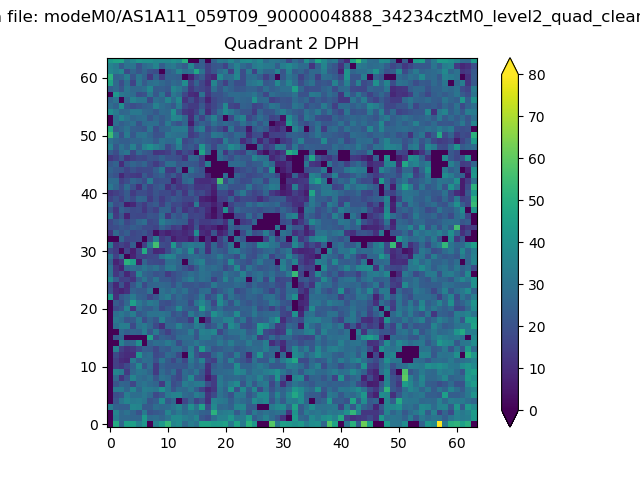 |
Quadrant C |
| Plot type | Count rate plots | Images |
|---|---|---|
| Comparison with Poisson distribution Blue bars denote a histogram of data divided into 1 sec bins. Red curve is a Poisson curve with rate = median count rate of data. |
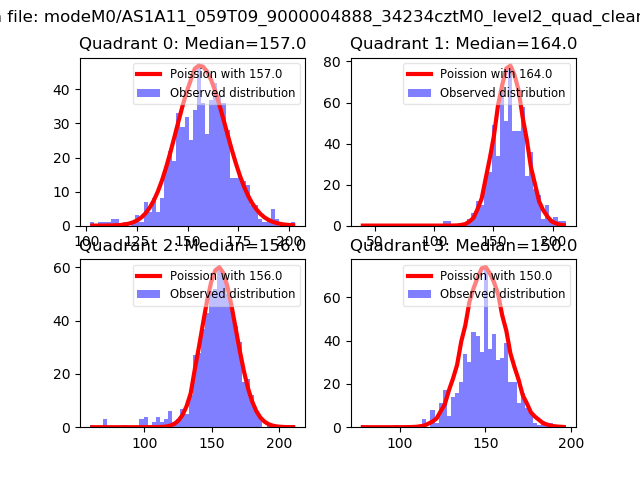 |
 |
| Quadrant-wise count rates Data is divided into 100 sec bins |
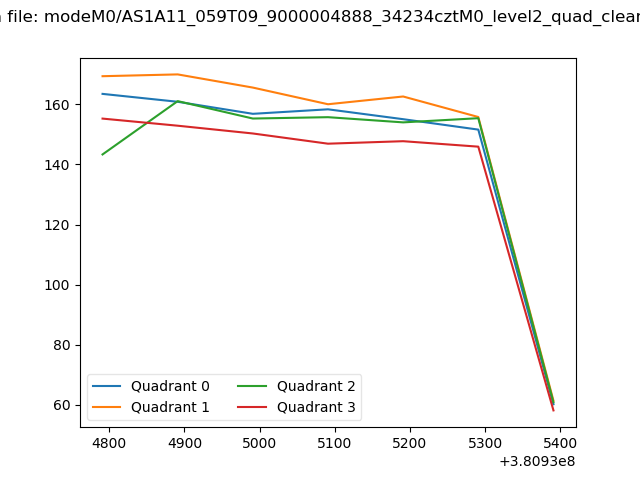 |
|
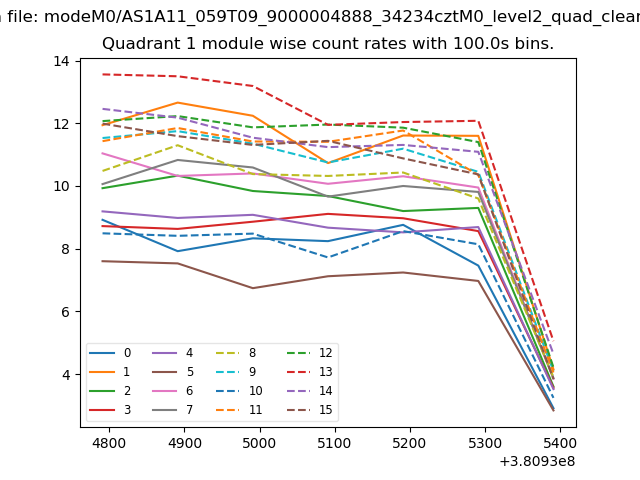
| Module-wise count rates for Quadrant A Data is divided into 100 sec bins |
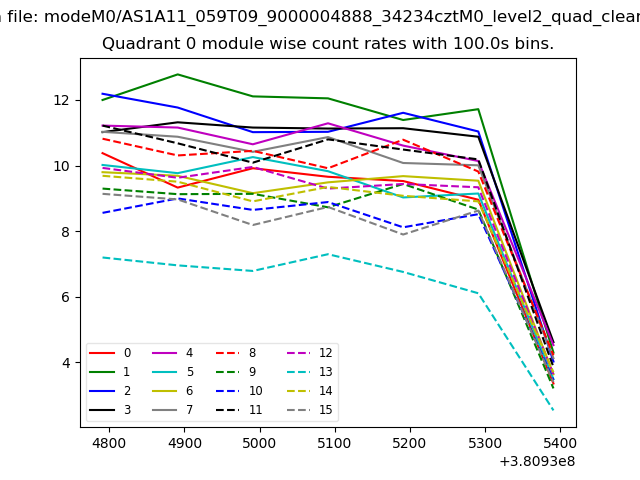 |
 |
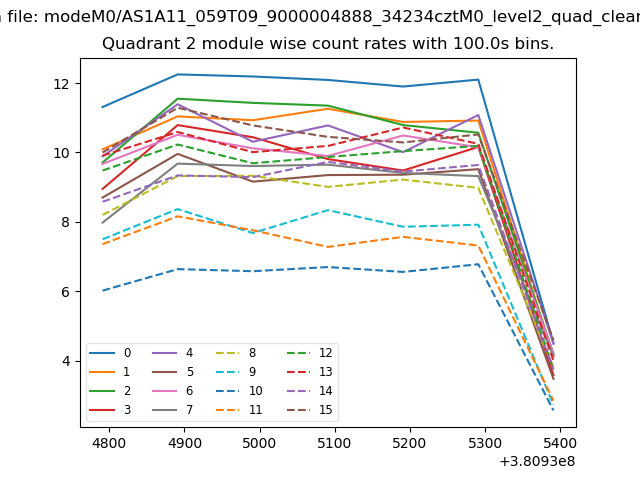
| Module-wise count rates for Quadrant B Data is divided into 100 sec bins |
 |
 |
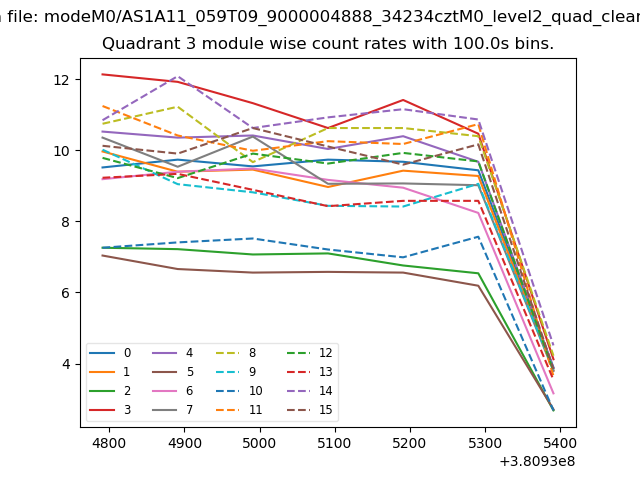
| Module-wise count rates for Quadrant C Data is divided into 100 sec bins |
 |
 |
| Module-wise count rates for Quadrant D Data is divided into 100 sec bins |
 |
 |
| Parameter | Plot |
|---|---|
| CZT HV Monitor | 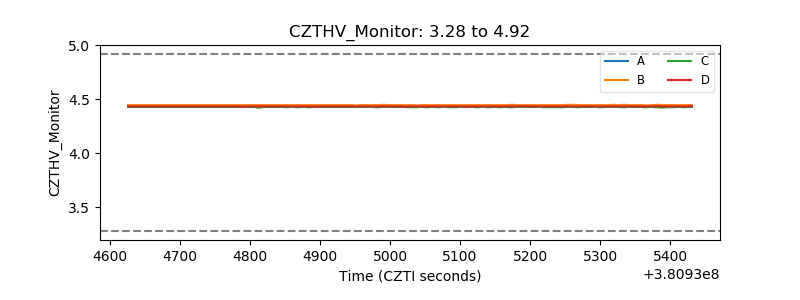 |
| D_VDD | 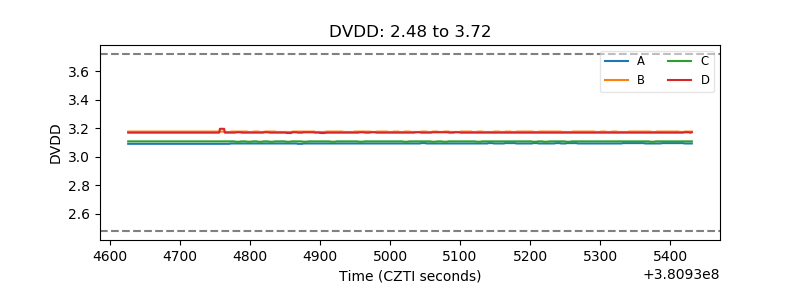 |
| Temperature 1 | 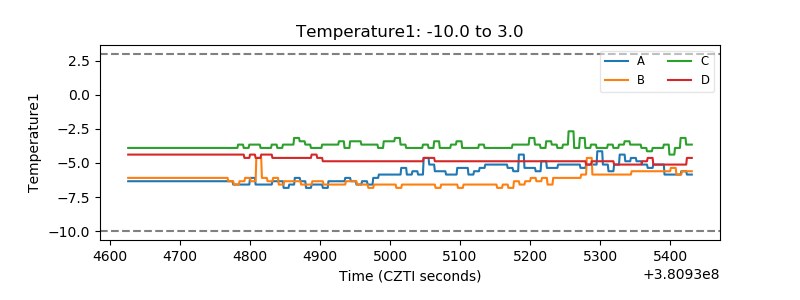 |
| Veto HV Monitor | 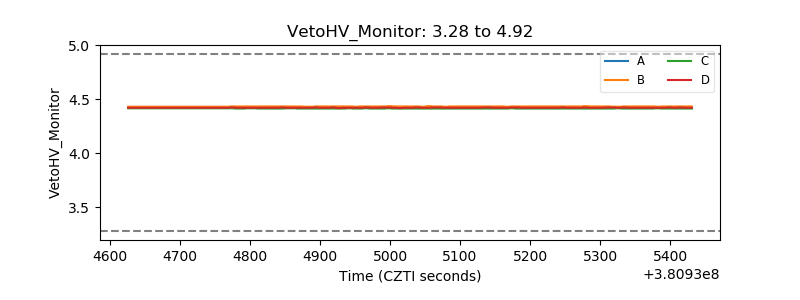 |
| Veto LLD | 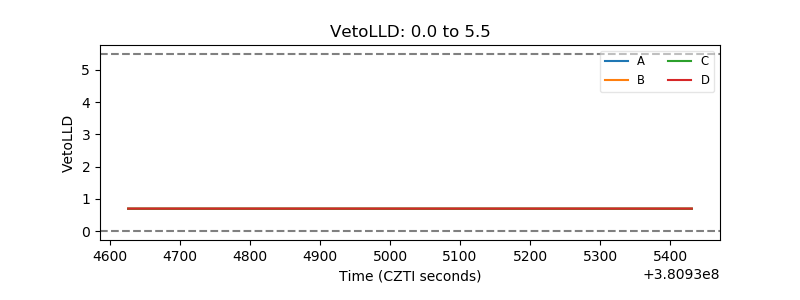 |
| Alpha Counter | 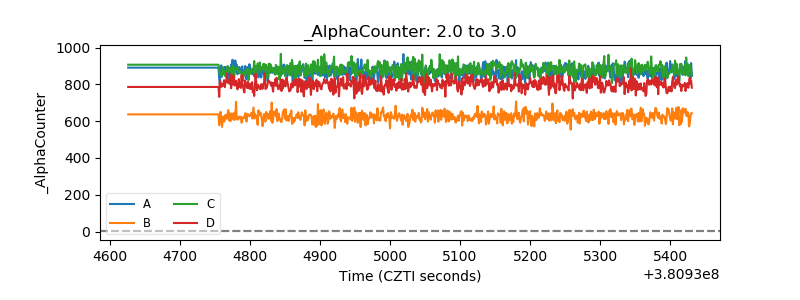 |
| _CPM_Rate | 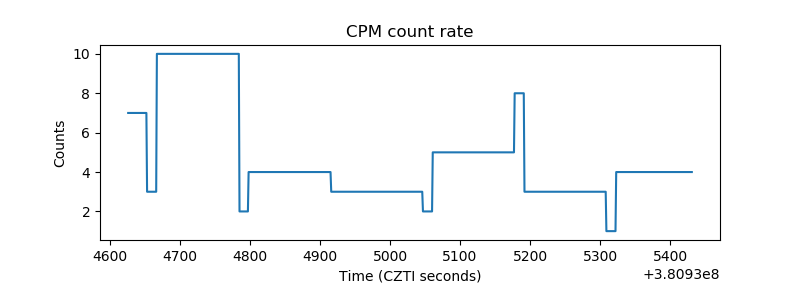 |
| CZT Counter | 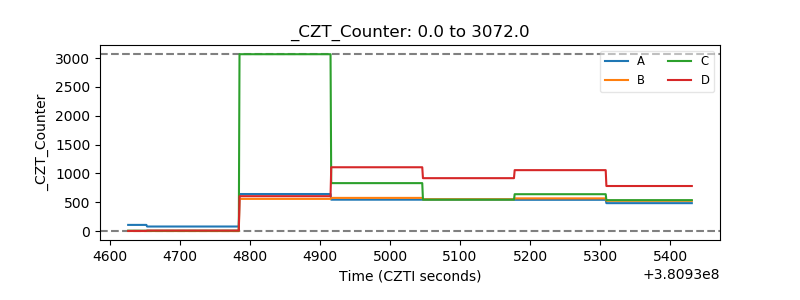 |
| +2.5 Volts monitor | 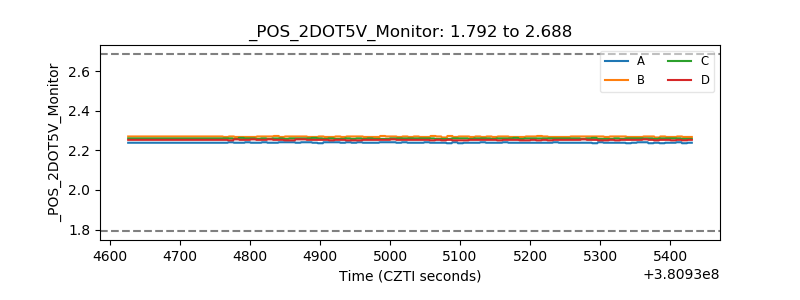 |
| +5 Volts monitor | 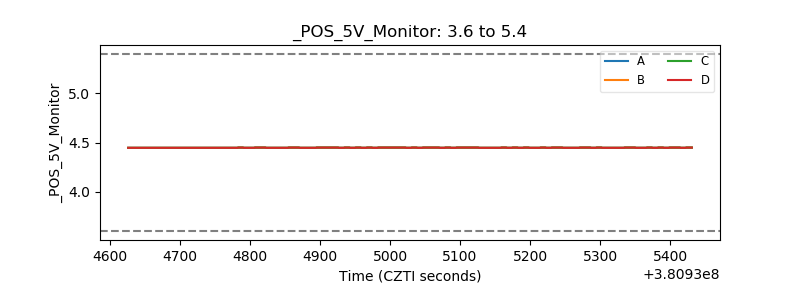 |
| _ROLL_ROT | 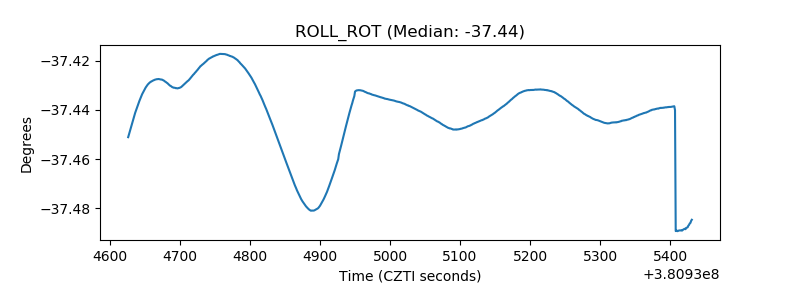 |
| _Roll_DEC | 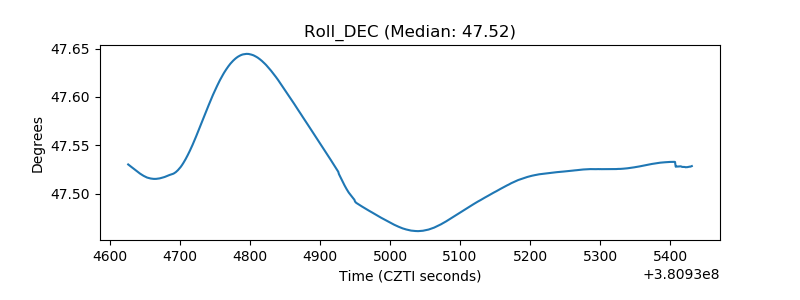 |
| _Roll_RA | 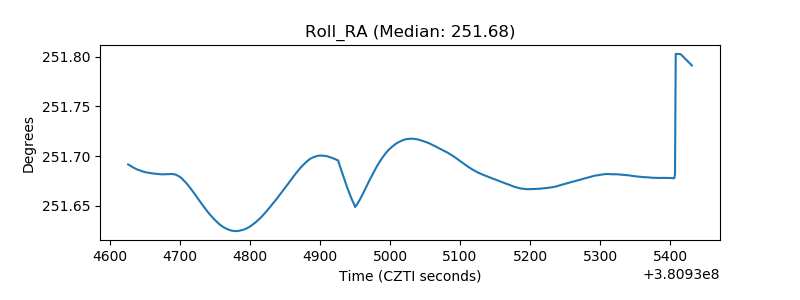 |
| Veto Counter | 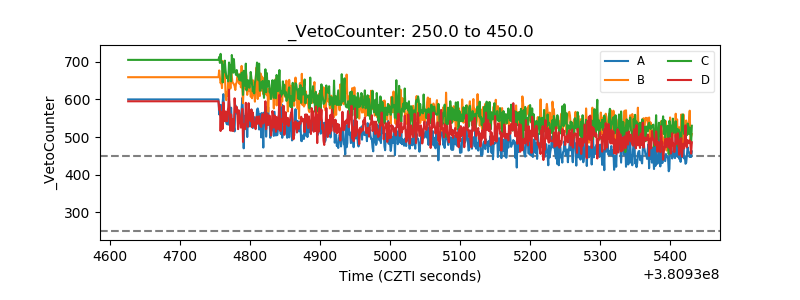 |