| Param | Original file | Final file |
|---|---|---|
| Filename | modeM0/AS1A11_059T09_9000004888_34248cztM0_level2.evt | modeM0/AS1A11_059T09_9000004888_34248cztM0_level2_quad_clean.evt |
| Size (bytes) | 463,973,760 | 84,836,160 |
| Size | 442.5 MB | 80.9 MB |
| Events in quadrant A | 2,738,646 | 559,420 |
| Events in quadrant B | 3,809,644 | 566,172 |
| Events in quadrant C | 3,118,230 | 569,528 |
| Events in quadrant D | 4,050,143 | 527,563 |
| Mode M0 | |||
|---|---|---|---|
| Quadrant | BADHDUFLAG | Total packets | Discarded packets |
| A | 0 | 11189 | 0 |
| B | 0 | 14565 | 0 |
| C | 0 | 12317 | 0 |
| D | 0 | 15453 | 0 |
| Mode SS | |||
|---|---|---|---|
| Quadrant | BADHDUFLAG | Total packets | Discarded packets |
| A | 0 | 100 | 0 |
| B | 0 | 100 | 0 |
| C | 0 | 100 | 0 |
| D | 0 | 100 | 0 |
| Mode M9 | |||
|---|---|---|---|
| Quadrant | BADHDUFLAG | Total packets | Discarded packets |
| A | 0 | 29 | 0 |
| B | 0 | 29 | 0 |
| C | 0 | 29 | 0 |
| D | 0 | 30 | 0 |
| Quadrant | Total seconds | Saturated seconds | Saturation percentage |
|---|---|---|---|
| A | 4940 | 6 | 0.121457% |
| B | 4940 | 435 | 8.805668% |
| C | 4940 | 154 | 3.117409% |
| D | 4940 | 244 | 4.939271% |
Noise dominated data is calculated using 1-second bins in cleaned event files. If a bin has >2000 counts, and if more than 50% of those come from <1% of pixels, then it is considered to be noise-dominated and hence unusable.
| Quadrant | # 1 sec bins | Bins with >0 counts | Bins with >2000 counts | High rate bins dominated by noise | Noise dominated (total time) | Noise dominated (detector-on time) | Marked lightcurve |
|---|---|---|---|---|---|---|---|
| A | 7003 | 4941 | 4 | 4 | 0.06% | 0.08% | 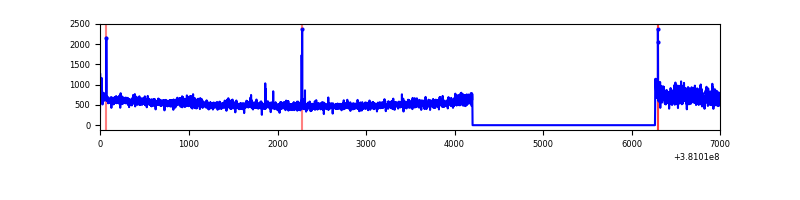 |
| B | 7003 | 4941 | 289 | 289 | 4.13% | 5.85% | 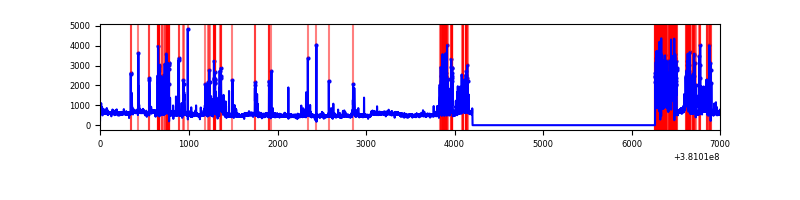 |
| C | 7003 | 4941 | 99 | 99 | 1.41% | 2.00% | 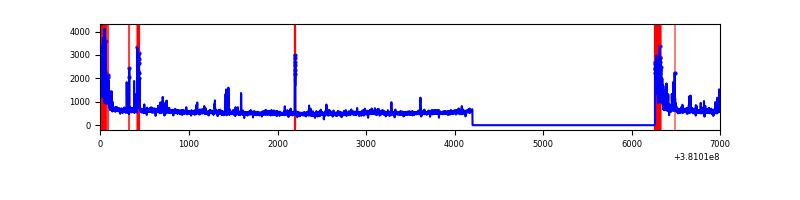 |
| D | 7003 | 4941 | 200 | 200 | 2.86% | 4.05% | 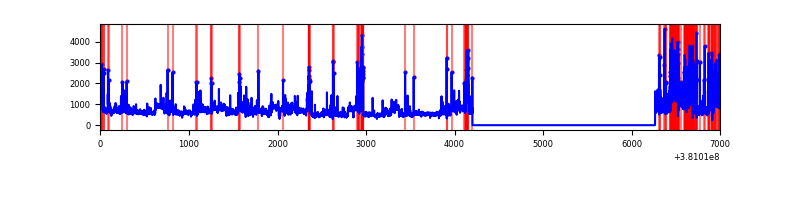 |
Top three noisy pixels from each quadrant. If the there are fewer than three noisy pixels in the level2.evt file, extra rows are filled as -1
| Pixel properties | Quadrant properties | ||||||
|---|---|---|---|---|---|---|---|
| Quadrant | DetID | PixID | Counts | Sigma | Mean | Median | Sigma |
| A | 15 | 47 | 249036 | 1998.39 | 628 | 617 | 124.3 |
| A | 10 | 83 | 24113 | 189.01 | 628 | 617 | 124.3 |
| A | 7 | 16 | 18916 | 147.2 | 628 | 617 | 124.3 |
| B | 5 | 172 | 1193188 | 10464.24 | 609 | 598 | 114.0 |
| B | 0 | 183 | 71940 | 625.98 | 609 | 598 | 114.0 |
| B | 15 | 222 | 39307 | 339.65 | 609 | 598 | 114.0 |
| C | 0 | 10 | 312375 | 2228.16 | 613 | 620 | 139.9 |
| C | 15 | 214 | 213173 | 1519.15 | 613 | 620 | 139.9 |
| C | 0 | 207 | 100396 | 713.11 | 613 | 620 | 139.9 |
| D | 8 | 195 | 701026 | 4809.24 | 605 | 590 | 145.6 |
| D | 7 | 80 | 693144 | 4755.12 | 605 | 590 | 145.6 |
| D | 2 | 250 | 140523 | 960.79 | 605 | 590 | 145.6 |
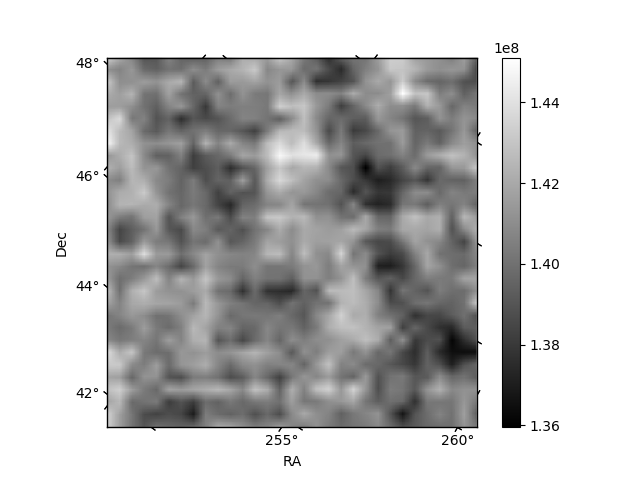
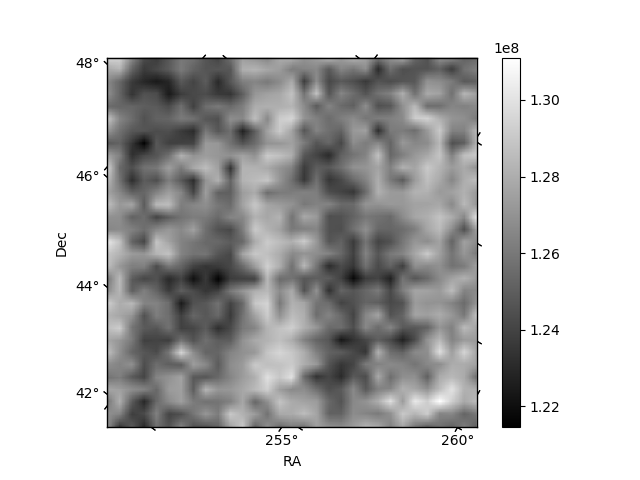
Histogram calculated using DETX and DETY for each event in the final _common_clean file
| Quadrant A | 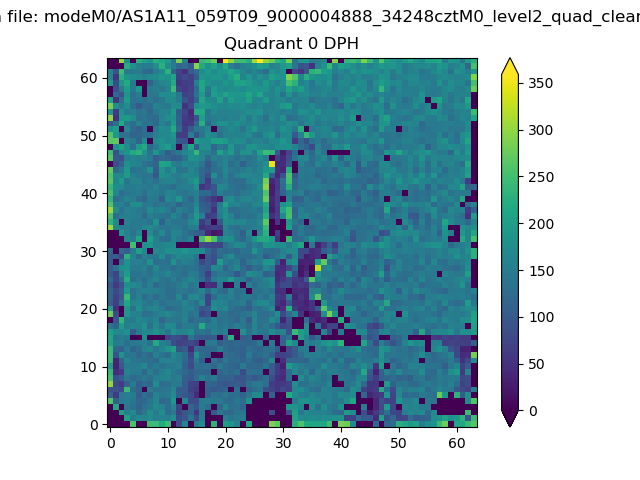 |
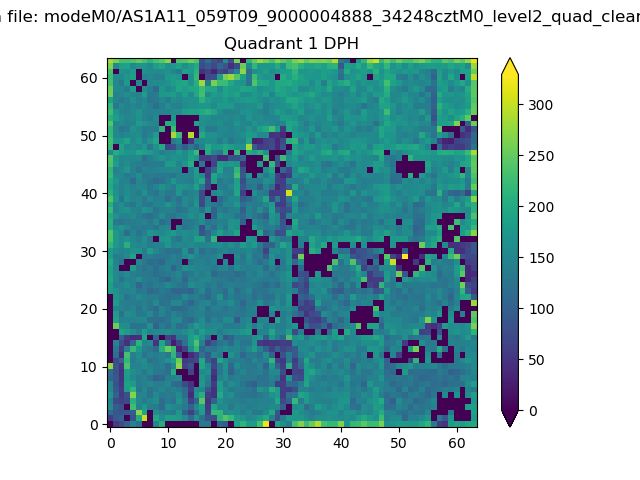 |
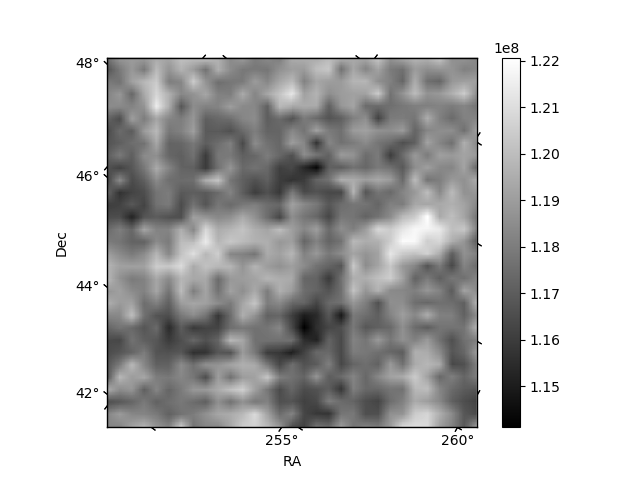
Quadrant B |
|---|---|---|---|
| Quadrant D | 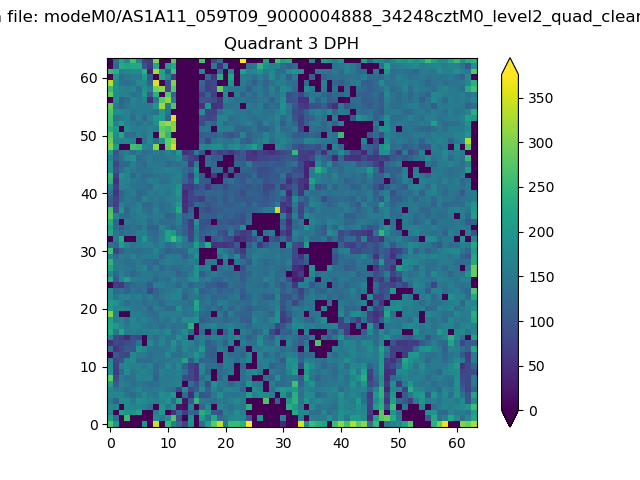 |
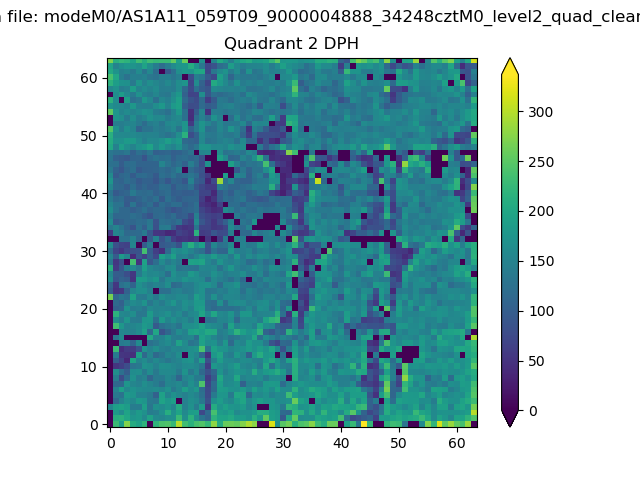 |
Quadrant C |
| Plot type | Count rate plots | Images |
|---|---|---|
| Comparison with Poisson distribution Blue bars denote a histogram of data divided into 1 sec bins. Red curve is a Poisson curve with rate = median count rate of data. |
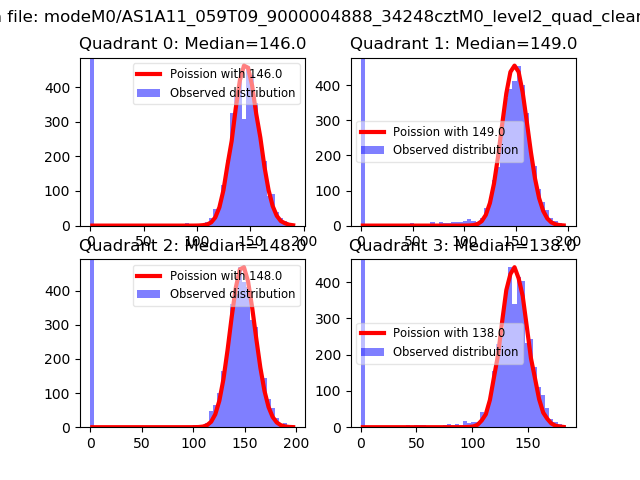 |
 |
| Quadrant-wise count rates Data is divided into 100 sec bins |
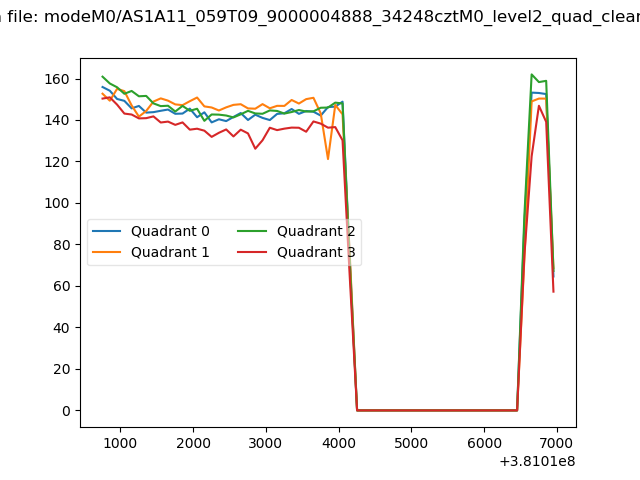 |
|
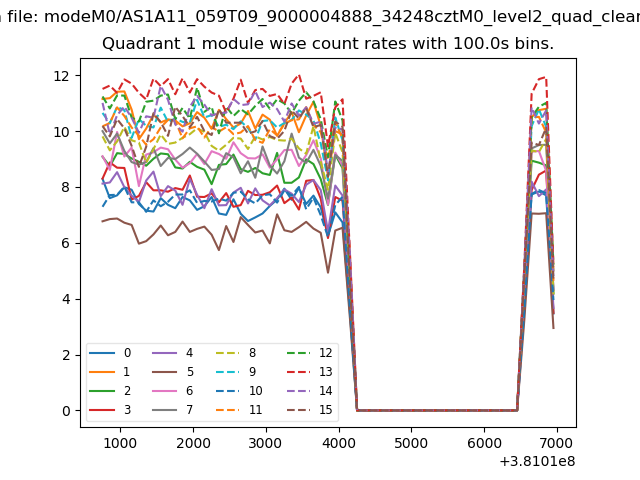
| Module-wise count rates for Quadrant A Data is divided into 100 sec bins |
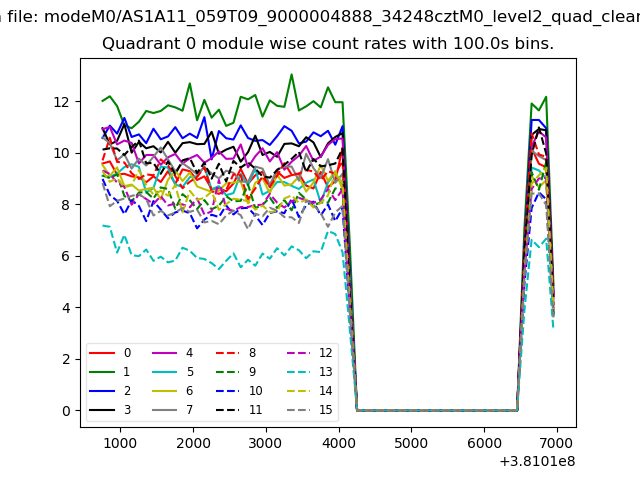 |
 |
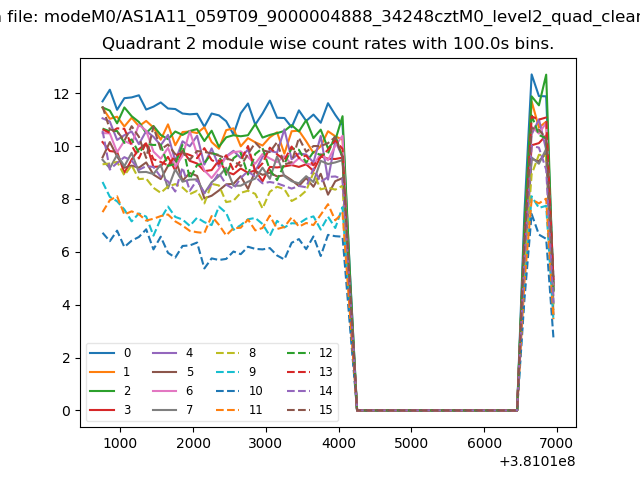
| Module-wise count rates for Quadrant B Data is divided into 100 sec bins |
 |
 |
| Module-wise count rates for Quadrant C Data is divided into 100 sec bins |
 |
 |
| Module-wise count rates for Quadrant D Data is divided into 100 sec bins |
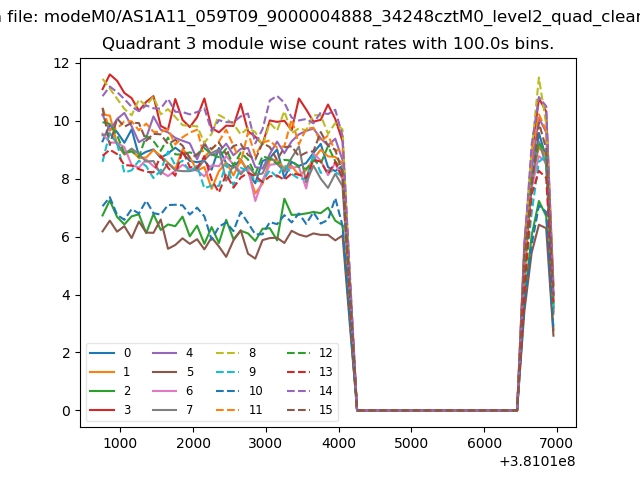 |
 |
| Parameter | Plot |
|---|---|
| CZT HV Monitor | 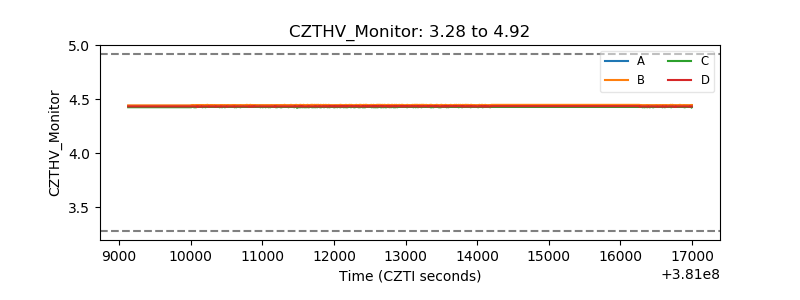 |
| D_VDD | 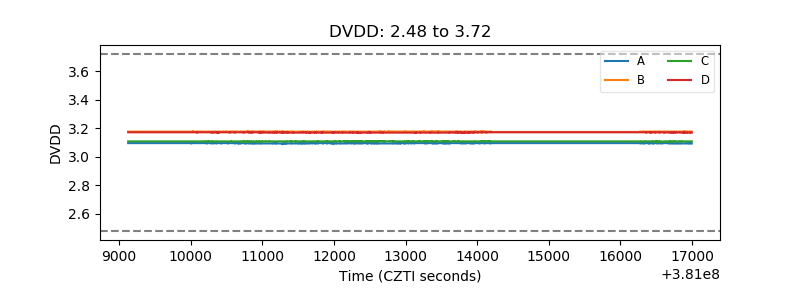 |
| Temperature 1 | 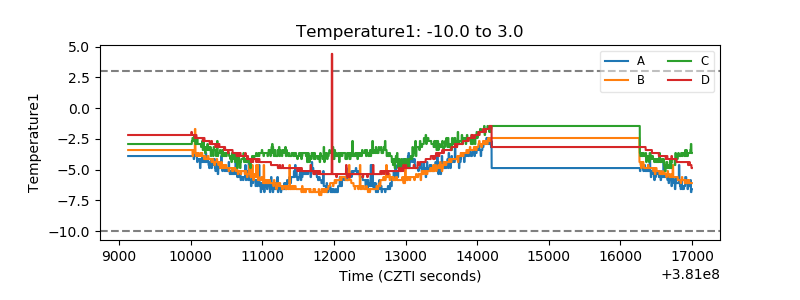 |
| Veto HV Monitor | 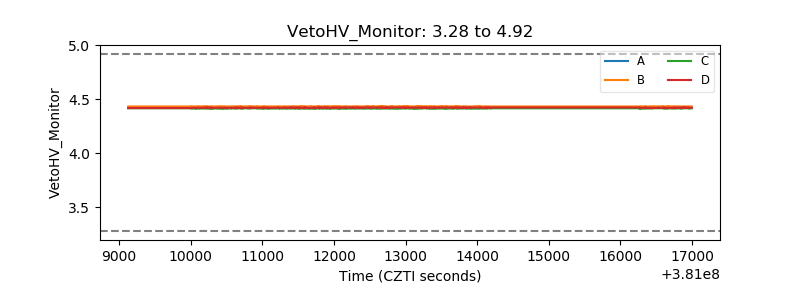 |
| Veto LLD | 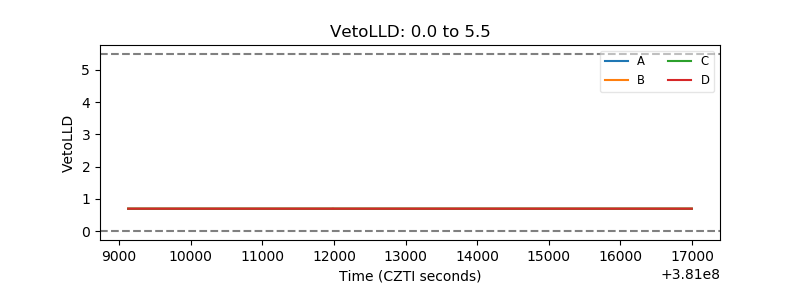 |
| Alpha Counter | 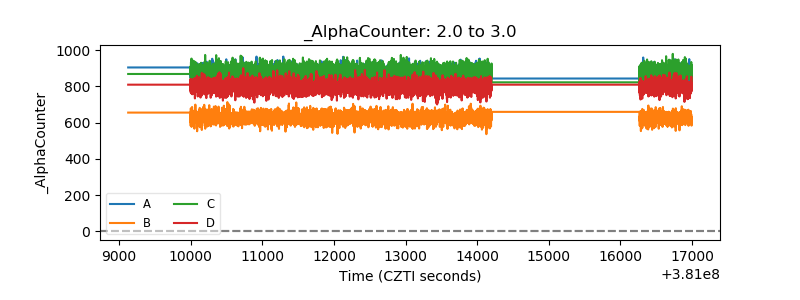 |
| _CPM_Rate |  |
| CZT Counter |  |
| +2.5 Volts monitor |  |
| +5 Volts monitor |  |
| _ROLL_ROT |  |
| _Roll_DEC | 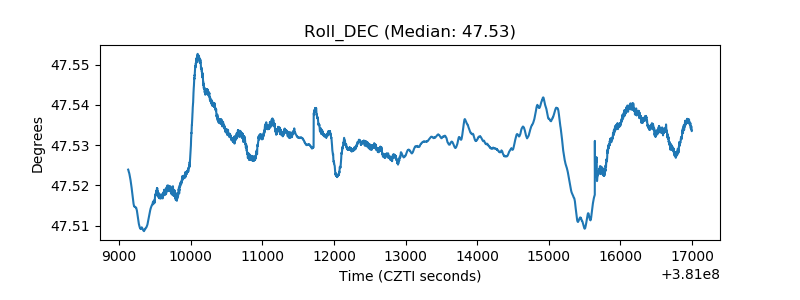 |
| _Roll_RA | 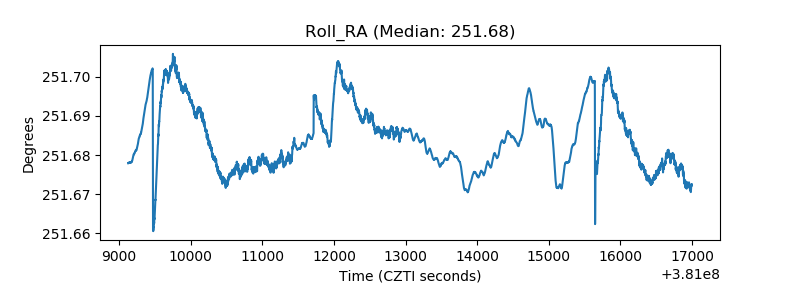 |
| Veto Counter | 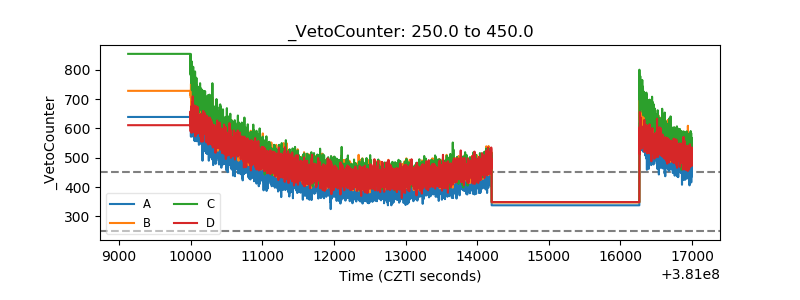 |