| Param | Original file | Final file |
|---|---|---|
| Filename | modeM0/AS1A11_059T09_9000004888_34250cztM0_level2.evt | modeM0/AS1A11_059T09_9000004888_34250cztM0_level2_quad_clean.evt |
| Size (bytes) | 444,009,600 | 90,316,800 |
| Size | 423.4 MB | 86.1 MB |
| Events in quadrant A | 2,297,340 | 616,333 |
| Events in quadrant B | 3,375,597 | 613,920 |
| Events in quadrant C | 3,092,872 | 605,467 |
| Events in quadrant D | 4,347,252 | 554,437 |
| Mode M0 | |||
|---|---|---|---|
| Quadrant | BADHDUFLAG | Total packets | Discarded packets |
| A | 0 | 9974 | 0 |
| B | 0 | 13186 | 0 |
| C | 0 | 12178 | 0 |
| D | 0 | 16413 | 0 |
| Mode SS | |||
|---|---|---|---|
| Quadrant | BADHDUFLAG | Total packets | Discarded packets |
| A | 0 | 100 | 0 |
| B | 0 | 100 | 0 |
| C | 0 | 100 | 0 |
| D | 0 | 100 | 0 |
| Mode M9 | |||
|---|---|---|---|
| Quadrant | BADHDUFLAG | Total packets | Discarded packets |
| A | 0 | 37 | 0 |
| B | 0 | 37 | 0 |
| C | 0 | 37 | 0 |
| D | 0 | 38 | 0 |
| Quadrant | Total seconds | Saturated seconds | Saturation percentage |
|---|---|---|---|
| A | 4914 | 3 | 0.061050% |
| B | 4914 | 332 | 6.756207% |
| C | 4914 | 191 | 3.886854% |
| D | 4914 | 447 | 9.096459% |
Noise dominated data is calculated using 1-second bins in cleaned event files. If a bin has >2000 counts, and if more than 50% of those come from <1% of pixels, then it is considered to be noise-dominated and hence unusable.
| Quadrant | # 1 sec bins | Bins with >0 counts | Bins with >2000 counts | High rate bins dominated by noise | Noise dominated (total time) | Noise dominated (detector-on time) | Marked lightcurve |
|---|---|---|---|---|---|---|---|
| A | 7037 | 4915 | 0 | 0 | 0.00% | 0.00% | 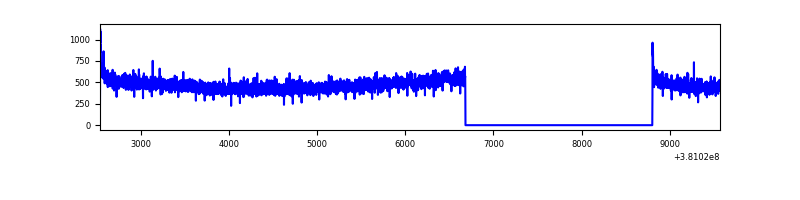 |
| B | 7037 | 4915 | 241 | 241 | 3.42% | 4.90% | 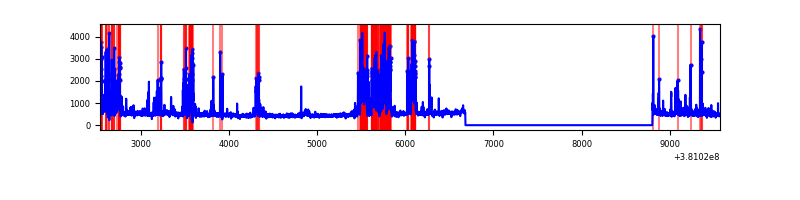 |
| C | 7037 | 4915 | 139 | 139 | 1.98% | 2.83% | 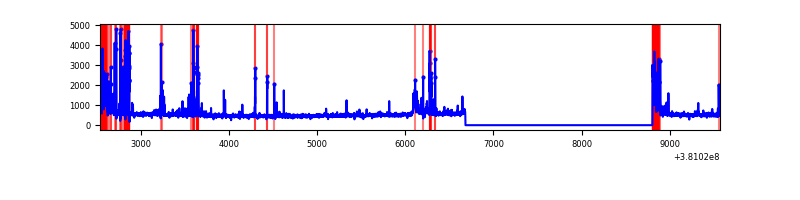 |
| D | 7037 | 4915 | 393 | 393 | 5.58% | 8.00% | 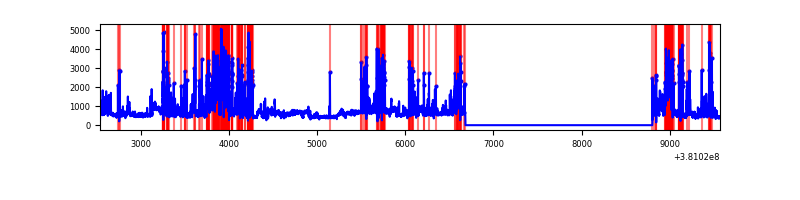 |
Top three noisy pixels from each quadrant. If the there are fewer than three noisy pixels in the level2.evt file, extra rows are filled as -1
| Pixel properties | Quadrant properties | ||||||
|---|---|---|---|---|---|---|---|
| Quadrant | DetID | PixID | Counts | Sigma | Mean | Median | Sigma |
| A | 15 | 47 | 29488 | 251.05 | 579 | 569 | 115.2 |
| A | 10 | 83 | 23076 | 195.38 | 579 | 569 | 115.2 |
| A | 13 | 254 | 8409 | 68.06 | 579 | 569 | 115.2 |
| B | 5 | 172 | 785844 | 7238.17 | 568 | 555 | 108.5 |
| B | 4 | 251 | 180092 | 1654.83 | 568 | 555 | 108.5 |
| B | 0 | 182 | 85184 | 780.04 | 568 | 555 | 108.5 |
| C | 0 | 10 | 318564 | 2462.97 | 556 | 562 | 129.1 |
| C | 0 | 207 | 210530 | 1626.23 | 556 | 562 | 129.1 |
| C | 15 | 214 | 210218 | 1623.81 | 556 | 562 | 129.1 |
| D | 7 | 80 | 1291103 | 9594.34 | 539 | 523 | 134.5 |
| D | 8 | 195 | 535374 | 3976.15 | 539 | 523 | 134.5 |
| D | 13 | 249 | 190012 | 1408.69 | 539 | 523 | 134.5 |
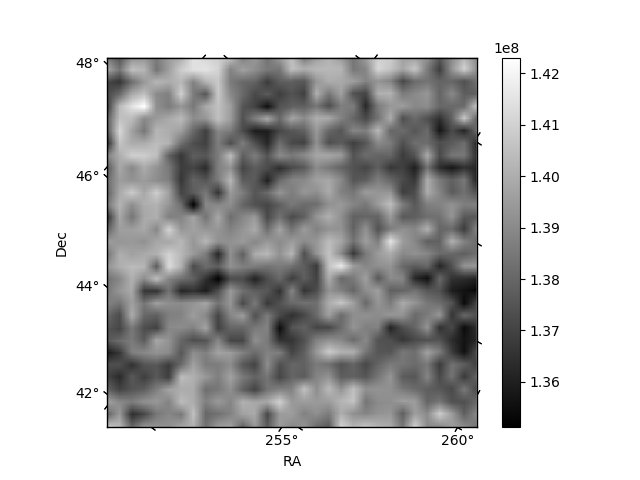
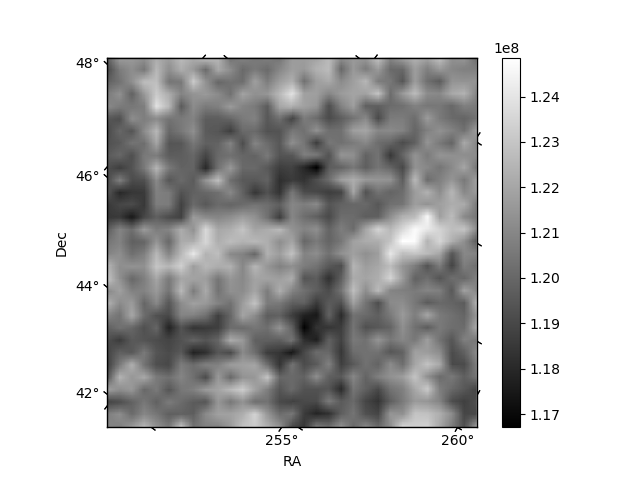
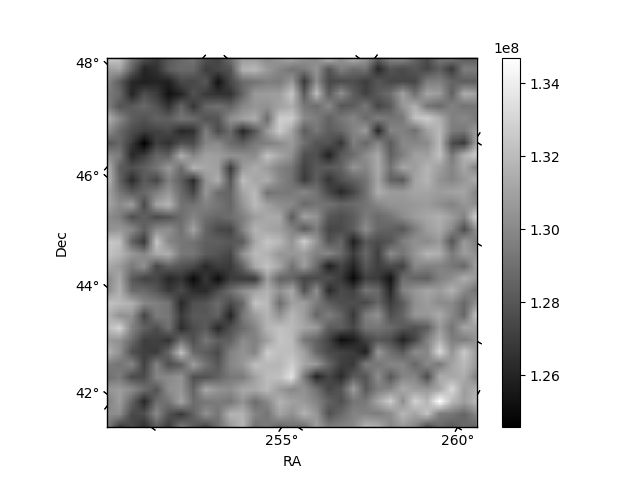
Histogram calculated using DETX and DETY for each event in the final _common_clean file
| Quadrant A | 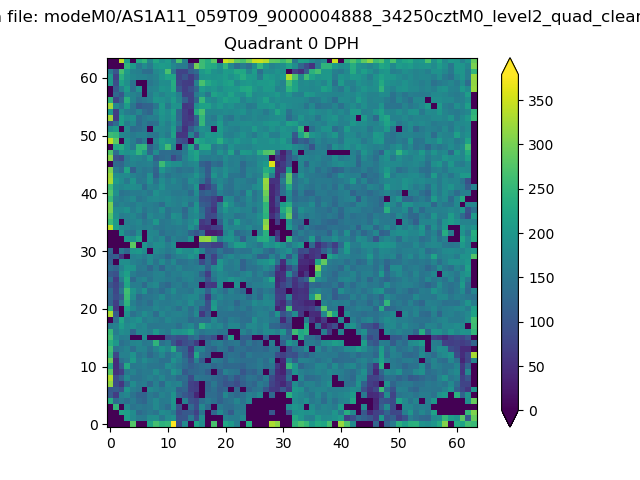 |
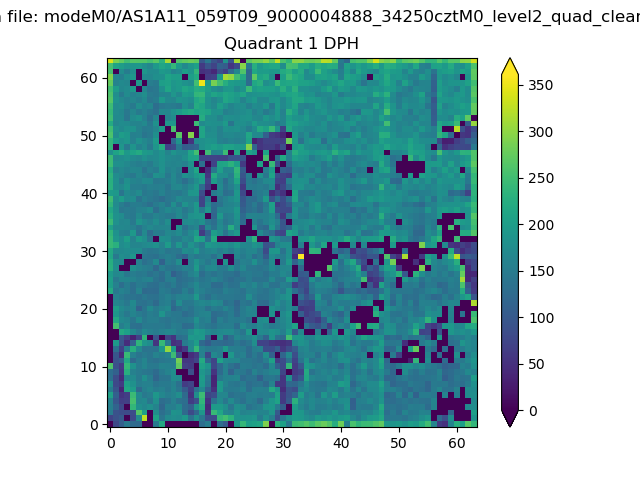 |
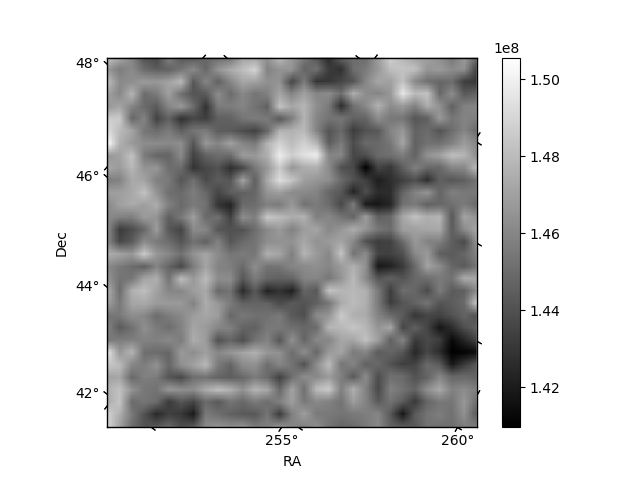
Quadrant B |
|---|---|---|---|
| Quadrant D | 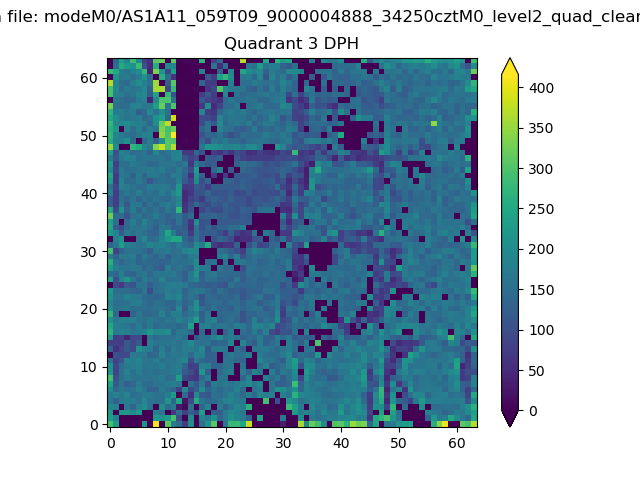 |
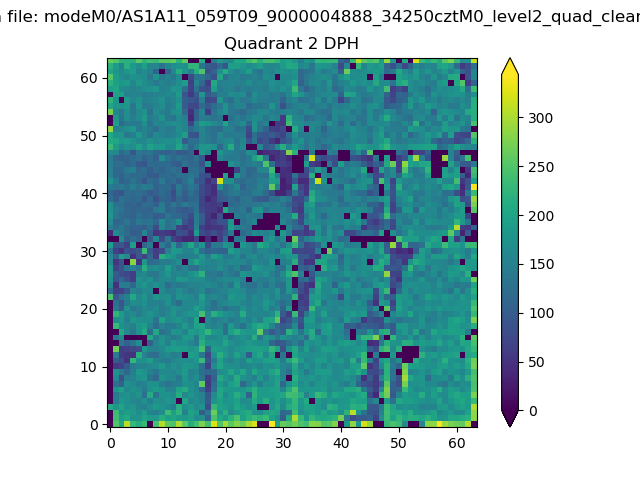 |
Quadrant C |
| Plot type | Count rate plots | Images |
|---|---|---|
| Comparison with Poisson distribution Blue bars denote a histogram of data divided into 1 sec bins. Red curve is a Poisson curve with rate = median count rate of data. |
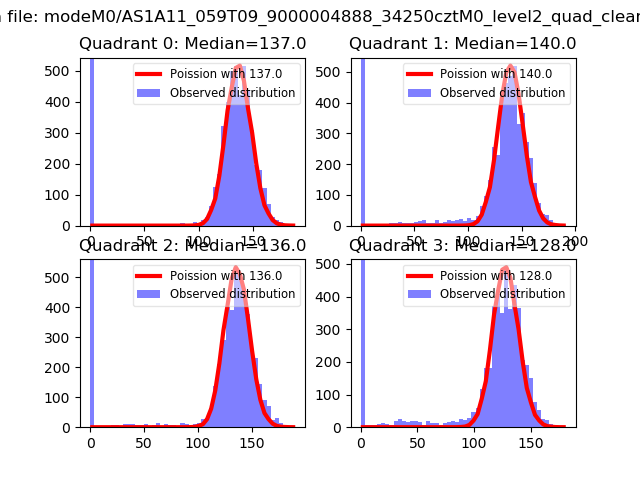 |
 |
| Quadrant-wise count rates Data is divided into 100 sec bins |
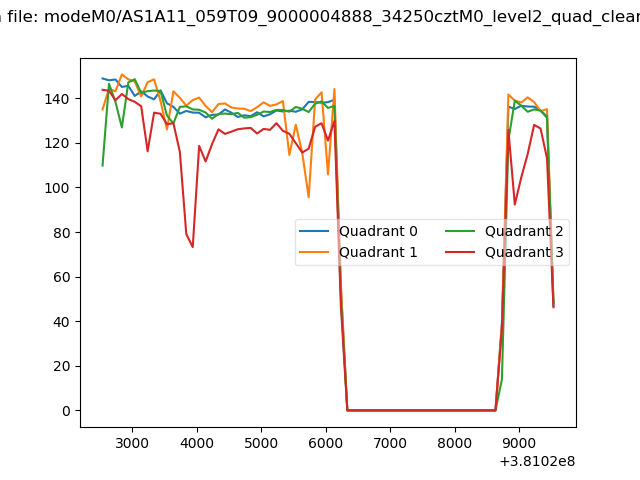 |
|
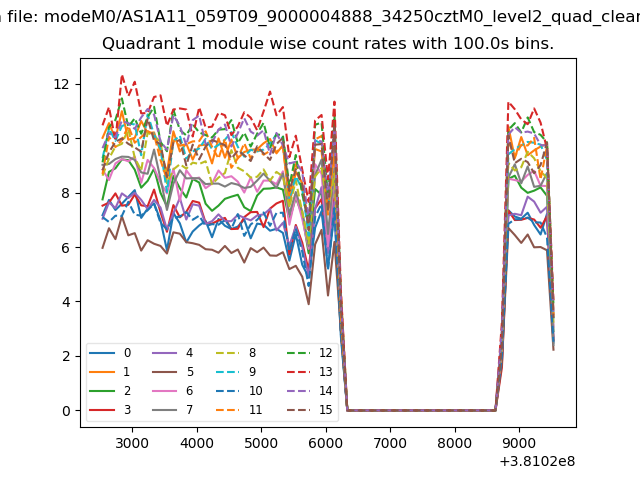
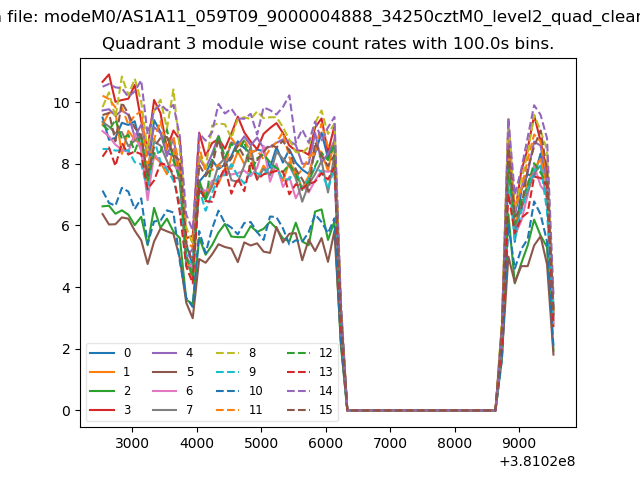
| Module-wise count rates for Quadrant A Data is divided into 100 sec bins |
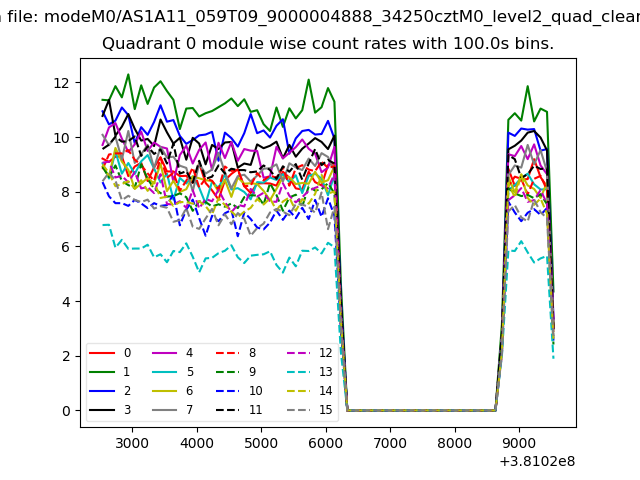 |
 |
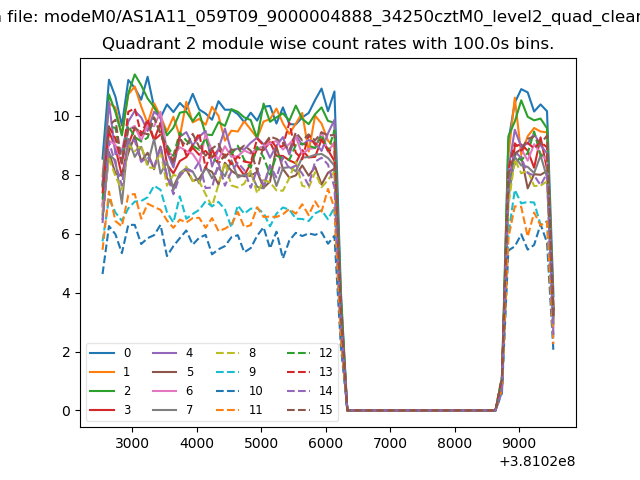
| Module-wise count rates for Quadrant B Data is divided into 100 sec bins |
 |
 |
| Module-wise count rates for Quadrant C Data is divided into 100 sec bins |
 |
 |
| Module-wise count rates for Quadrant D Data is divided into 100 sec bins |
 |
 |
| Parameter | Plot |
|---|---|
| CZT HV Monitor | 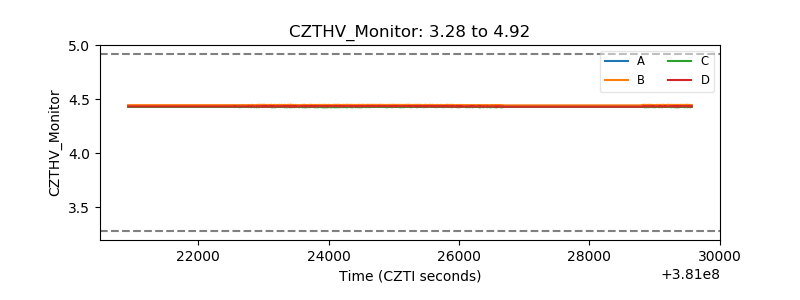 |
| D_VDD | 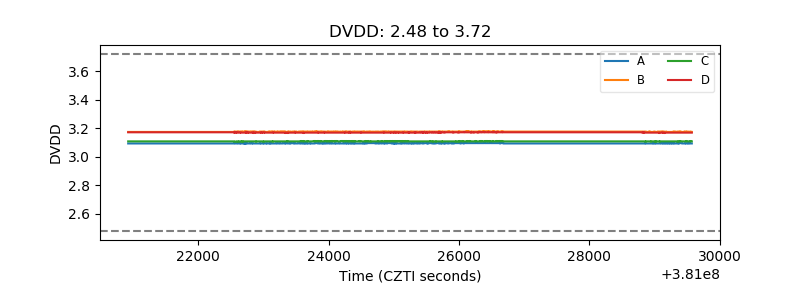 |
| Temperature 1 | 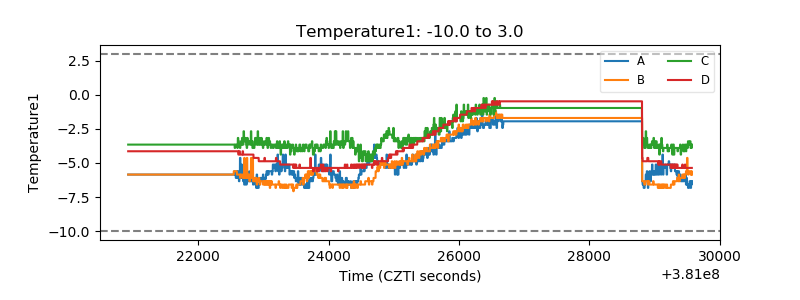 |
| Veto HV Monitor | 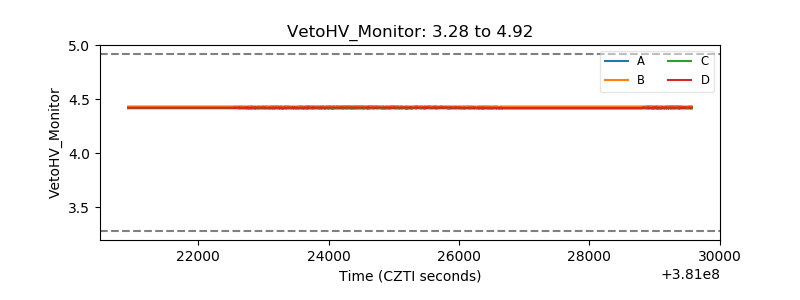 |
| Veto LLD | 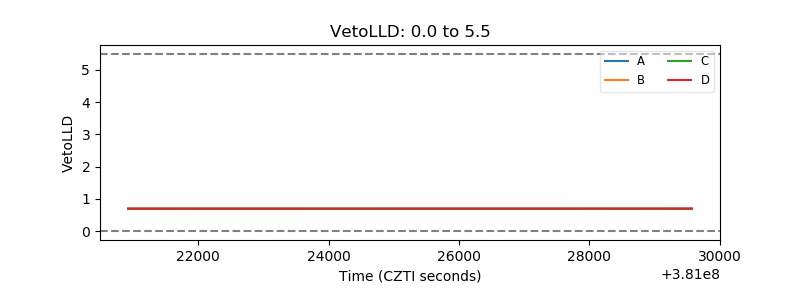 |
| Alpha Counter | 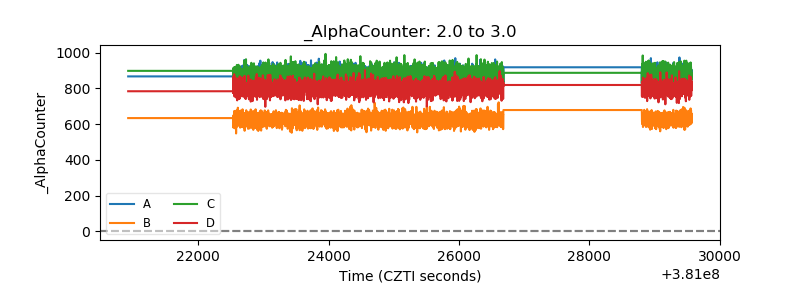 |
| _CPM_Rate | 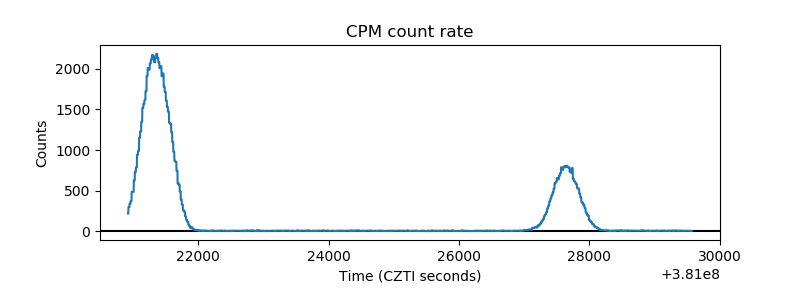 |
| CZT Counter | 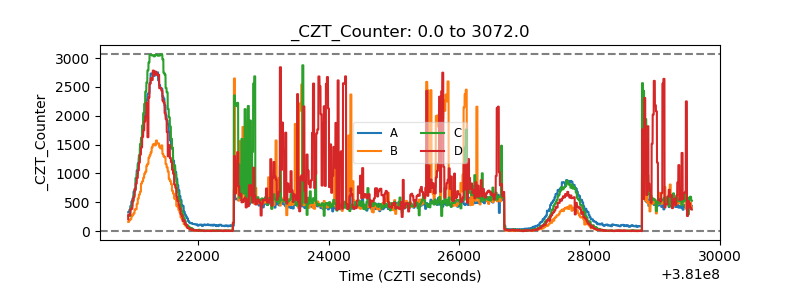 |
| +2.5 Volts monitor |  |
| +5 Volts monitor |  |
| _ROLL_ROT | 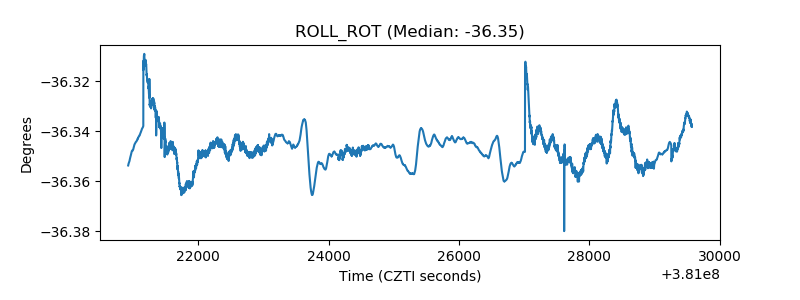 |
| _Roll_DEC | 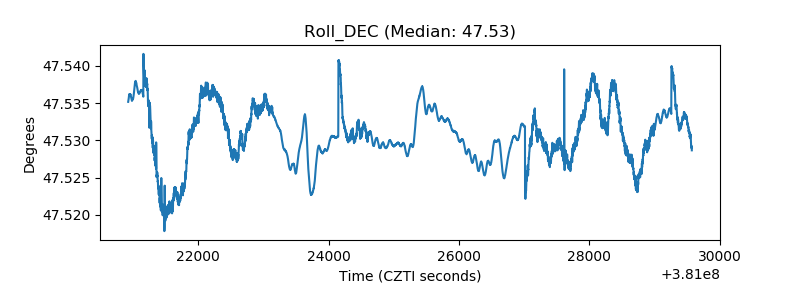 |
| _Roll_RA |  |
| Veto Counter | 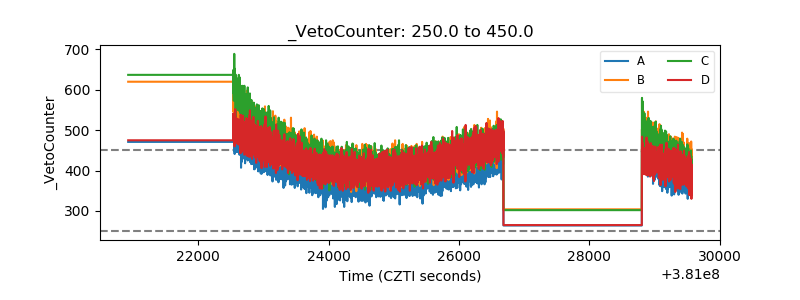 |