| Param | Original file | Final file |
|---|---|---|
| Filename | modeM0/AS1A11_059T09_9000004888_34254cztM0_level2.evt | modeM0/AS1A11_059T09_9000004888_34254cztM0_level2_quad_clean.evt |
| Size (bytes) | 539,913,600 | 76,279,680 |
| Size | 514.9 MB | 72.7 MB |
| Events in quadrant A | 2,701,211 | 487,186 |
| Events in quadrant B | 3,287,010 | 492,937 |
| Events in quadrant C | 4,248,201 | 465,956 |
| Events in quadrant D | 5,711,499 | 447,536 |
| Mode M0 | |||
|---|---|---|---|
| Quadrant | BADHDUFLAG | Total packets | Discarded packets |
| A | 0 | 12020 | 0 |
| B | 0 | 13635 | 0 |
| C | 0 | 16269 | 0 |
| D | 0 | 21077 | 0 |
| Mode SS | |||
|---|---|---|---|
| Quadrant | BADHDUFLAG | Total packets | Discarded packets |
| A | 0 | 122 | 0 |
| B | 0 | 122 | 0 |
| C | 0 | 122 | 0 |
| D | 0 | 122 | 0 |
| Mode M9 | |||
|---|---|---|---|
| Quadrant | BADHDUFLAG | Total packets | Discarded packets |
| A | 0 | 15 | 0 |
| B | 0 | 15 | 0 |
| C | 0 | 15 | 0 |
| D | 0 | 16 | 0 |
| Quadrant | Total seconds | Saturated seconds | Saturation percentage |
|---|---|---|---|
| A | 5950 | 8 | 0.134454% |
| B | 5950 | 122 | 2.050420% |
| C | 5950 | 345 | 5.798319% |
| D | 5950 | 414 | 6.957983% |
Noise dominated data is calculated using 1-second bins in cleaned event files. If a bin has >2000 counts, and if more than 50% of those come from <1% of pixels, then it is considered to be noise-dominated and hence unusable.
| Quadrant | # 1 sec bins | Bins with >0 counts | Bins with >2000 counts | High rate bins dominated by noise | Noise dominated (total time) | Noise dominated (detector-on time) | Marked lightcurve |
|---|---|---|---|---|---|---|---|
| A | 7262 | 5951 | 2 | 2 | 0.03% | 0.03% | 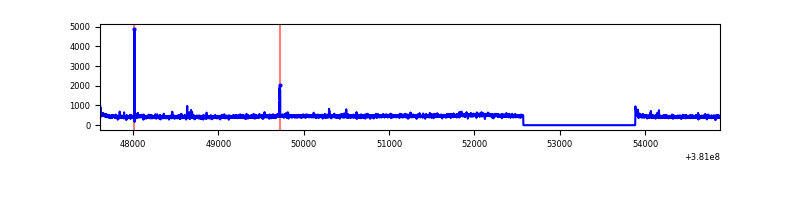 |
| B | 7262 | 5951 | 85 | 85 | 1.17% | 1.43% | 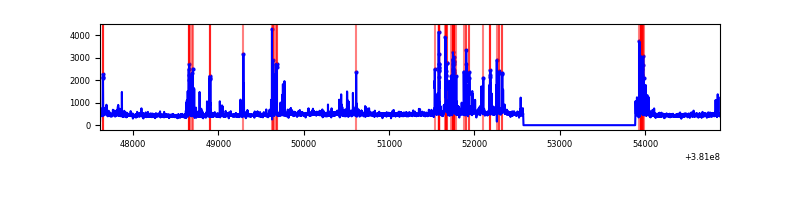 |
| C | 7262 | 5951 | 304 | 304 | 4.19% | 5.11% | 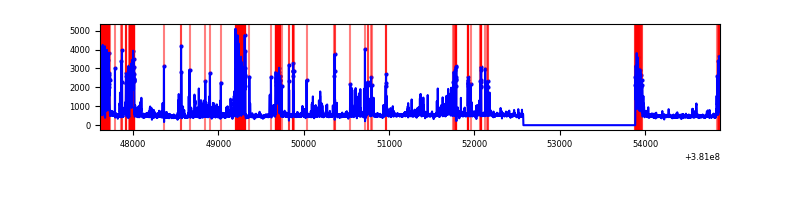 |
| D | 7262 | 5951 | 401 | 401 | 5.52% | 6.74% | 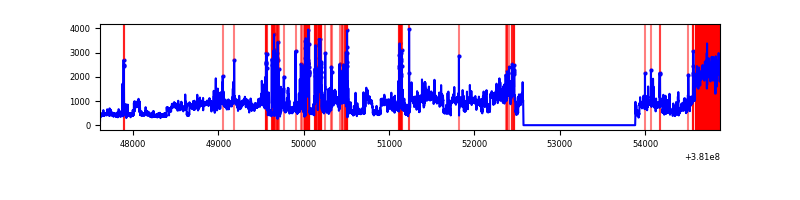 |
Top three noisy pixels from each quadrant. If the there are fewer than three noisy pixels in the level2.evt file, extra rows are filled as -1
| Pixel properties | Quadrant properties | ||||||
|---|---|---|---|---|---|---|---|
| Quadrant | DetID | PixID | Counts | Sigma | Mean | Median | Sigma |
| A | 10 | 83 | 24610 | 172.79 | 681 | 666 | 138.6 |
| A | 9 | 143 | 24230 | 170.05 | 681 | 666 | 138.6 |
| A | 13 | 6 | 19675 | 137.18 | 681 | 666 | 138.6 |
| B | 5 | 172 | 441850 | 3386.26 | 674 | 657 | 130.3 |
| B | 0 | 189 | 65577 | 498.28 | 674 | 657 | 130.3 |
| B | 15 | 222 | 36514 | 275.21 | 674 | 657 | 130.3 |
| C | 0 | 207 | 831017 | 5520.94 | 645 | 649 | 150.4 |
| C | 0 | 10 | 305580 | 2027.42 | 645 | 649 | 150.4 |
| C | 14 | 254 | 288159 | 1911.59 | 645 | 649 | 150.4 |
| D | 8 | 195 | 1781509 | 11180.64 | 645 | 626 | 159.3 |
| D | 7 | 223 | 595534 | 3734.92 | 645 | 626 | 159.3 |
| D | 7 | 80 | 499801 | 3133.89 | 645 | 626 | 159.3 |
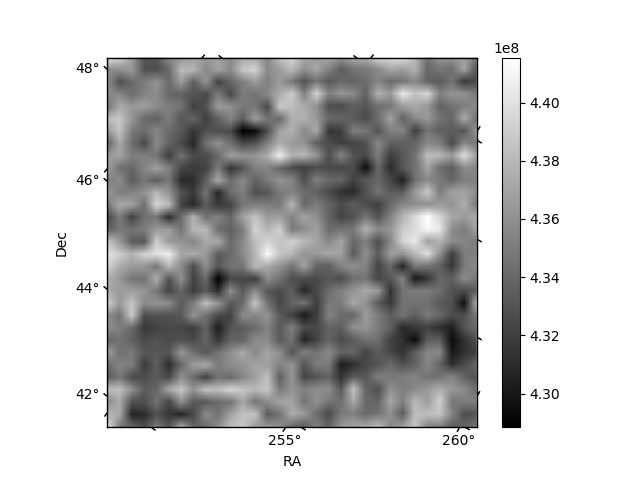
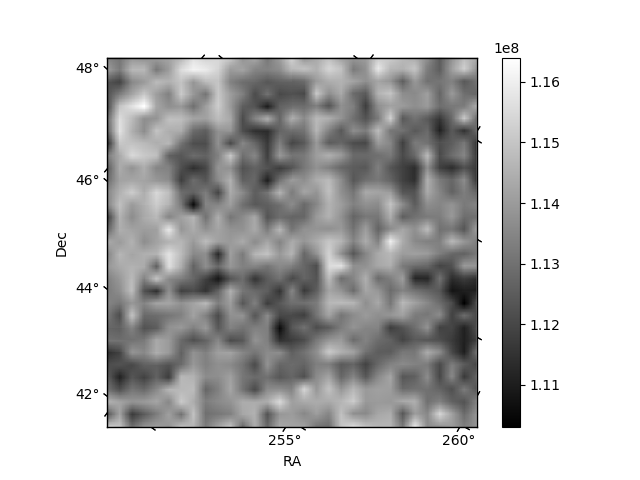
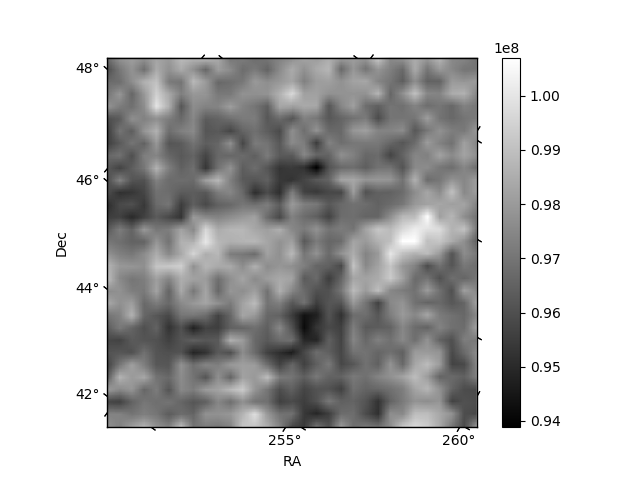
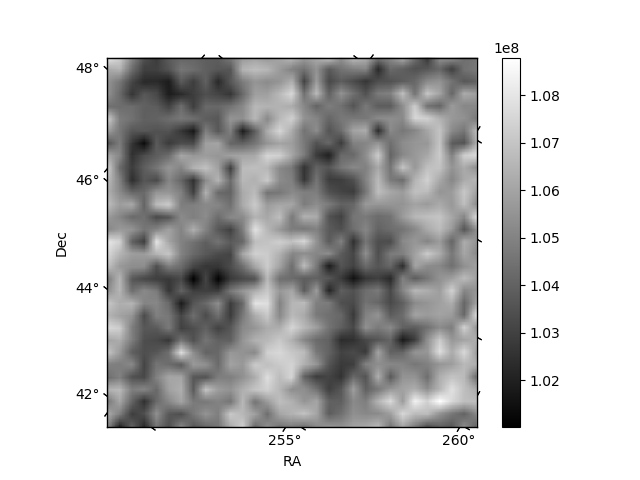
Histogram calculated using DETX and DETY for each event in the final _common_clean file
| Quadrant A | 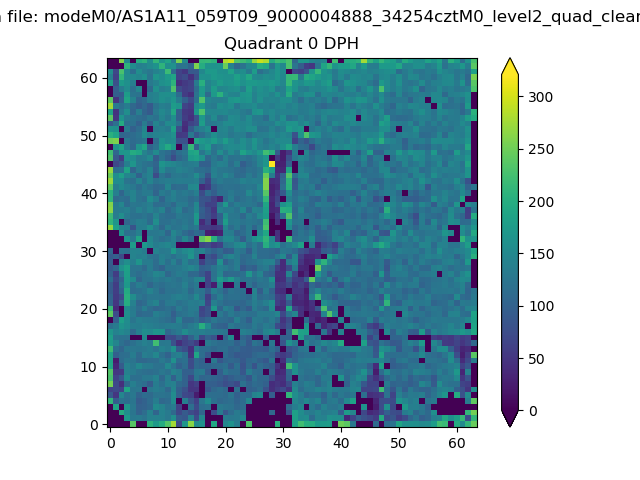 |
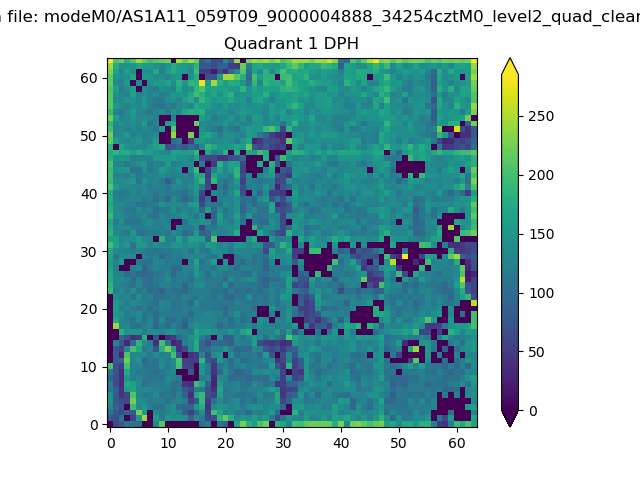 |
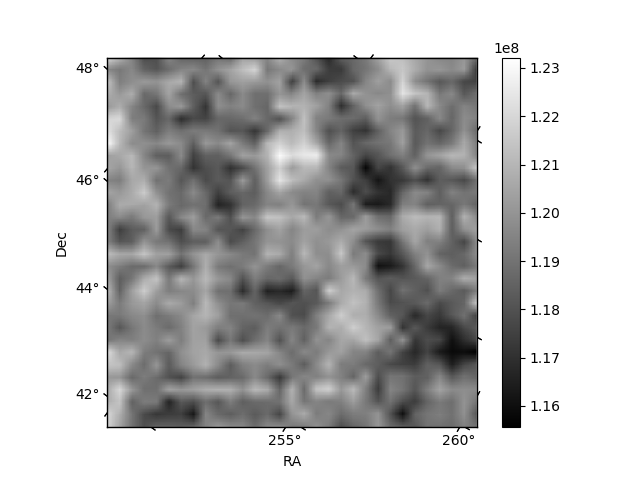
Quadrant B |
|---|---|---|---|
| Quadrant D | 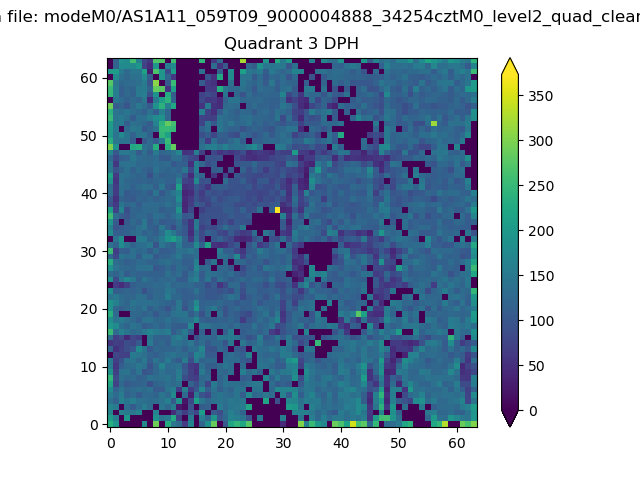 |
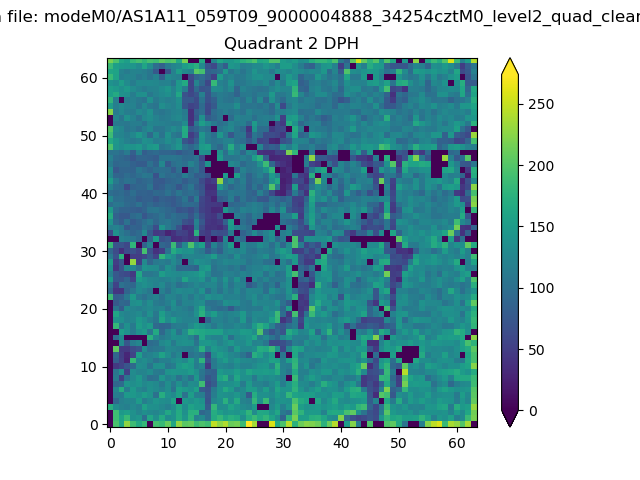 |
Quadrant C |
| Plot type | Count rate plots | Images |
|---|---|---|
| Comparison with Poisson distribution Blue bars denote a histogram of data divided into 1 sec bins. Red curve is a Poisson curve with rate = median count rate of data. |
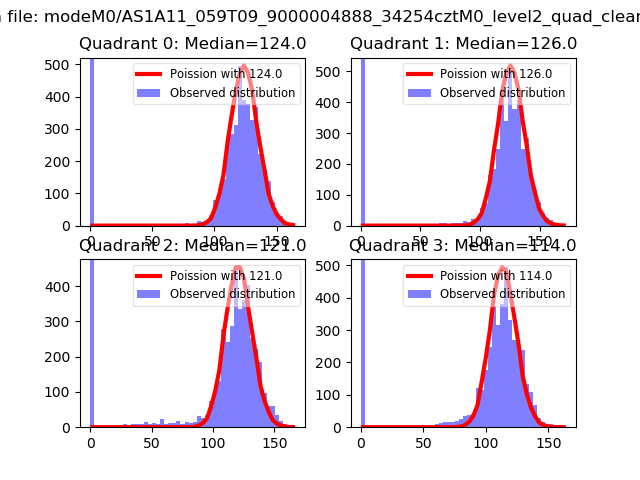 |
 |
| Quadrant-wise count rates Data is divided into 100 sec bins |
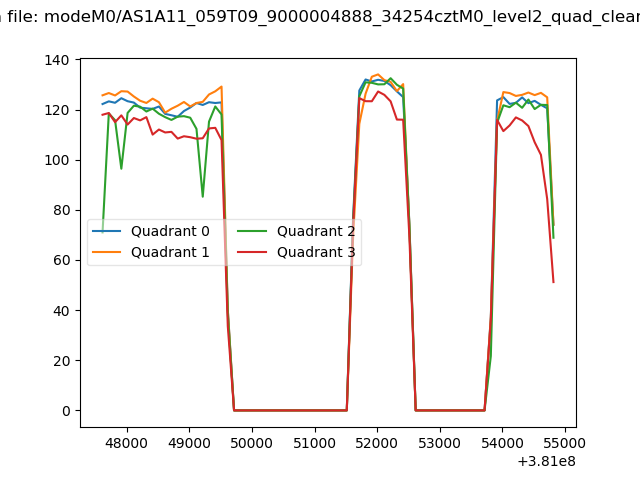 |
|
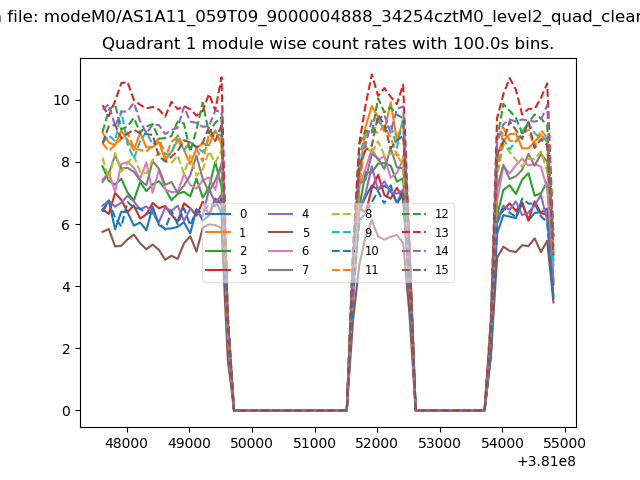
| Module-wise count rates for Quadrant A Data is divided into 100 sec bins |
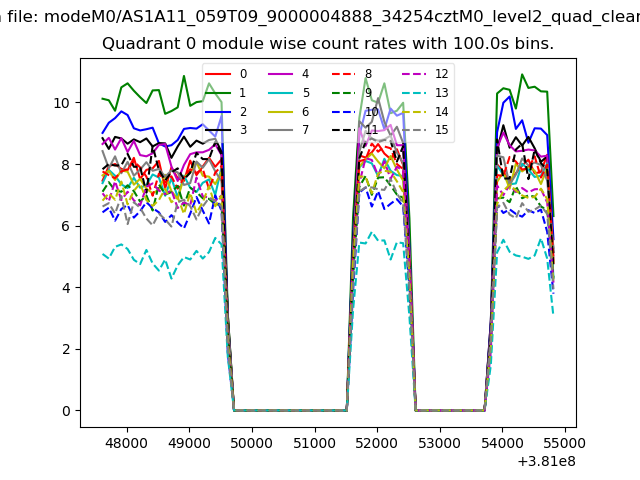 |
 |
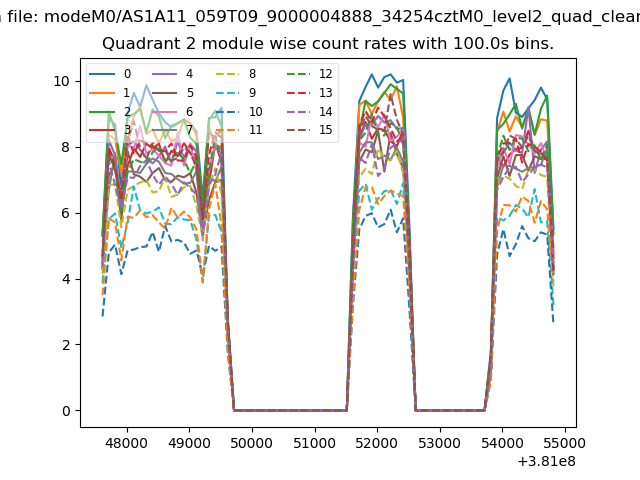
| Module-wise count rates for Quadrant B Data is divided into 100 sec bins |
 |
 |
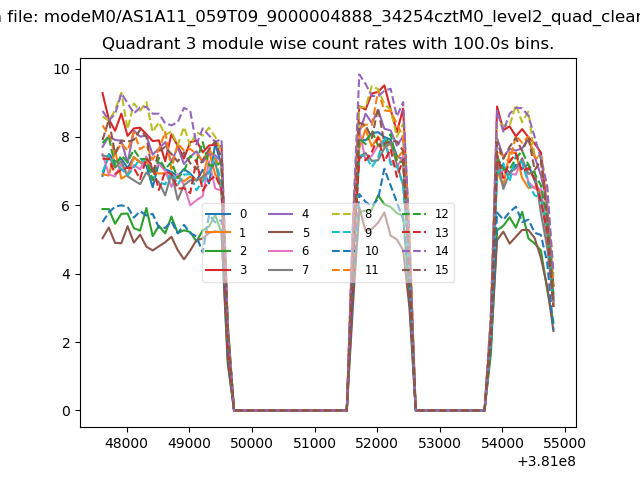
| Module-wise count rates for Quadrant C Data is divided into 100 sec bins |
 |
 |
| Module-wise count rates for Quadrant D Data is divided into 100 sec bins |
 |
 |
| Parameter | Plot |
|---|---|
| CZT HV Monitor | 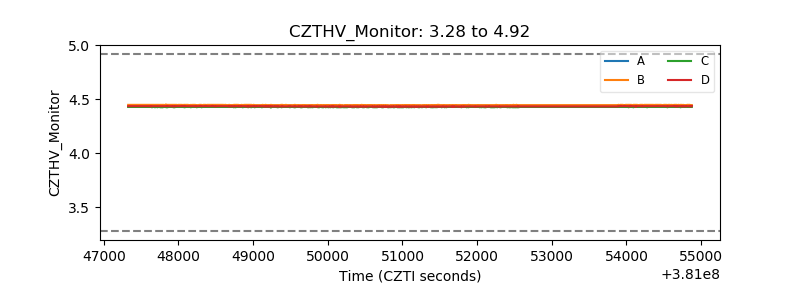 |
| D_VDD | 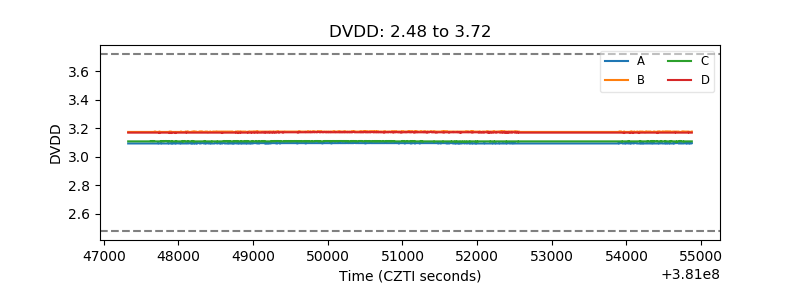 |
| Temperature 1 | 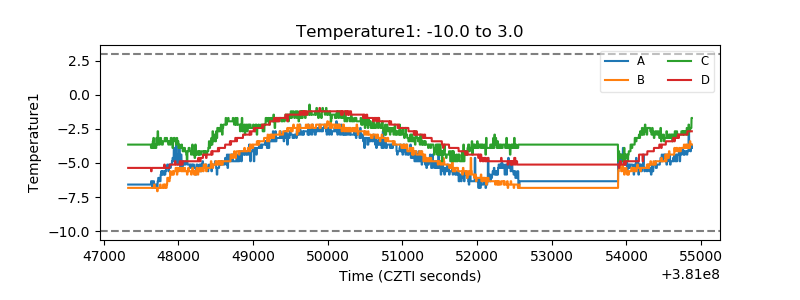 |
| Veto HV Monitor | 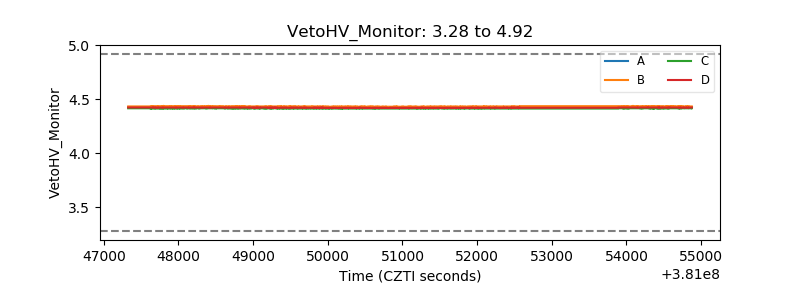 |
| Veto LLD | 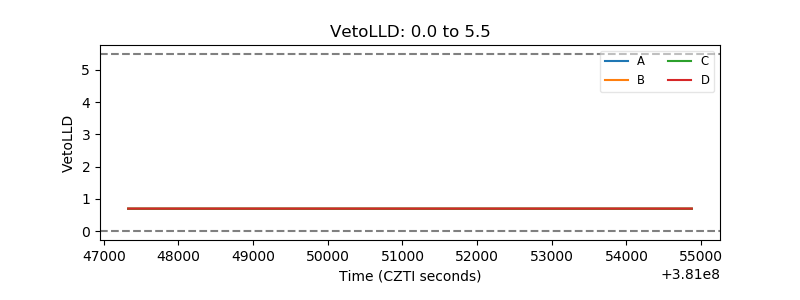 |
| Alpha Counter | 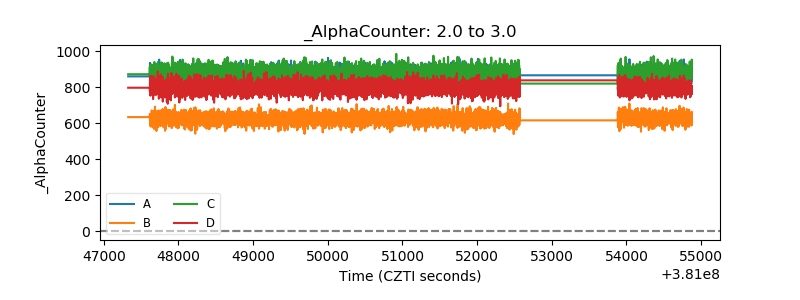 |
| _CPM_Rate | 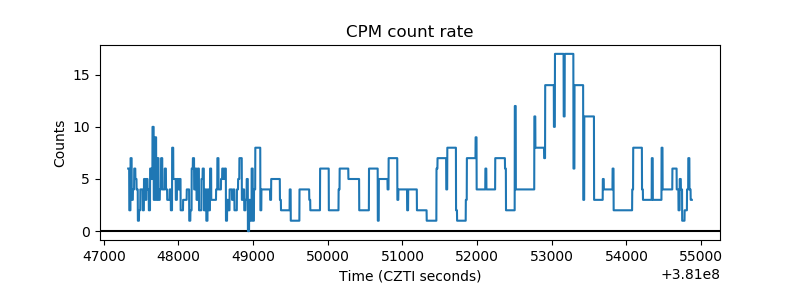 |
| CZT Counter | 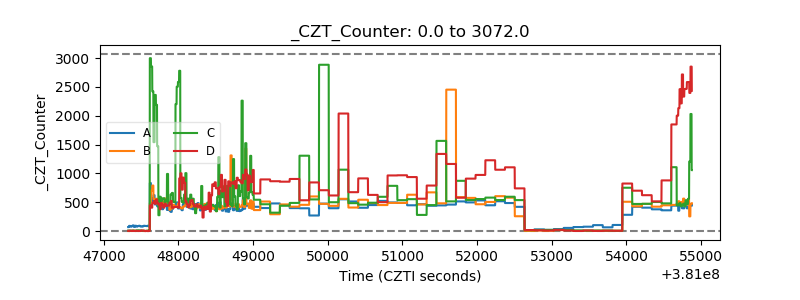 |
| +2.5 Volts monitor | 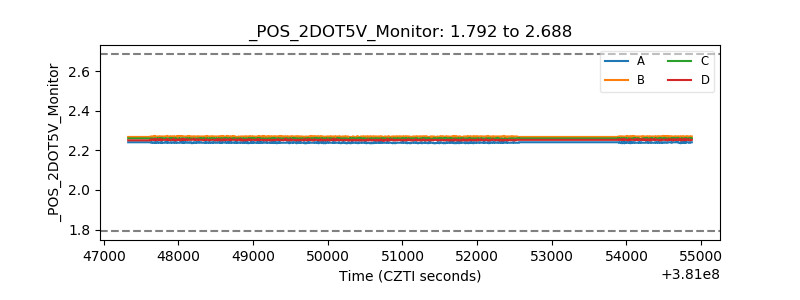 |
| +5 Volts monitor | 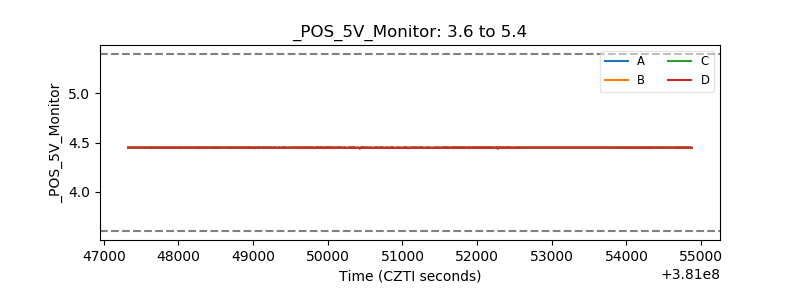 |
| _ROLL_ROT | 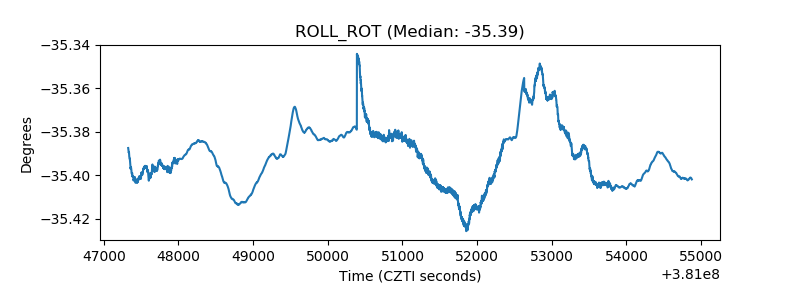 |
| _Roll_DEC |  |
| _Roll_RA | 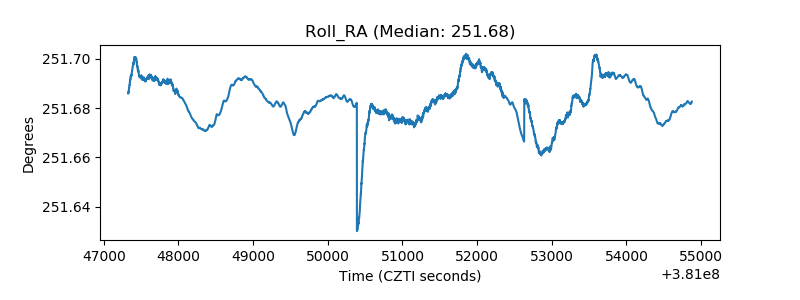 |
| Veto Counter | 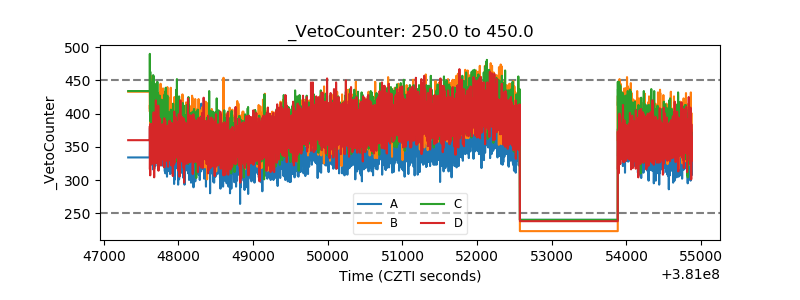 |