| Param | Original file | Final file |
|---|---|---|
| Filename | modeM0/AS1A11_059T09_9000004888_34264cztM0_level2.evt | modeM0/AS1A11_059T09_9000004888_34264cztM0_level2_quad_clean.evt |
| Size (bytes) | 458,176,320 | 96,036,480 |
| Size | 437.0 MB | 91.6 MB |
| Events in quadrant A | 2,391,223 | 651,536 |
| Events in quadrant B | 3,439,176 | 651,036 |
| Events in quadrant C | 3,738,760 | 652,493 |
| Events in quadrant D | 3,974,839 | 610,053 |
| Mode M0 | |||
|---|---|---|---|
| Quadrant | BADHDUFLAG | Total packets | Discarded packets |
| A | 0 | 10166 | 0 |
| B | 0 | 13430 | 0 |
| C | 0 | 14251 | 0 |
| D | 0 | 15126 | 0 |
| Mode SS | |||
|---|---|---|---|
| Quadrant | BADHDUFLAG | Total packets | Discarded packets |
| A | 0 | 100 | 0 |
| B | 0 | 100 | 0 |
| C | 0 | 100 | 0 |
| D | 0 | 100 | 0 |
| Mode M9 | |||
|---|---|---|---|
| Quadrant | BADHDUFLAG | Total packets | Discarded packets |
| A | 0 | 30 | 0 |
| B | 0 | 30 | 0 |
| C | 0 | 30 | 0 |
| D | 0 | 31 | 0 |
| Quadrant | Total seconds | Saturated seconds | Saturation percentage |
|---|---|---|---|
| A | 4893 | 11 | 0.224811% |
| B | 4893 | 352 | 7.193951% |
| C | 4893 | 157 | 3.208665% |
| D | 4893 | 235 | 4.802779% |
Noise dominated data is calculated using 1-second bins in cleaned event files. If a bin has >2000 counts, and if more than 50% of those come from <1% of pixels, then it is considered to be noise-dominated and hence unusable.
| Quadrant | # 1 sec bins | Bins with >0 counts | Bins with >2000 counts | High rate bins dominated by noise | Noise dominated (total time) | Noise dominated (detector-on time) | Marked lightcurve |
|---|---|---|---|---|---|---|---|
| A | 7045 | 4894 | 4 | 4 | 0.06% | 0.08% | 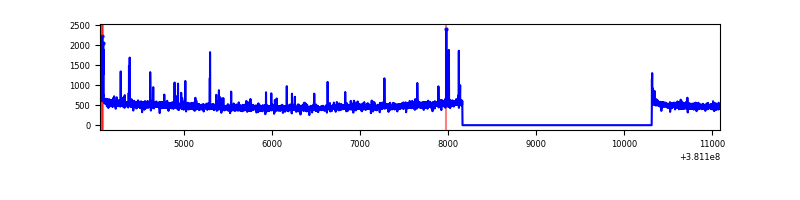 |
| B | 7045 | 4894 | 254 | 254 | 3.61% | 5.19% | 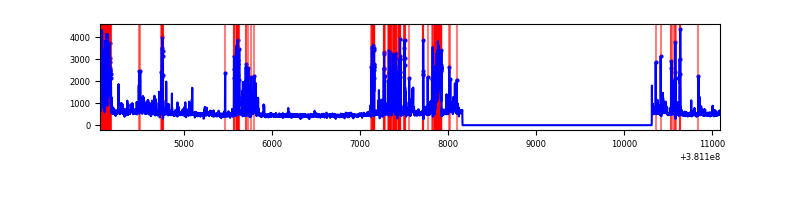 |
| C | 7045 | 4894 | 169 | 169 | 2.40% | 3.45% | 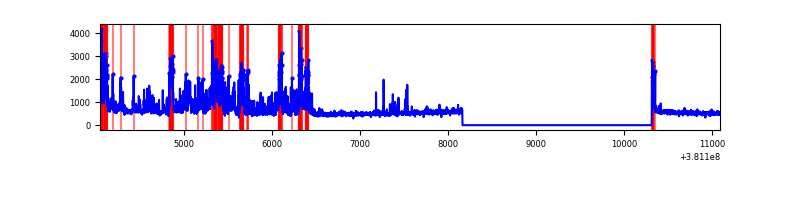 |
| D | 7045 | 4894 | 188 | 188 | 2.67% | 3.84% | 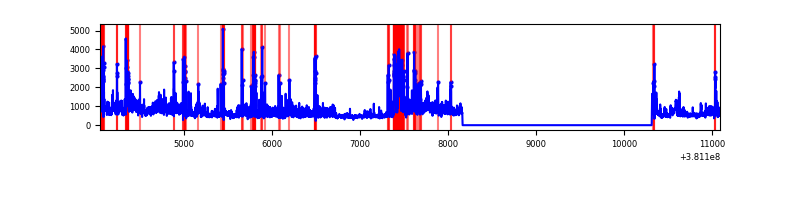 |
Top three noisy pixels from each quadrant. If the there are fewer than three noisy pixels in the level2.evt file, extra rows are filled as -1
| Pixel properties | Quadrant properties | ||||||
|---|---|---|---|---|---|---|---|
| Quadrant | DetID | PixID | Counts | Sigma | Mean | Median | Sigma |
| A | 15 | 169 | 52951 | 442.67 | 592 | 582 | 118.3 |
| A | 10 | 83 | 24513 | 202.29 | 592 | 582 | 118.3 |
| A | 9 | 143 | 15844 | 129.01 | 592 | 582 | 118.3 |
| B | 5 | 172 | 945361 | 8693.43 | 575 | 561 | 108.7 |
| B | 0 | 182 | 113061 | 1035.15 | 575 | 561 | 108.7 |
| B | 4 | 232 | 31459 | 284.3 | 575 | 561 | 108.7 |
| C | 0 | 239 | 925097 | 6898.1 | 582 | 587 | 134.0 |
| C | 15 | 214 | 214457 | 1595.76 | 582 | 587 | 134.0 |
| C | 14 | 254 | 174156 | 1295.06 | 582 | 587 | 134.0 |
| D | 8 | 195 | 859015 | 5644.5 | 562 | 551 | 152.1 |
| D | 10 | 199 | 300513 | 1972.28 | 562 | 551 | 152.1 |
| D | 14 | 52 | 210245 | 1378.76 | 562 | 551 | 152.1 |
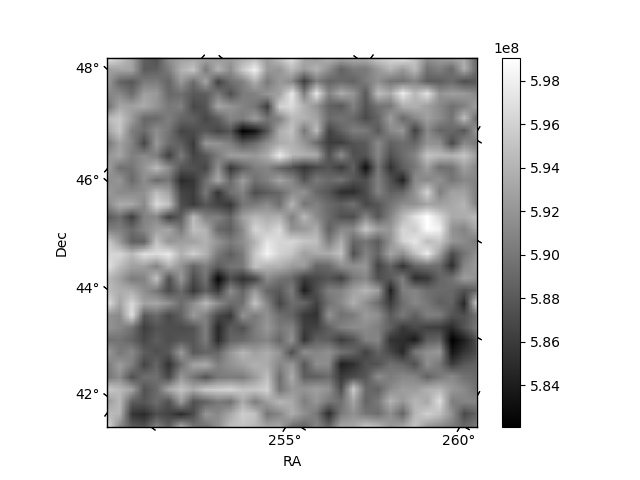
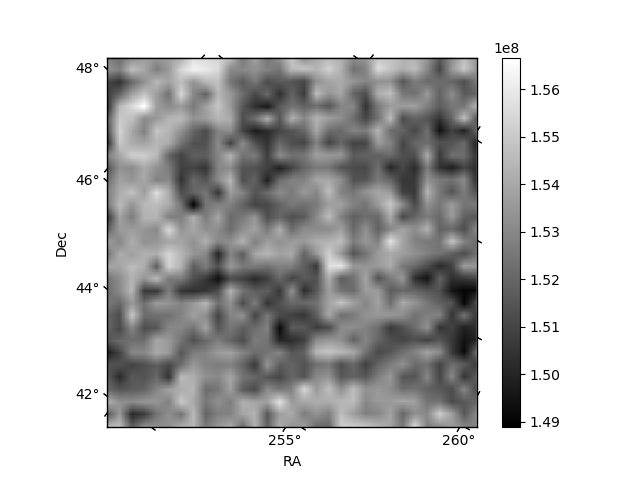
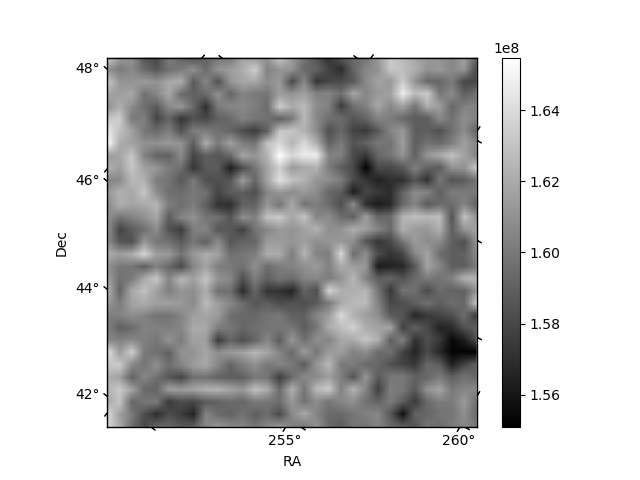
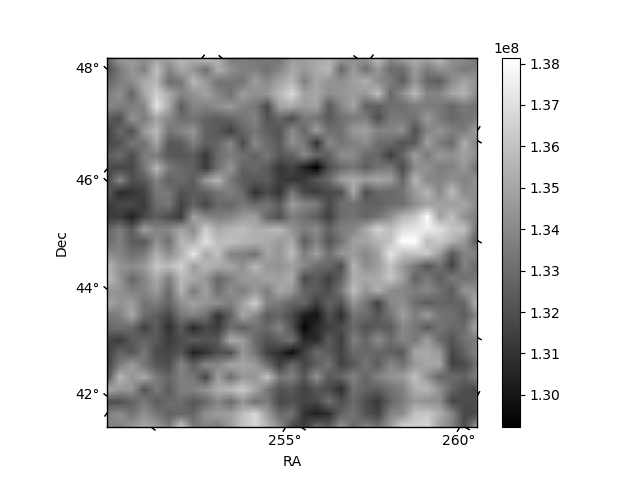
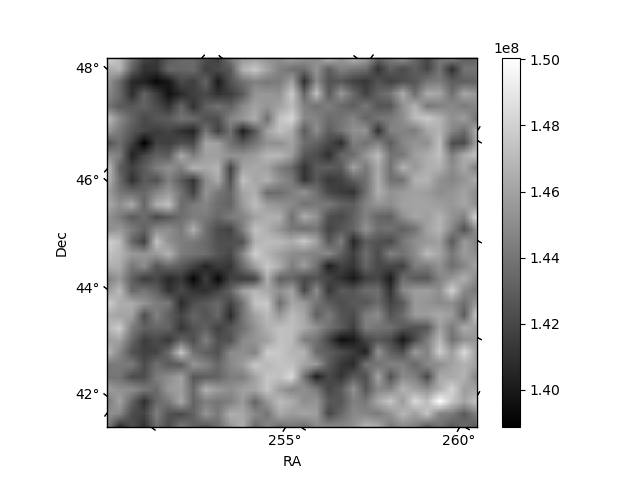
Histogram calculated using DETX and DETY for each event in the final _common_clean file
| Quadrant A | 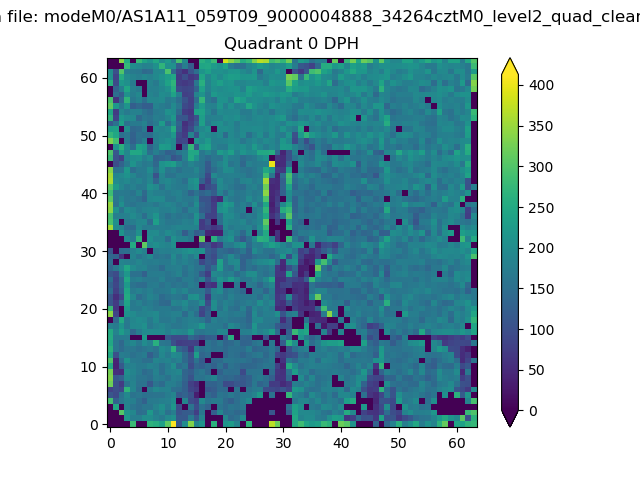 |
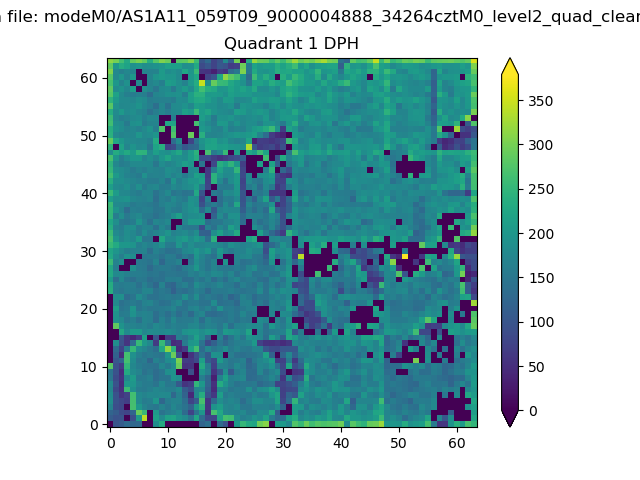 |
Quadrant B |
|---|---|---|---|
| Quadrant D | 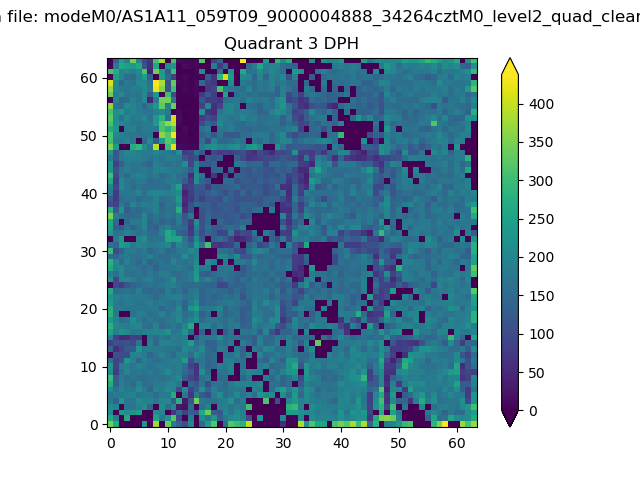 |
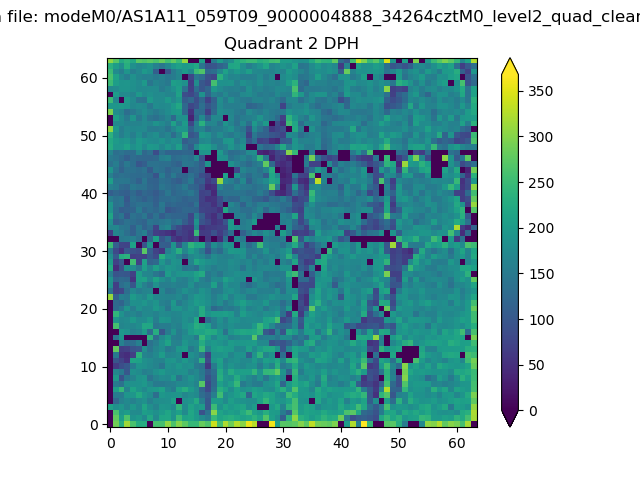 |
Quadrant C |
| Plot type | Count rate plots | Images |
|---|---|---|
| Comparison with Poisson distribution Blue bars denote a histogram of data divided into 1 sec bins. Red curve is a Poisson curve with rate = median count rate of data. |
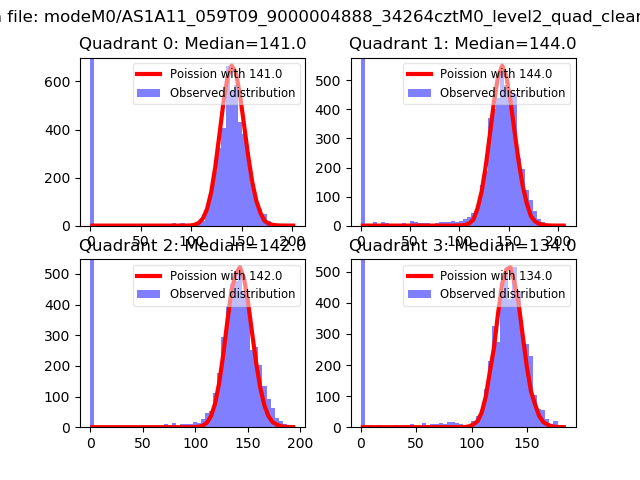 |
 |
| Quadrant-wise count rates Data is divided into 100 sec bins |
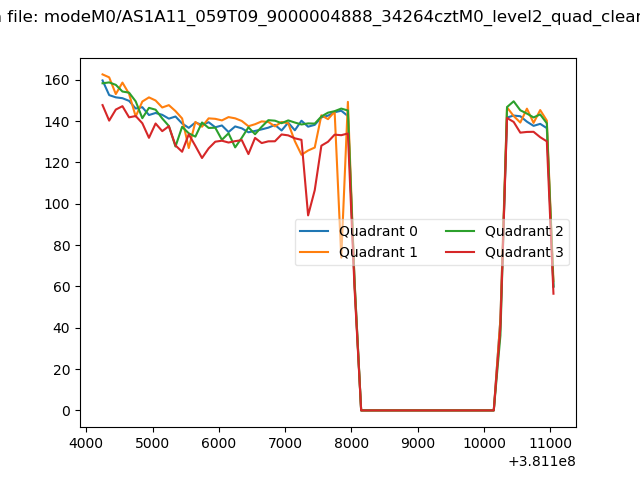 |
|
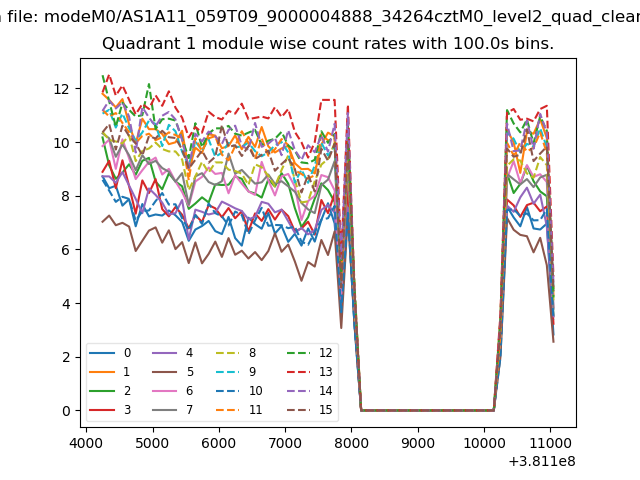
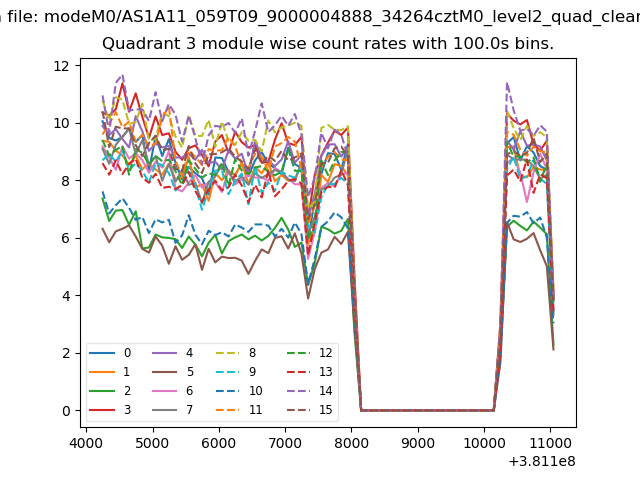
| Module-wise count rates for Quadrant A Data is divided into 100 sec bins |
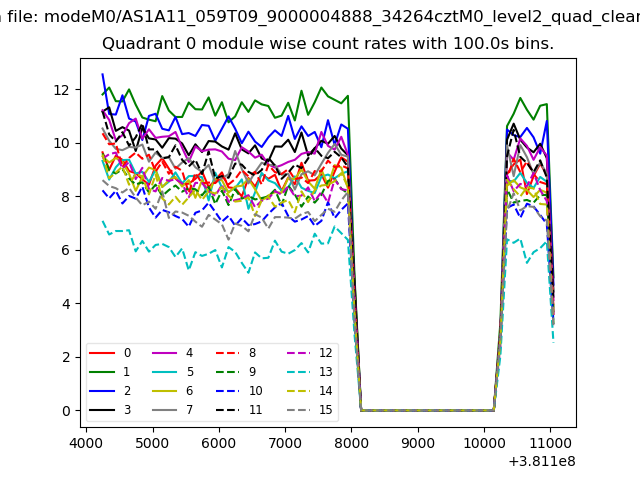 |
 |
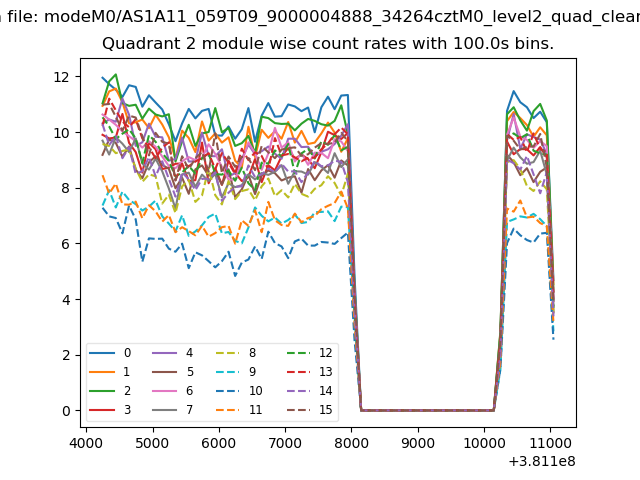
| Module-wise count rates for Quadrant B Data is divided into 100 sec bins |
 |
 |
| Module-wise count rates for Quadrant C Data is divided into 100 sec bins |
 |
 |
| Module-wise count rates for Quadrant D Data is divided into 100 sec bins |
 |
 |
| Parameter | Plot |
|---|---|
| CZT HV Monitor | 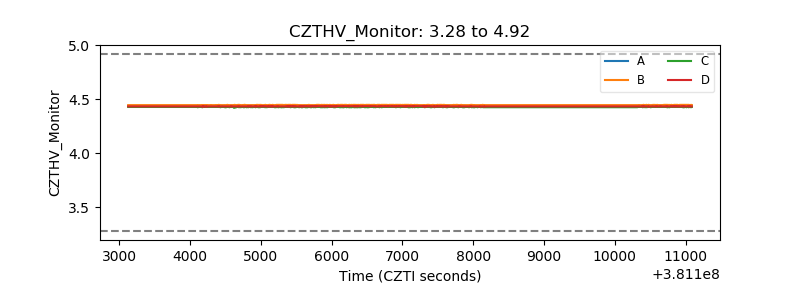 |
| D_VDD | 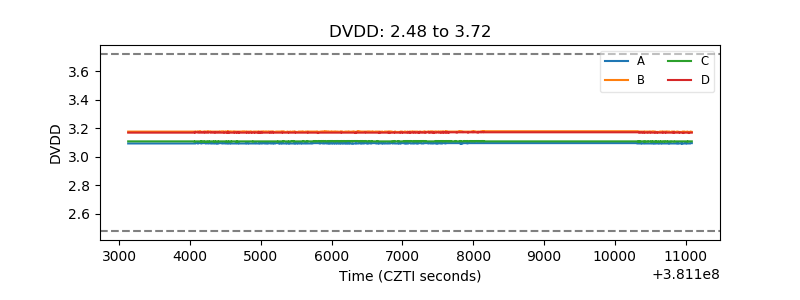 |
| Temperature 1 | 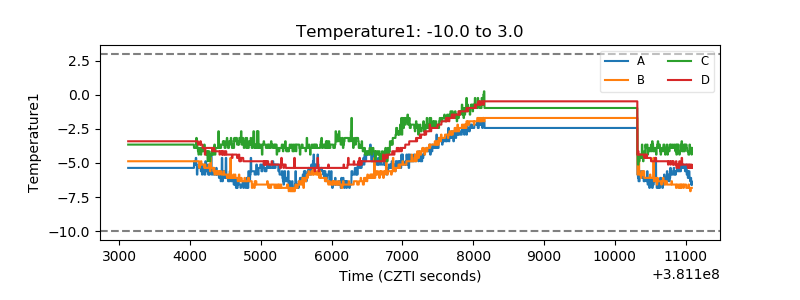 |
| Veto HV Monitor |  |
| Veto LLD | 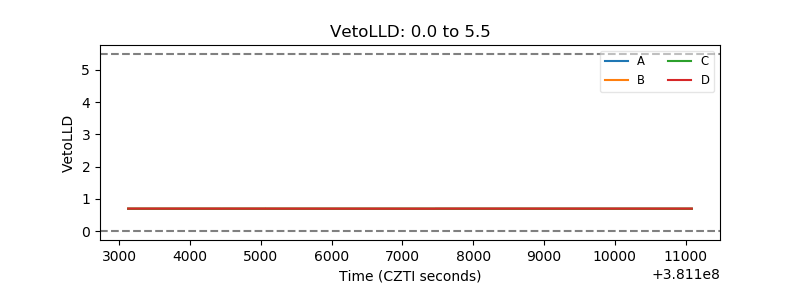 |
| Alpha Counter | 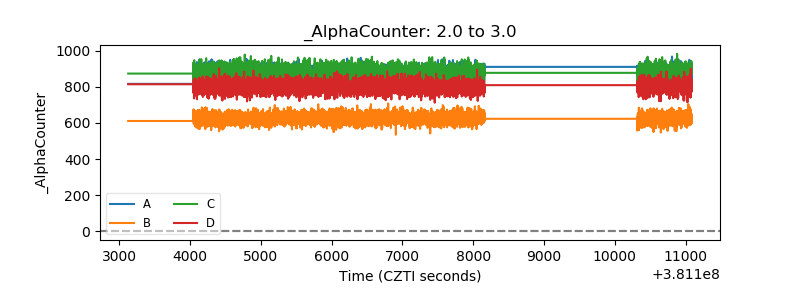 |
| _CPM_Rate | 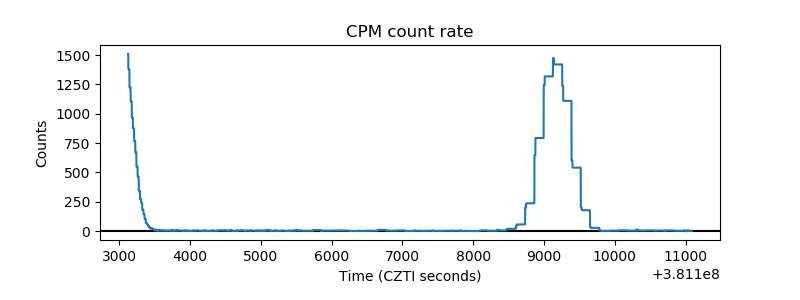 |
| CZT Counter | 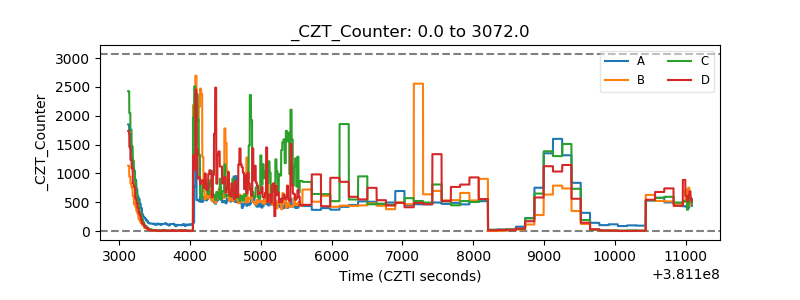 |
| +2.5 Volts monitor |  |
| +5 Volts monitor |  |
| _ROLL_ROT | 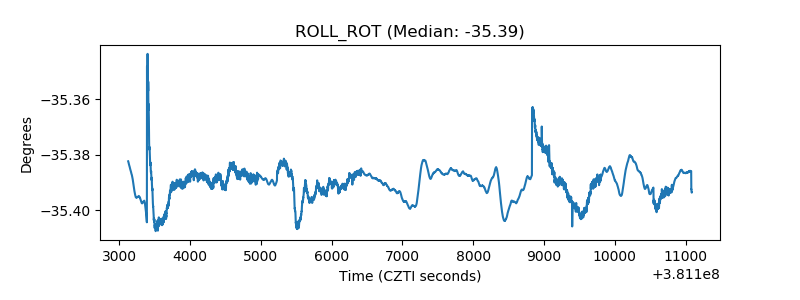 |
| _Roll_DEC | 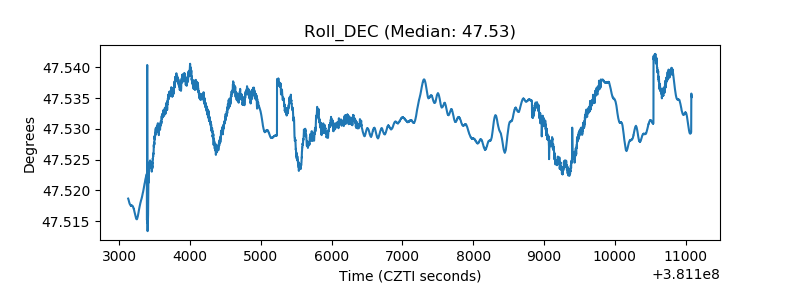 |
| _Roll_RA | 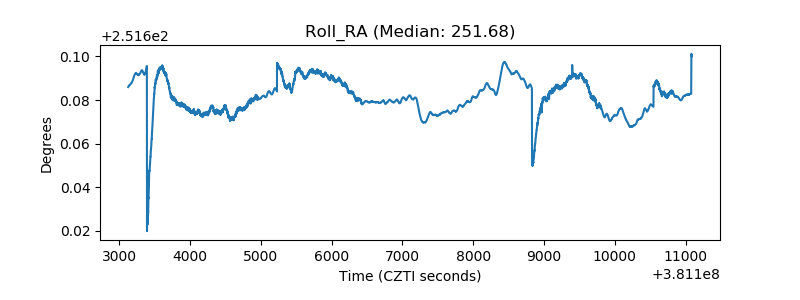 |
| Veto Counter | 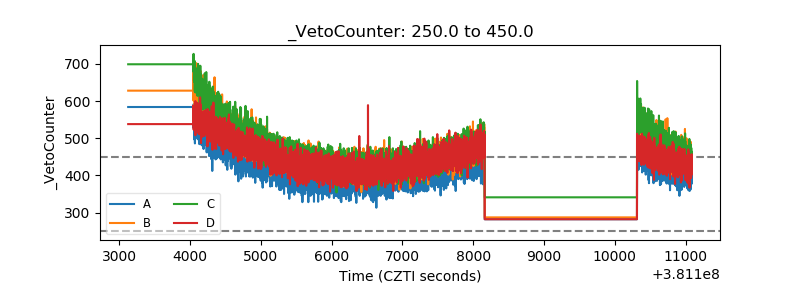 |