| Param | Original file | Final file |
|---|---|---|
| Filename | modeM0/AS1A11_059T09_9000004888_34265cztM0_level2.evt | modeM0/AS1A11_059T09_9000004888_34265cztM0_level2_quad_clean.evt |
| Size (bytes) | 429,249,600 | 89,400,960 |
| Size | 409.4 MB | 85.3 MB |
| Events in quadrant A | 2,812,215 | 590,370 |
| Events in quadrant B | 3,078,343 | 604,996 |
| Events in quadrant C | 2,699,359 | 598,371 |
| Events in quadrant D | 4,062,324 | 555,021 |
| Mode M0 | |||
|---|---|---|---|
| Quadrant | BADHDUFLAG | Total packets | Discarded packets |
| A | 0 | 11741 | 0 |
| B | 0 | 12585 | 0 |
| C | 0 | 10989 | 0 |
| D | 0 | 15479 | 0 |
| Mode SS | |||
|---|---|---|---|
| Quadrant | BADHDUFLAG | Total packets | Discarded packets |
| A | 0 | 106 | 0 |
| B | 0 | 106 | 0 |
| C | 0 | 106 | 0 |
| D | 0 | 106 | 0 |
| Mode M9 | |||
|---|---|---|---|
| Quadrant | BADHDUFLAG | Total packets | Discarded packets |
| A | 0 | 42 | 0 |
| B | 0 | 42 | 0 |
| C | 0 | 42 | 0 |
| D | 0 | 42 | 0 |
| Quadrant | Total seconds | Saturated seconds | Saturation percentage |
|---|---|---|---|
| A | 5119 | 58 | 1.133034% |
| B | 5119 | 144 | 2.813049% |
| C | 5119 | 40 | 0.781403% |
| D | 5119 | 146 | 2.852120% |
Noise dominated data is calculated using 1-second bins in cleaned event files. If a bin has >2000 counts, and if more than 50% of those come from <1% of pixels, then it is considered to be noise-dominated and hence unusable.
| Quadrant | # 1 sec bins | Bins with >0 counts | Bins with >2000 counts | High rate bins dominated by noise | Noise dominated (total time) | Noise dominated (detector-on time) | Marked lightcurve |
|---|---|---|---|---|---|---|---|
| A | 9333 | 5121 | 33 | 33 | 0.35% | 0.64% | 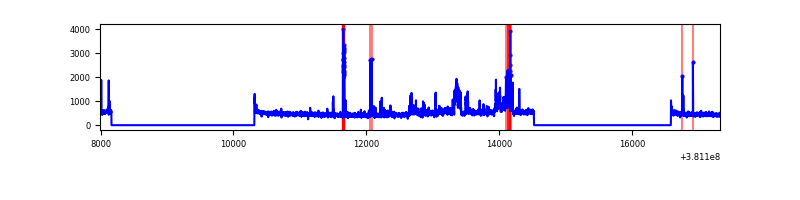 |
| B | 9333 | 5121 | 93 | 93 | 1.00% | 1.82% | 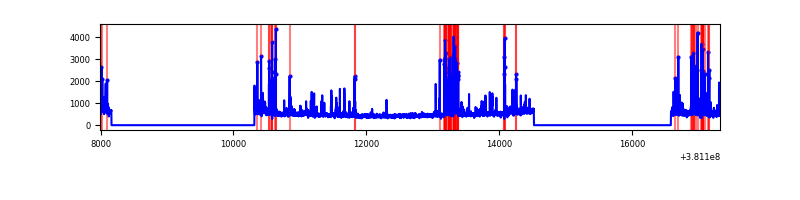 |
| C | 9333 | 5121 | 28 | 28 | 0.30% | 0.55% | 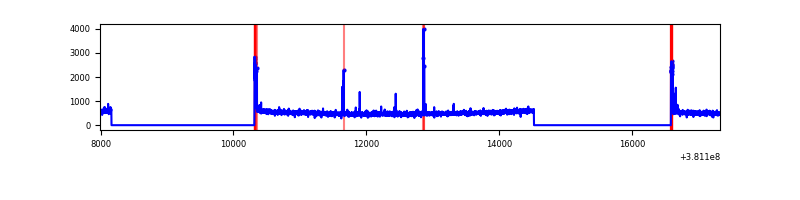 |
| D | 9333 | 5121 | 115 | 115 | 1.23% | 2.25% | 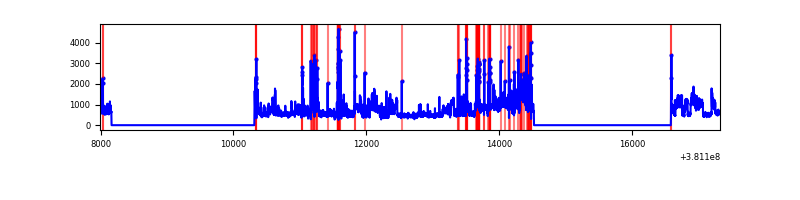 |
Top three noisy pixels from each quadrant. If the there are fewer than three noisy pixels in the level2.evt file, extra rows are filled as -1
| Pixel properties | Quadrant properties | ||||||
|---|---|---|---|---|---|---|---|
| Quadrant | DetID | PixID | Counts | Sigma | Mean | Median | Sigma |
| A | 15 | 169 | 434418 | 3611.08 | 598 | 587 | 120.1 |
| A | 9 | 143 | 32074 | 262.09 | 598 | 587 | 120.1 |
| A | 10 | 83 | 24298 | 197.36 | 598 | 587 | 120.1 |
| B | 5 | 172 | 491197 | 4251.71 | 597 | 582 | 115.4 |
| B | 0 | 229 | 94188 | 811.2 | 597 | 582 | 115.4 |
| B | 0 | 189 | 31421 | 267.25 | 597 | 582 | 115.4 |
| C | 15 | 214 | 223385 | 1638.89 | 585 | 592 | 135.9 |
| C | 0 | 10 | 96347 | 704.39 | 585 | 592 | 135.9 |
| C | 1 | 128 | 46044 | 334.35 | 585 | 592 | 135.9 |
| D | 8 | 195 | 1216979 | 8697.35 | 573 | 557 | 139.9 |
| D | 14 | 52 | 277873 | 1982.79 | 573 | 557 | 139.9 |
| D | 10 | 118 | 61326 | 434.49 | 573 | 557 | 139.9 |
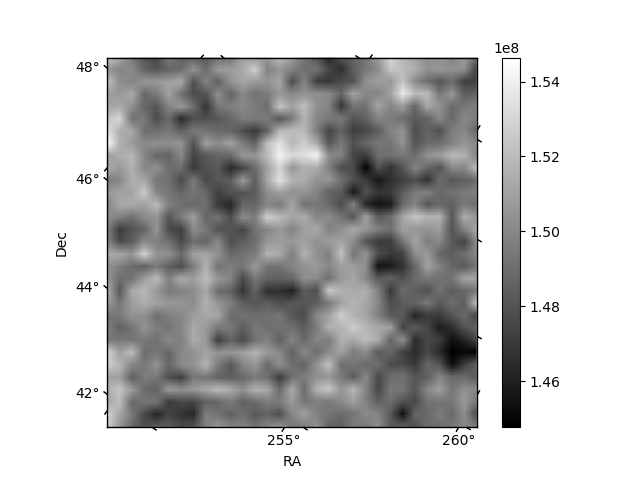
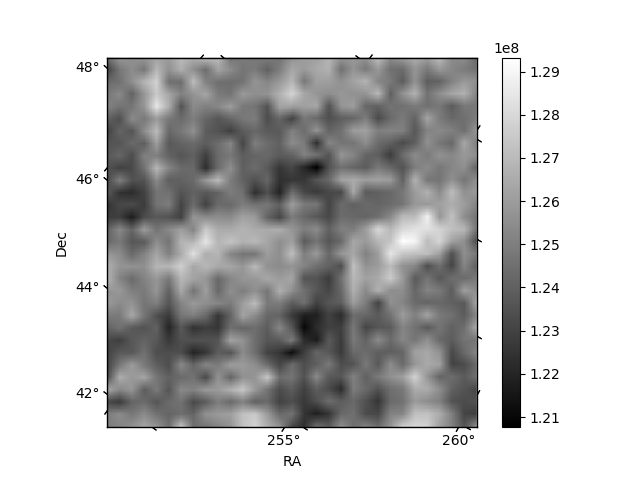
Histogram calculated using DETX and DETY for each event in the final _common_clean file
| Quadrant A | 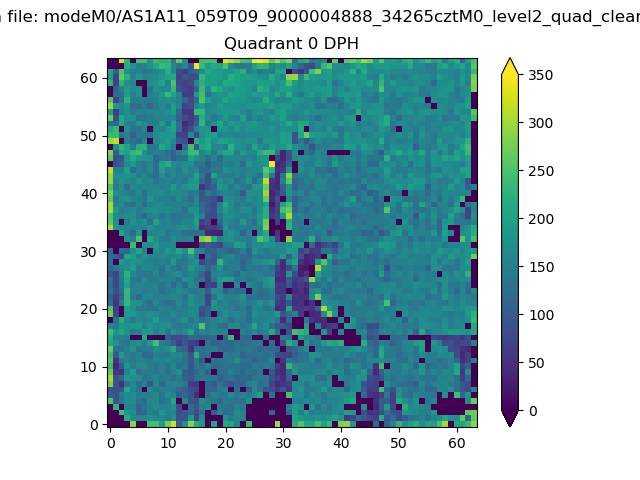 |
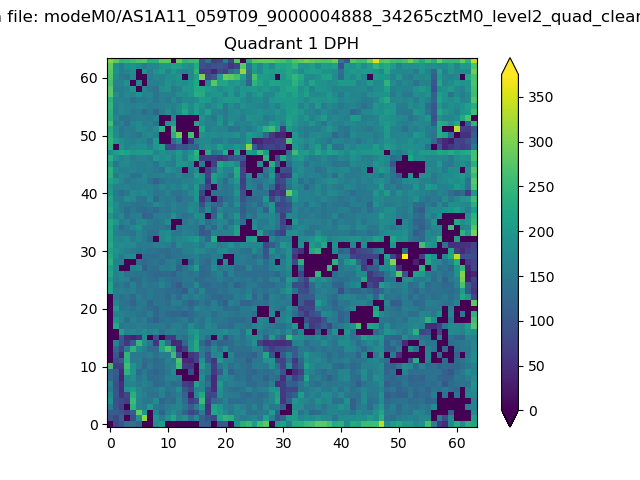 |
Quadrant B |
|---|---|---|---|
| Quadrant D | 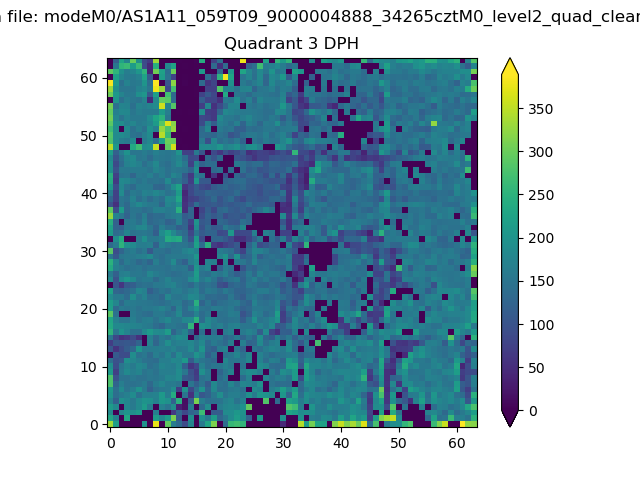 |
 |
Quadrant C |
| Plot type | Count rate plots | Images |
|---|---|---|
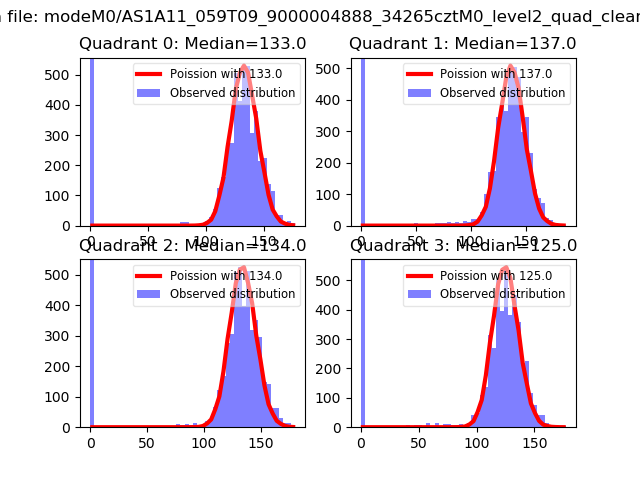
| Comparison with Poisson distribution Blue bars denote a histogram of data divided into 1 sec bins. Red curve is a Poisson curve with rate = median count rate of data. |
 |
 |
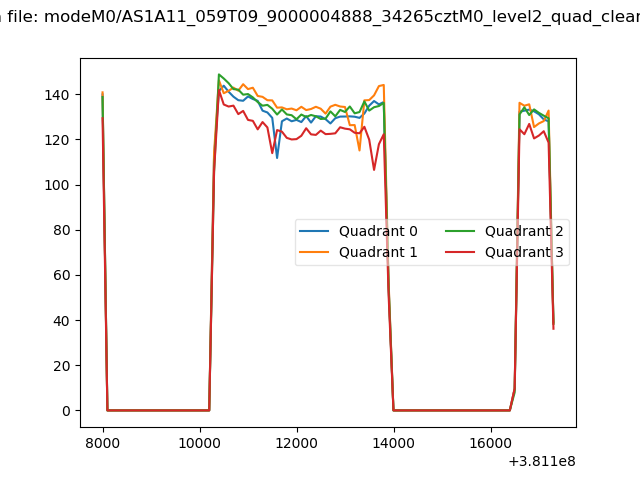
| Quadrant-wise count rates Data is divided into 100 sec bins |
 |
|
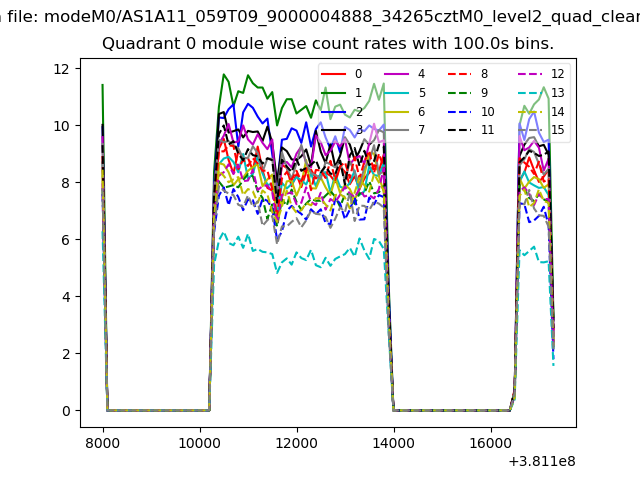
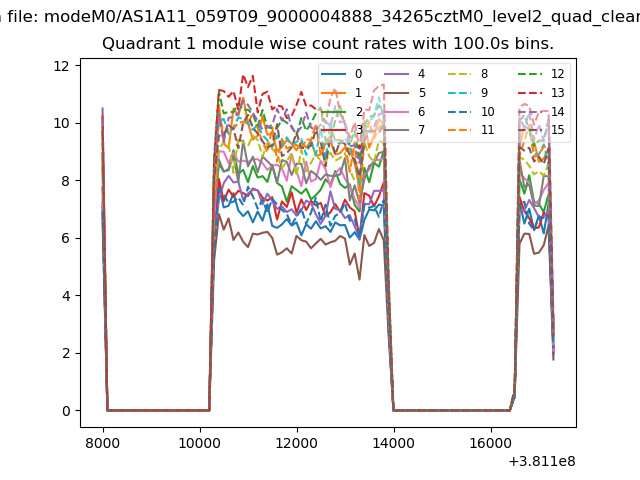
| Module-wise count rates for Quadrant A Data is divided into 100 sec bins |
 |
 |
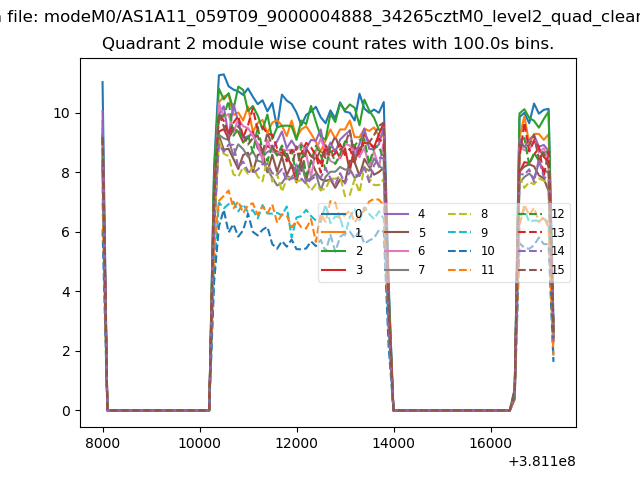
| Module-wise count rates for Quadrant B Data is divided into 100 sec bins |
 |
 |
| Module-wise count rates for Quadrant C Data is divided into 100 sec bins |
 |
 |
| Module-wise count rates for Quadrant D Data is divided into 100 sec bins |
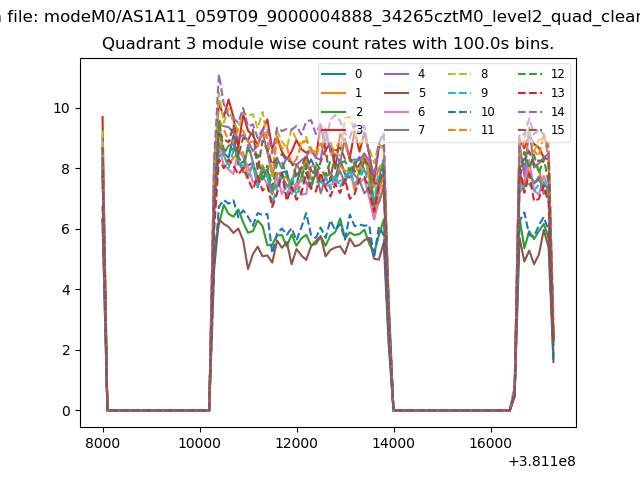 |
 |
| Parameter | Plot |
|---|---|
| CZT HV Monitor | 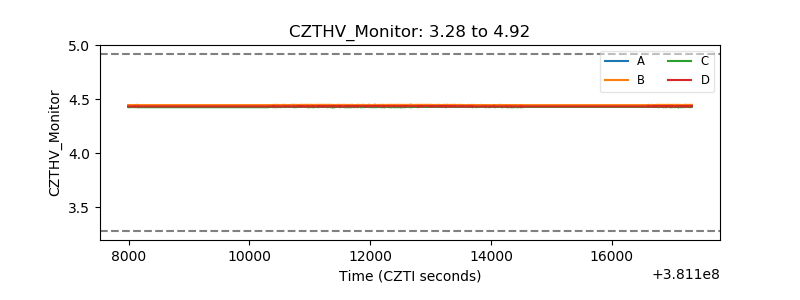 |
| D_VDD | 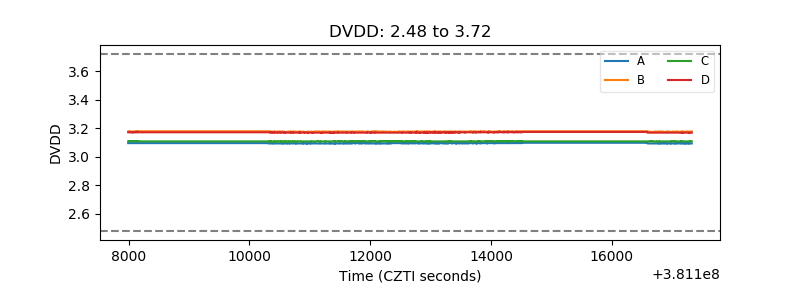 |
| Temperature 1 | 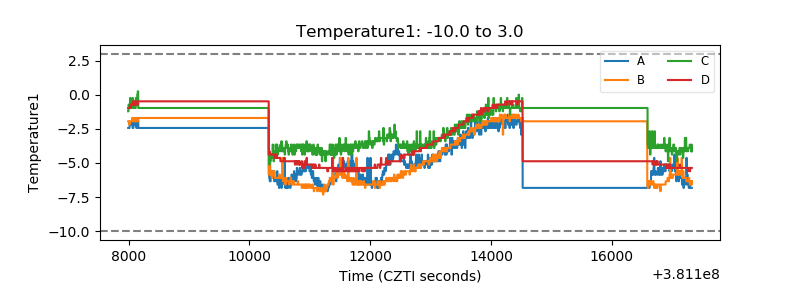 |
| Veto HV Monitor | 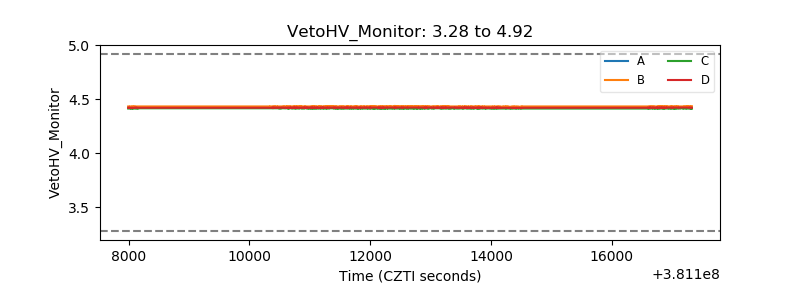 |
| Veto LLD | 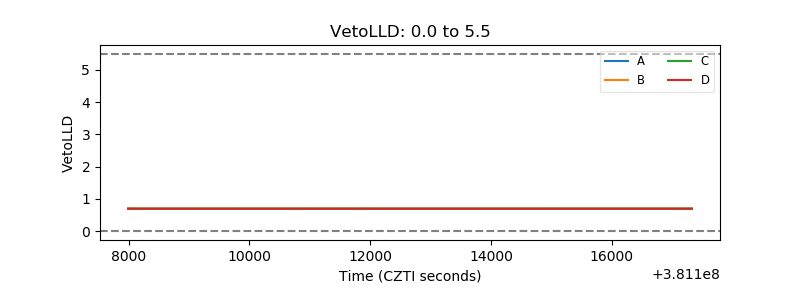 |
| Alpha Counter | 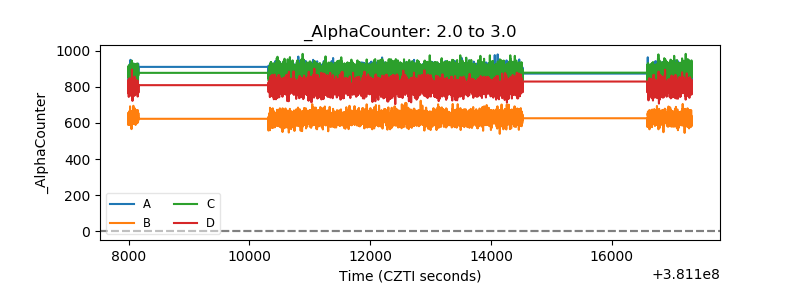 |
| _CPM_Rate | 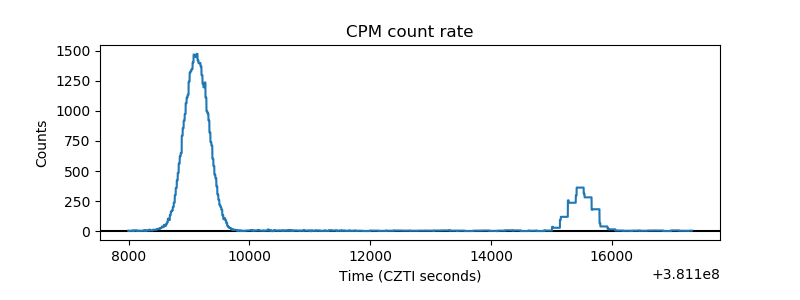 |
| CZT Counter | 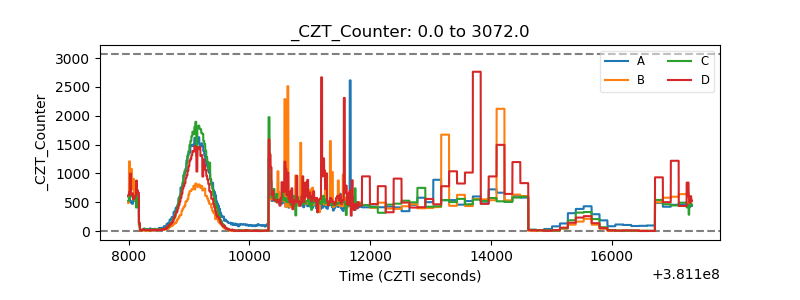 |
| +2.5 Volts monitor |  |
| +5 Volts monitor | 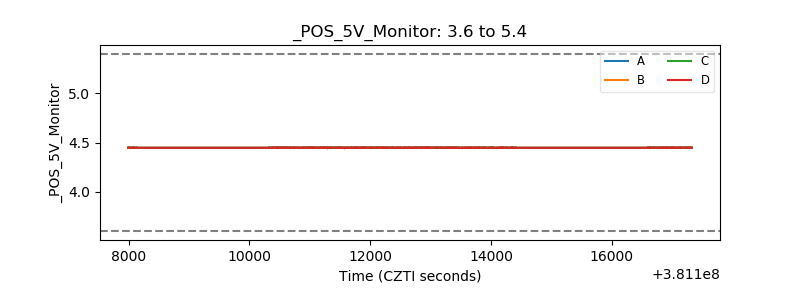 |
| _ROLL_ROT | 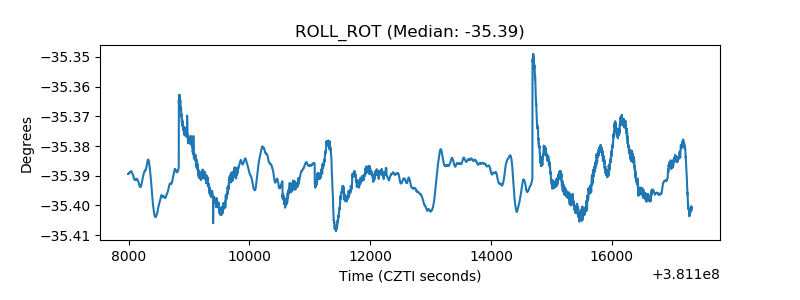 |
| _Roll_DEC |  |
| _Roll_RA | 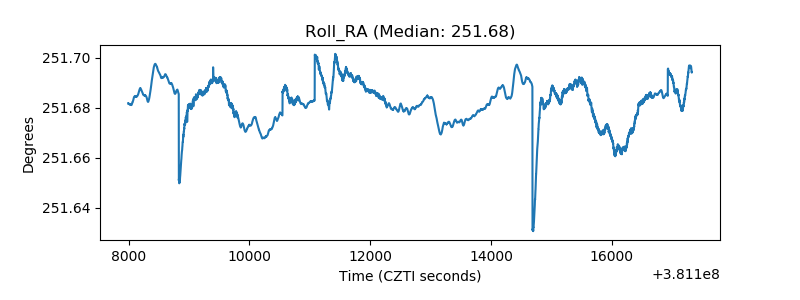 |
| Veto Counter | 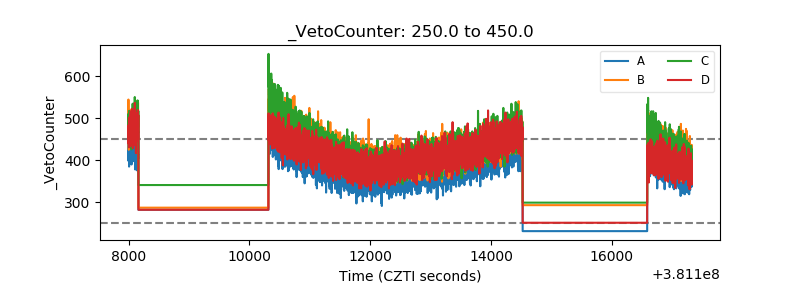 |