| Param | Original file | Final file |
|---|---|---|
| Filename | modeM0/AS1A11_059T09_9000004888_34271cztM0_level2.evt | modeM0/AS1A11_059T09_9000004888_34271cztM0_level2_quad_clean.evt |
| Size (bytes) | 1,317,905,280 | 185,184,000 |
| Size | 1.2 GB | 176.6 MB |
| Events in quadrant A | 7,161,820 | 1,157,776 |
| Events in quadrant B | 10,658,375 | 1,154,687 |
| Events in quadrant C | 8,059,108 | 1,152,550 |
| Events in quadrant D | 12,986,059 | 1,071,366 |
| Mode M0 | |||
|---|---|---|---|
| Quadrant | BADHDUFLAG | Total packets | Discarded packets |
| A | 0 | 31455 | 0 |
| B | 0 | 41715 | 0 |
| C | 0 | 32822 | 0 |
| D | 0 | 49159 | 0 |
| Mode SS | |||
|---|---|---|---|
| Quadrant | BADHDUFLAG | Total packets | Discarded packets |
| A | 0 | 316 | 0 |
| B | 0 | 316 | 0 |
| C | 0 | 316 | 0 |
| D | 0 | 316 | 0 |
| Mode M9 | |||
|---|---|---|---|
| Quadrant | BADHDUFLAG | Total packets | Discarded packets |
| A | 0 | 42 | 0 |
| B | 0 | 42 | 0 |
| C | 0 | 42 | 0 |
| D | 0 | 42 | 0 |
| Quadrant | Total seconds | Saturated seconds | Saturation percentage |
|---|---|---|---|
| A | 15539 | 22 | 0.141579% |
| B | 15539 | 1058 | 6.808675% |
| C | 15539 | 48 | 0.308900% |
| D | 15539 | 416 | 2.677135% |
Noise dominated data is calculated using 1-second bins in cleaned event files. If a bin has >2000 counts, and if more than 50% of those come from <1% of pixels, then it is considered to be noise-dominated and hence unusable.
| Quadrant | # 1 sec bins | Bins with >0 counts | Bins with >2000 counts | High rate bins dominated by noise | Noise dominated (total time) | Noise dominated (detector-on time) | Marked lightcurve |
|---|---|---|---|---|---|---|---|
| A | 19688 | 15542 | 7 | 7 | 0.04% | 0.05% | 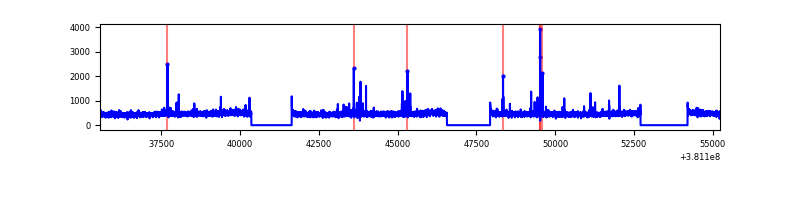 |
| B | 19688 | 15542 | 697 | 697 | 3.54% | 4.48% | 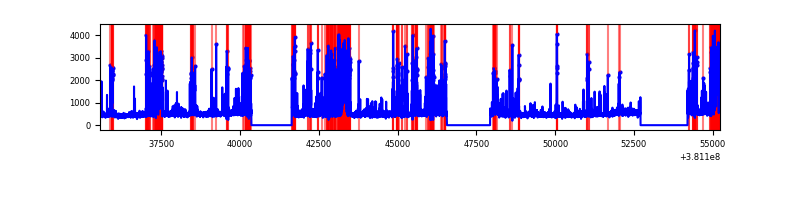 |
| C | 19688 | 15542 | 26 | 26 | 0.13% | 0.17% | 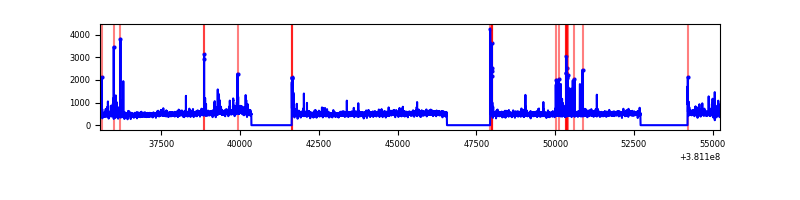 |
| D | 19688 | 15542 | 343 | 343 | 1.74% | 2.21% | 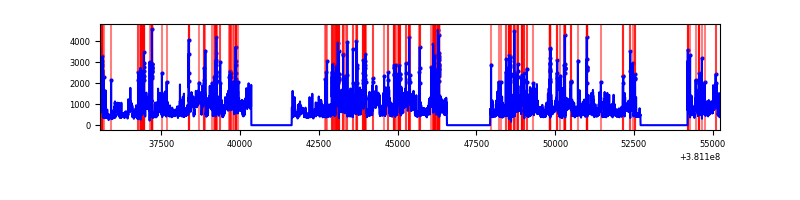 |
Top three noisy pixels from each quadrant. If the there are fewer than three noisy pixels in the level2.evt file, extra rows are filled as -1
| Pixel properties | Quadrant properties | ||||||
|---|---|---|---|---|---|---|---|
| Quadrant | DetID | PixID | Counts | Sigma | Mean | Median | Sigma |
| A | 9 | 143 | 82798 | 223.09 | 1815 | 1776 | 363.2 |
| A | 10 | 83 | 45988 | 121.74 | 1815 | 1776 | 363.2 |
| A | 13 | 254 | 24115 | 61.51 | 1815 | 1776 | 363.2 |
| B | 5 | 172 | 3106496 | 9280.73 | 1759 | 1712 | 334.5 |
| B | 4 | 251 | 205984 | 610.6 | 1759 | 1712 | 334.5 |
| B | 0 | 190 | 94245 | 276.6 | 1759 | 1712 | 334.5 |
| C | 15 | 214 | 670152 | 1645.58 | 1760 | 1769 | 406.2 |
| C | 14 | 254 | 222368 | 543.12 | 1760 | 1769 | 406.2 |
| C | 14 | 67 | 111052 | 269.06 | 1760 | 1769 | 406.2 |
| D | 8 | 195 | 4188212 | 9810.09 | 1741 | 1692 | 426.8 |
| D | 13 | 249 | 650834 | 1521.11 | 1741 | 1692 | 426.8 |
| D | 7 | 80 | 557254 | 1301.82 | 1741 | 1692 | 426.8 |
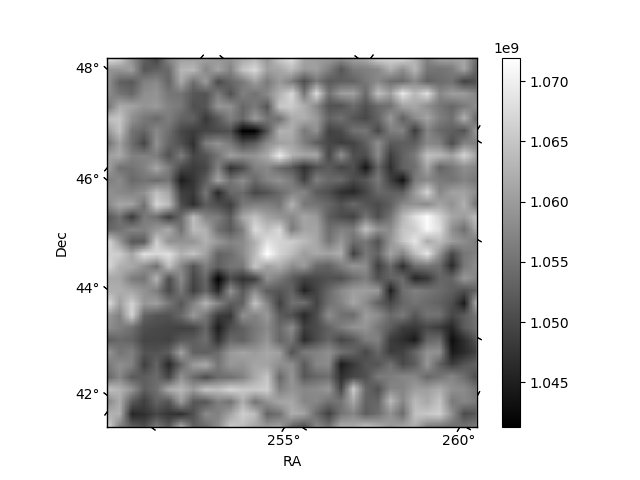
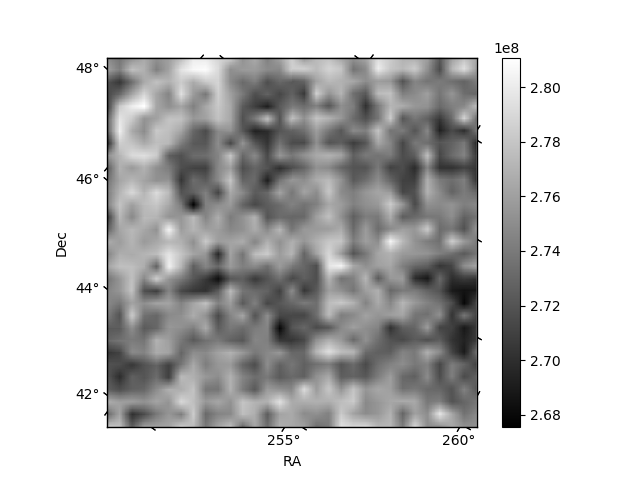
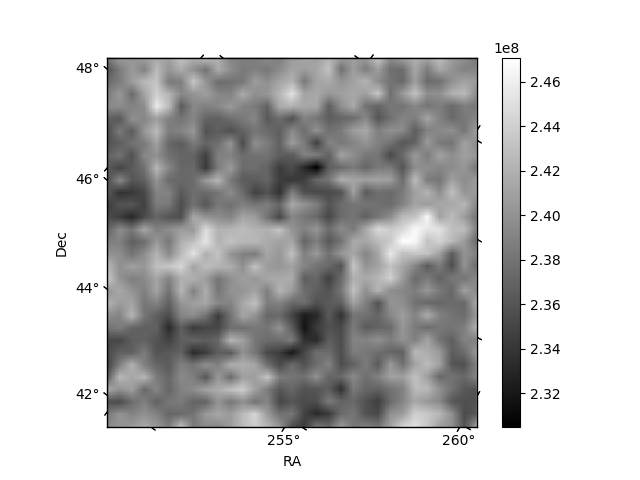
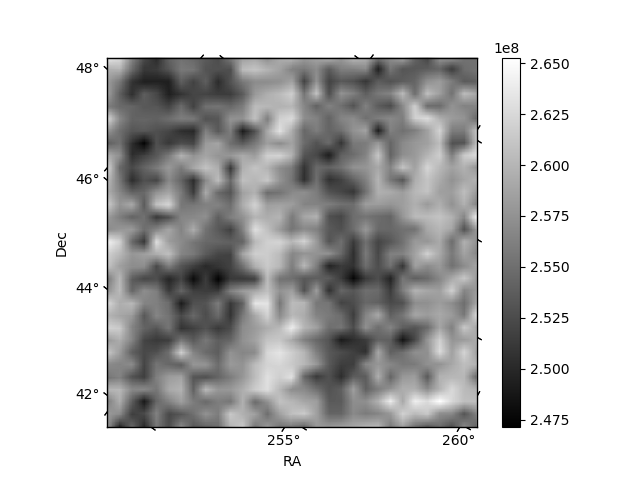
Histogram calculated using DETX and DETY for each event in the final _common_clean file
| Quadrant A | 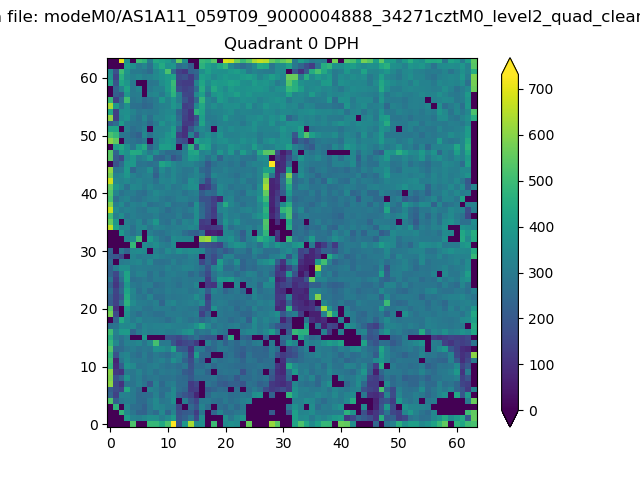 |
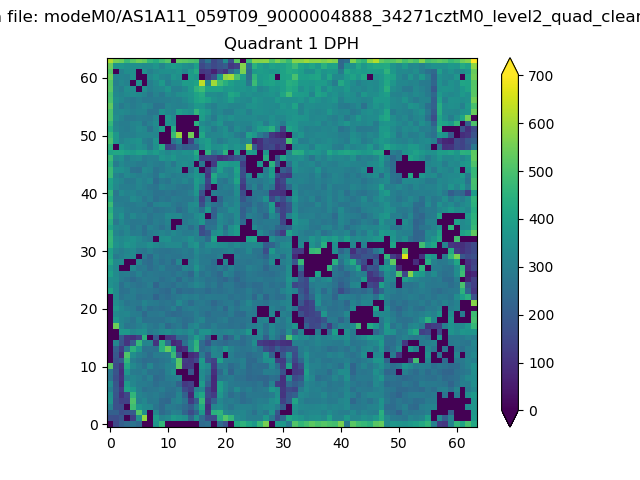 |
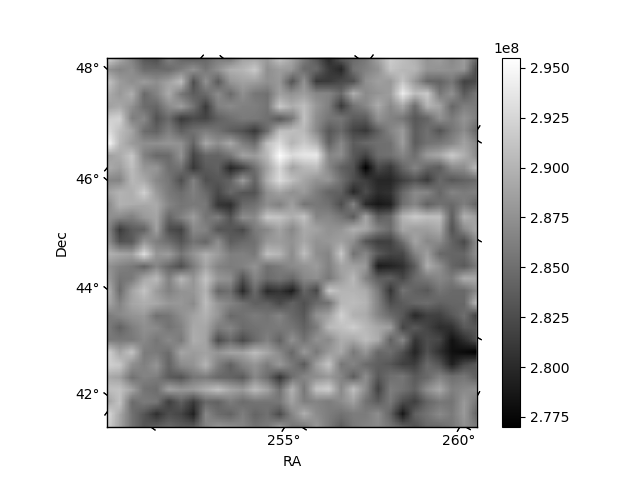
Quadrant B |
|---|---|---|---|
| Quadrant D | 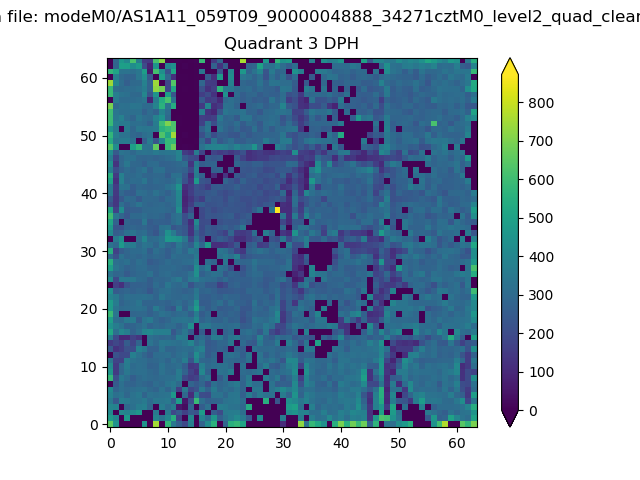 |
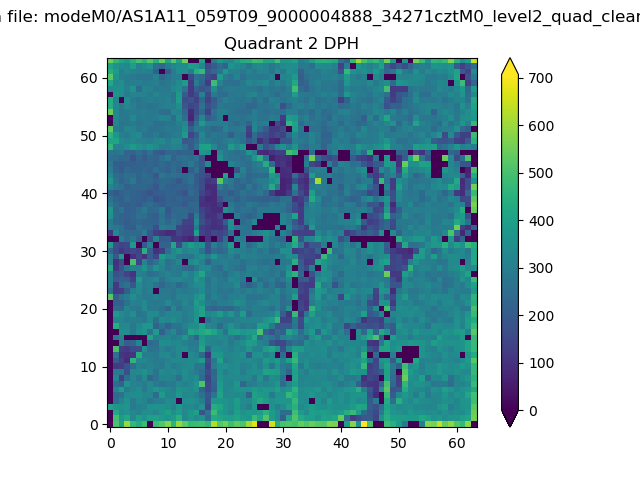 |
Quadrant C |
| Plot type | Count rate plots | Images |
|---|---|---|
| Comparison with Poisson distribution Blue bars denote a histogram of data divided into 1 sec bins. Red curve is a Poisson curve with rate = median count rate of data. |
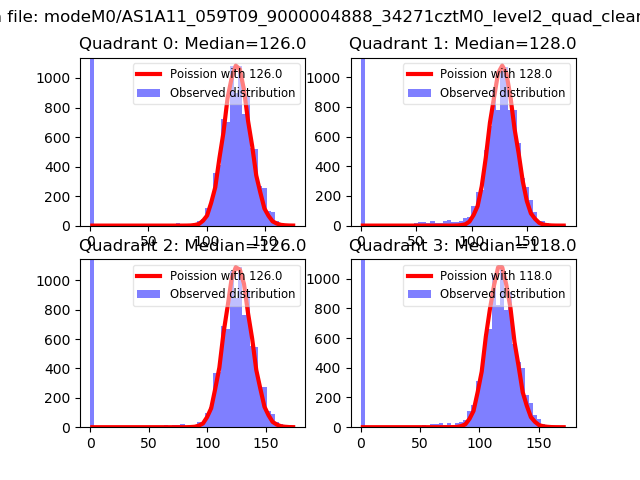 |
 |
| Quadrant-wise count rates Data is divided into 100 sec bins |
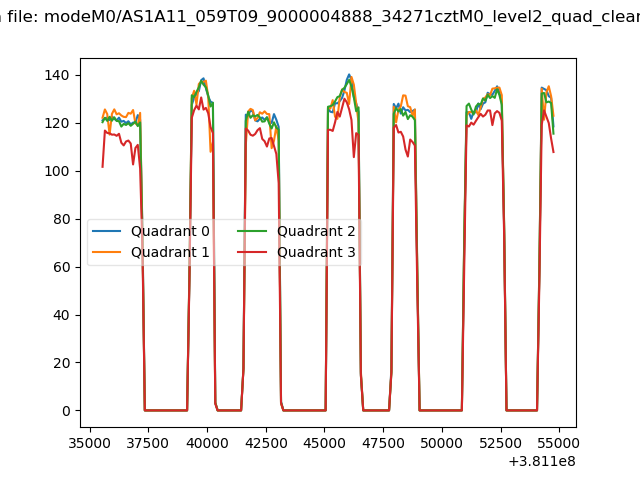 |
|
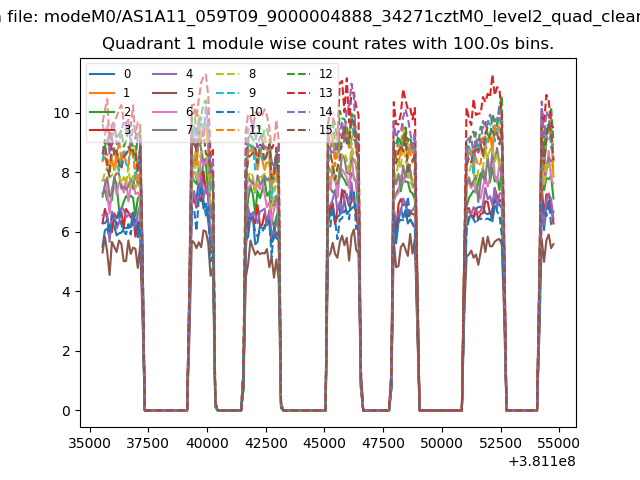
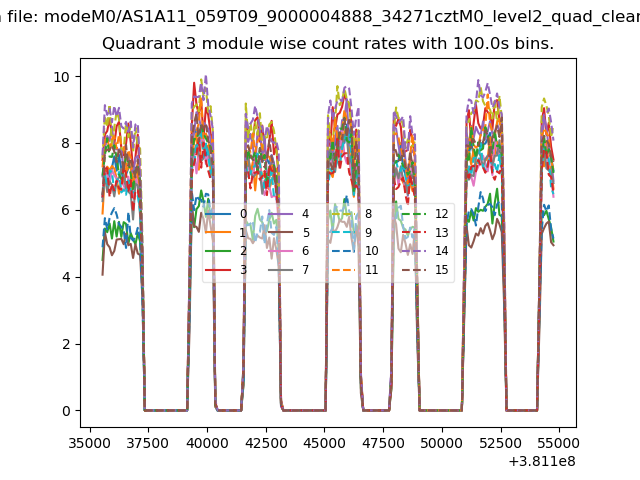
| Module-wise count rates for Quadrant A Data is divided into 100 sec bins |
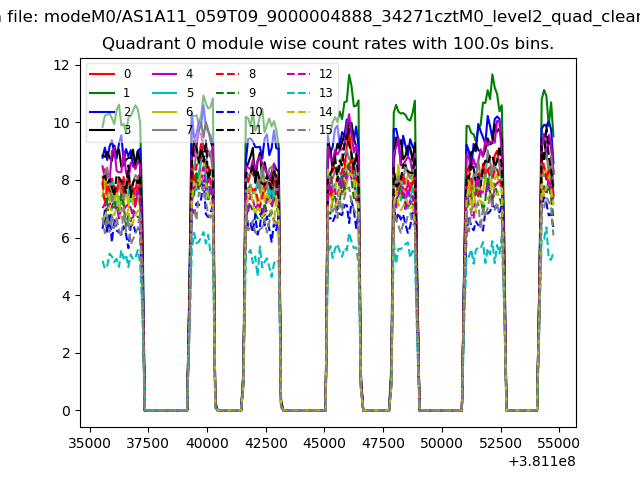 |
 |
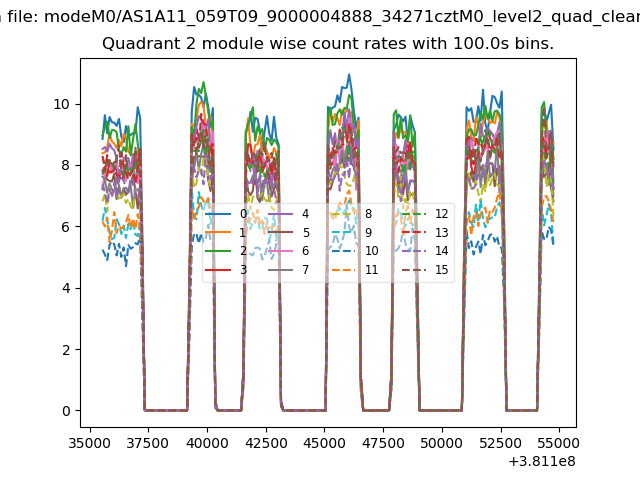
| Module-wise count rates for Quadrant B Data is divided into 100 sec bins |
 |
 |
| Module-wise count rates for Quadrant C Data is divided into 100 sec bins |
 |
 |
| Module-wise count rates for Quadrant D Data is divided into 100 sec bins |
 |
 |
| Parameter | Plot |
|---|---|
| CZT HV Monitor | 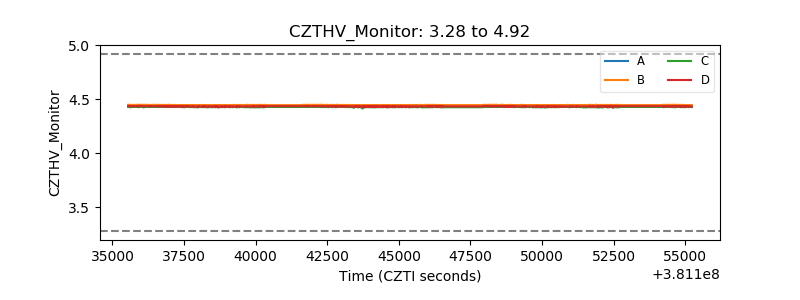 |
| D_VDD | 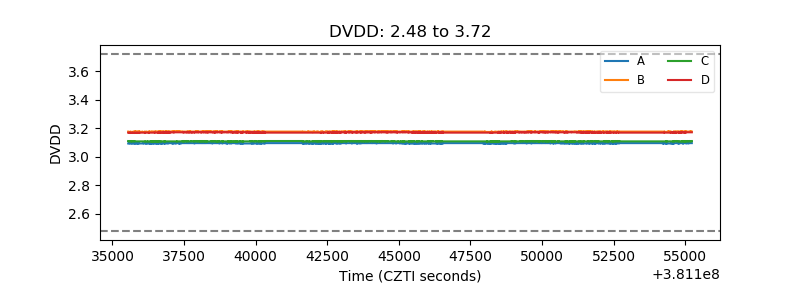 |
| Temperature 1 | 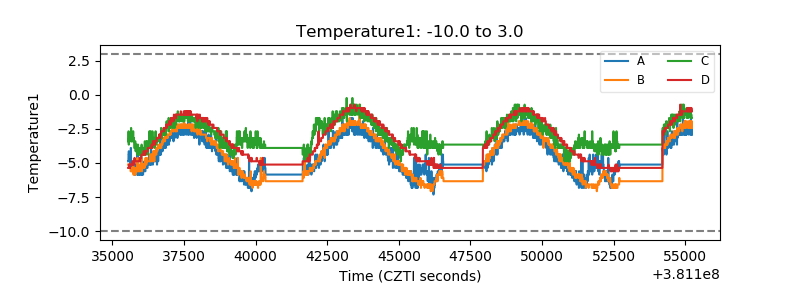 |
| Veto HV Monitor | 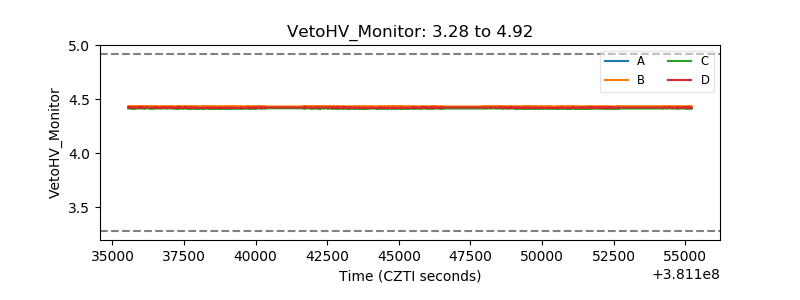 |
| Veto LLD | 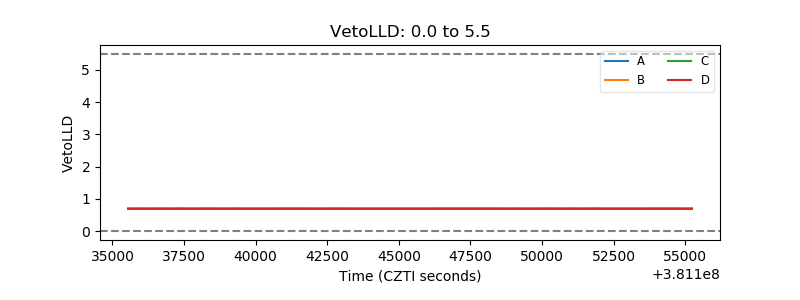 |
| Alpha Counter | 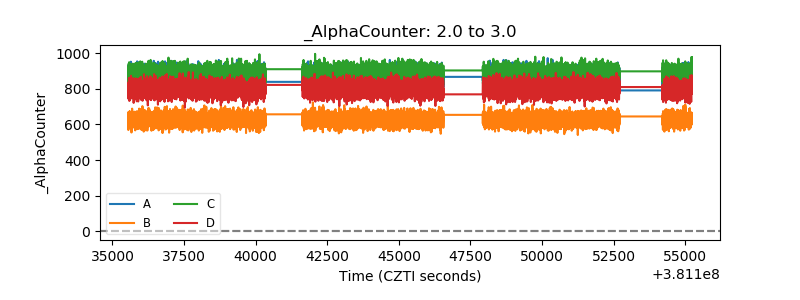 |
| _CPM_Rate | 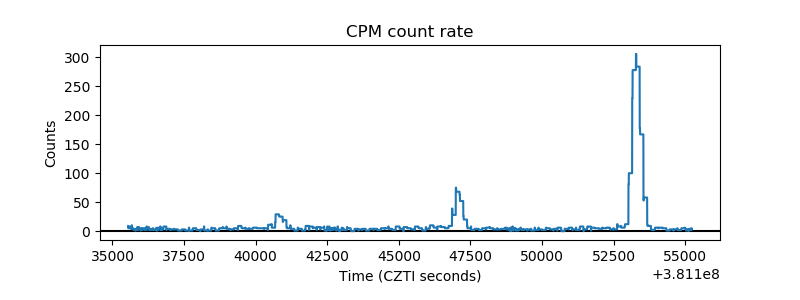 |
| CZT Counter | 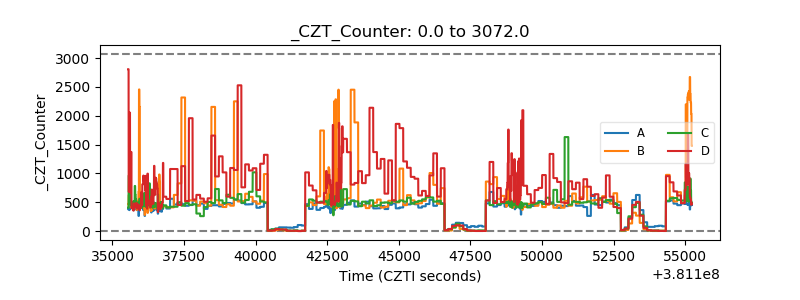 |
| +2.5 Volts monitor |  |
| +5 Volts monitor |  |
| _ROLL_ROT | 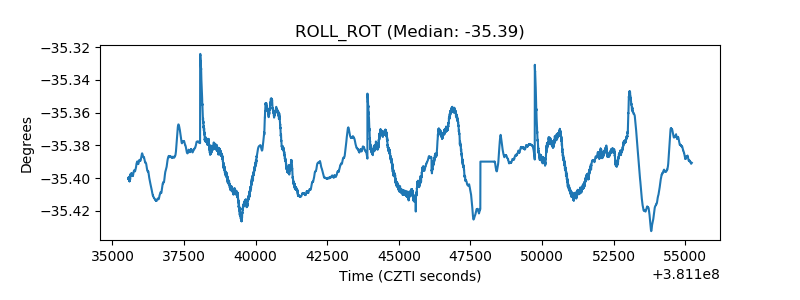 |
| _Roll_DEC | 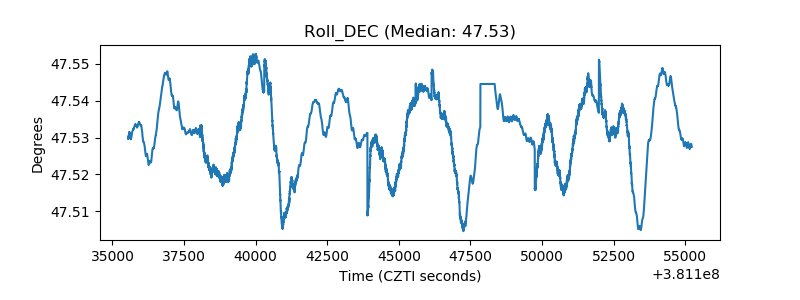 |
| _Roll_RA | 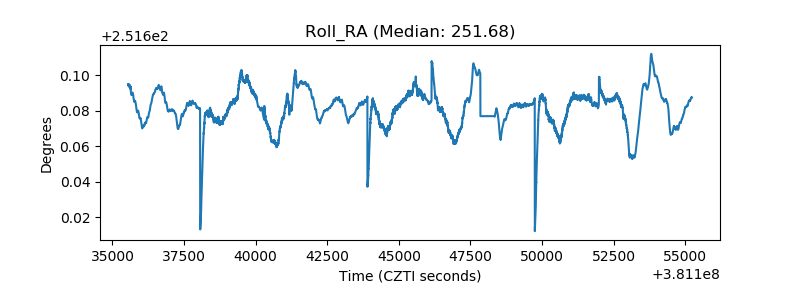 |
| Veto Counter | 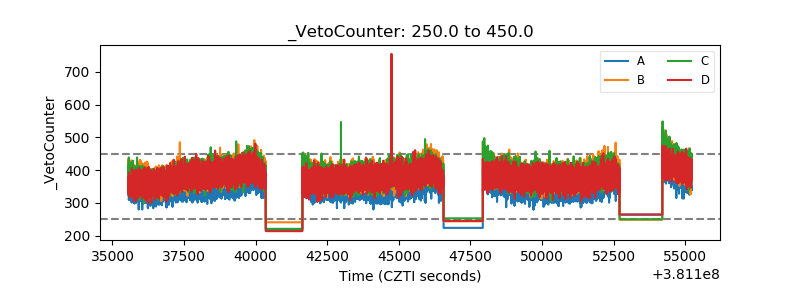 |