| Param | Original file | Final file |
|---|---|---|
| Filename | modeM0/AS1T05_003T01_9000004886cztM0_level2.fits | modeM0/AS1T05_003T01_9000004886cztM0_level2_quad_clean.evt |
| Size (bytes) | 542,252,160 | 533,655,360 |
| Size | 517.1 MB | 508.9 MB |
| Events in quadrant A | 3,337,030 | 3,272,359 |
| Events in quadrant B | 3,106,256 | 2,984,650 |
| Events in quadrant C | 3,276,944 | 3,220,128 |
| Events in quadrant D | 2,736,096 | 2,722,129 |
| Mode M9 | |||
|---|---|---|---|
| Quadrant | BADHDUFLAG | Total packets | Discarded packets |
| A | 0 | 210 | 0 |
| B | 0 | 210 | 0 |
| C | 0 | 210 | 0 |
| D | 0 | 210 | 0 |
| Mode SS | |||
|---|---|---|---|
| Quadrant | BADHDUFLAG | Total packets | Discarded packets |
| A | 0 | 1180 | 0 |
| B | 0 | 1180 | 0 |
| C | 0 | 1180 | 0 |
| D | 0 | 1180 | 0 |
| Mode M0 | |||
|---|---|---|---|
| Quadrant | BADHDUFLAG | Total packets | Discarded packets |
| A | 0 | 122180 | 0 |
| B | 0 | 169228 | 0 |
| C | 0 | 139976 | 0 |
| D | 0 | 182681 | 0 |
| Quadrant | Total seconds | Saturated seconds | Saturation percentage |
|---|---|---|---|
| A | 57757 | 184 | 0.318576% |
| B | 57757 | 5157 | 8.928788% |
| C | 57757 | 1295 | 2.242152% |
| D | 57757 | 4474 | 7.746247% |
Noise dominated data is calculated using 1-second bins in cleaned event files. If a bin has >2000 counts, and if more than 50% of those come from <1% of pixels, then it is considered to be noise-dominated and hence unusable.
| Quadrant | # 1 sec bins | Bins with >0 counts | Bins with >2000 counts | High rate bins dominated by noise | Noise dominated (total time) | Noise dominated (detector-on time) | Marked lightcurve |
|---|---|---|---|---|---|---|---|
| A | 77737 | 57756 | 0 | 0 | 0.00% | 0.00% |  |
| B | 77737 | 57744 | 0 | 0 | 0.00% | 0.00% | 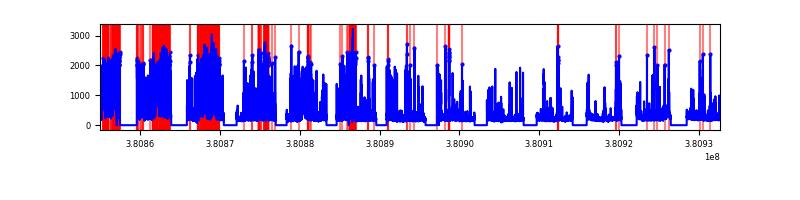 |
| C | 77737 | 57744 | 0 | 0 | 0.00% | 0.00% | 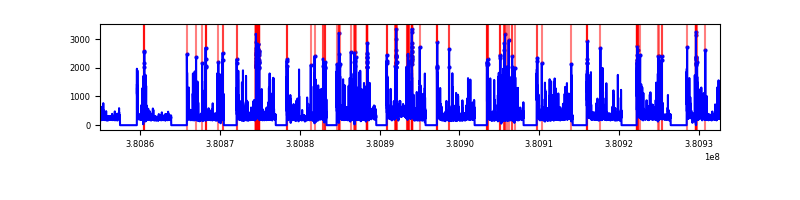 |
| D | 77737 | 57199 | 0 | 0 | 0.00% | 0.00% | 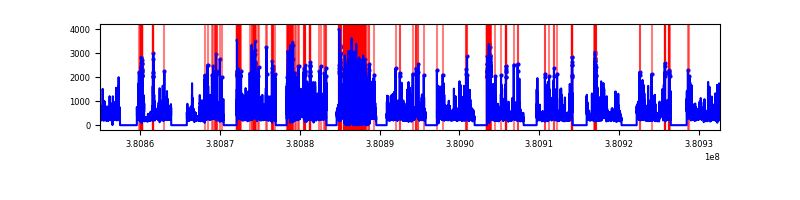 |
Top three noisy pixels from each quadrant. If the there are fewer than three noisy pixels in the level2.evt file, extra rows are filled as -1
| Pixel properties | Quadrant properties | ||||||
|---|---|---|---|---|---|---|---|
| Quadrant | DetID | PixID | Counts | Sigma | Mean | Median | Sigma |
| A | 9 | 19 | 2746 | 8.98 | 871 | 818 | 214.6 |
| A | 7 | 110 | 2623 | 8.41 | 871 | 818 | 214.6 |
| A | 0 | 29 | 2611 | 8.36 | 871 | 818 | 214.6 |
| B | 2 | 9 | 2796 | 12.48 | 823 | 788 | 160.9 |
| B | 3 | 80 | 2436 | 10.24 | 823 | 788 | 160.9 |
| B | 2 | 8 | 2313 | 9.48 | 823 | 788 | 160.9 |
| C | 1 | 81 | 2794 | 8.94 | 867 | 815 | 221.3 |
| C | 1 | 80 | 2695 | 8.5 | 867 | 815 | 221.3 |
| C | 3 | 203 | 2608 | 8.1 | 867 | 815 | 221.3 |
| D | 7 | 3 | 2090 | 6.5 | 783 | 715 | 211.5 |
| D | 6 | 67 | 2003 | 6.09 | 783 | 715 | 211.5 |
| D | 10 | 189 | 1993 | 6.04 | 783 | 715 | 211.5 |
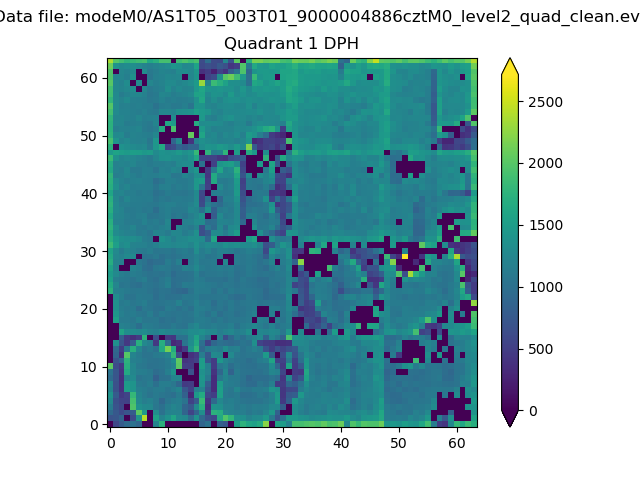
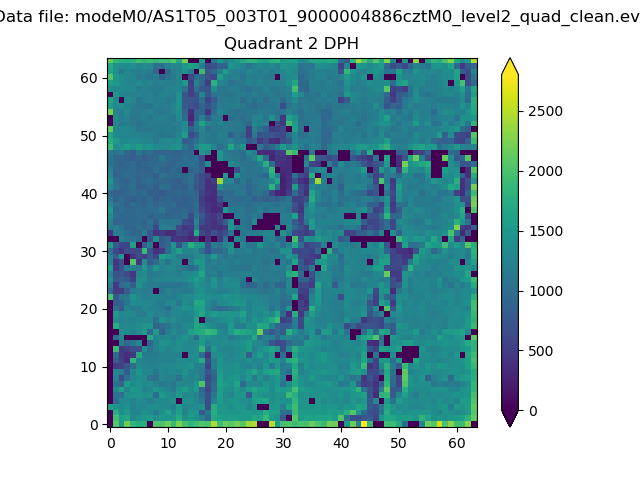
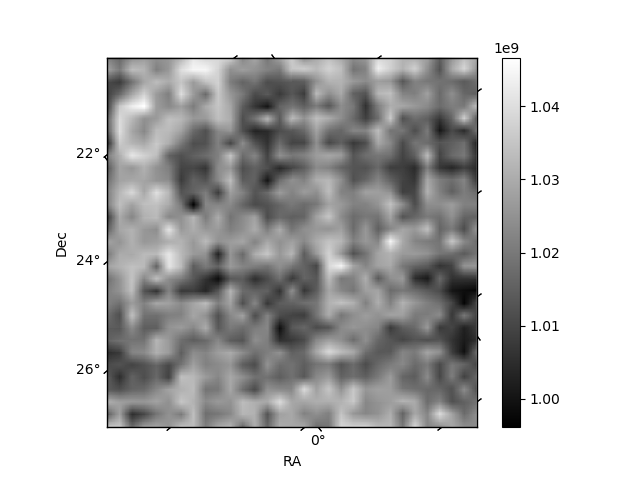
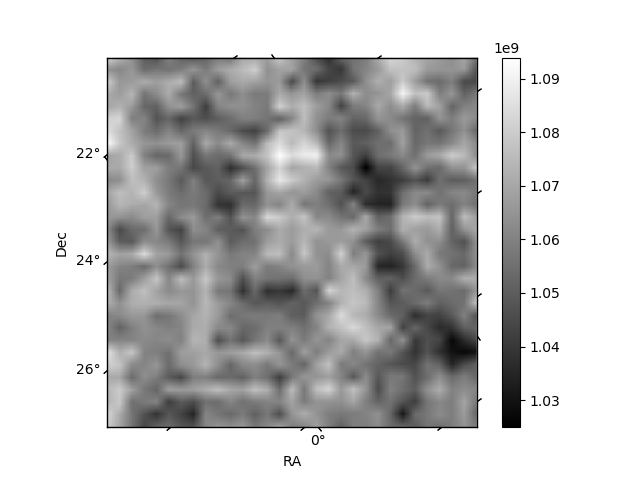
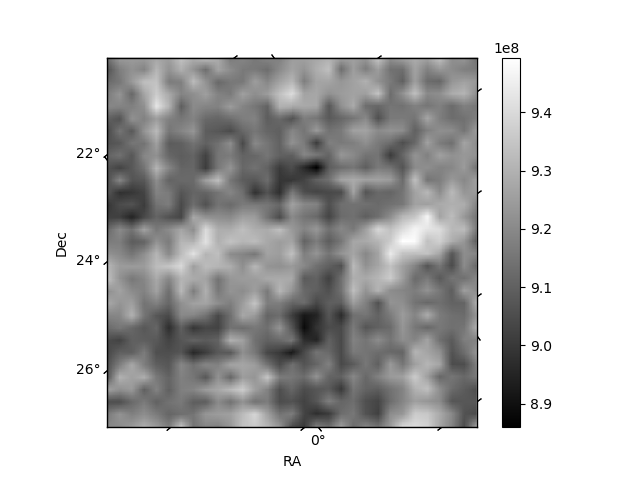
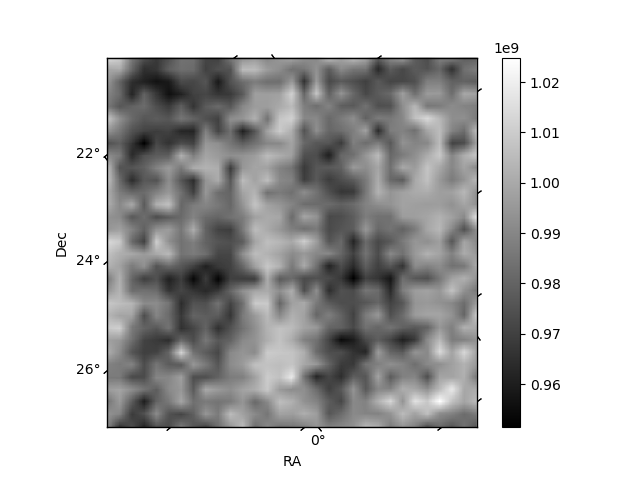
Histogram calculated using DETX and DETY for each event in the final _common_clean file
| Quadrant A | 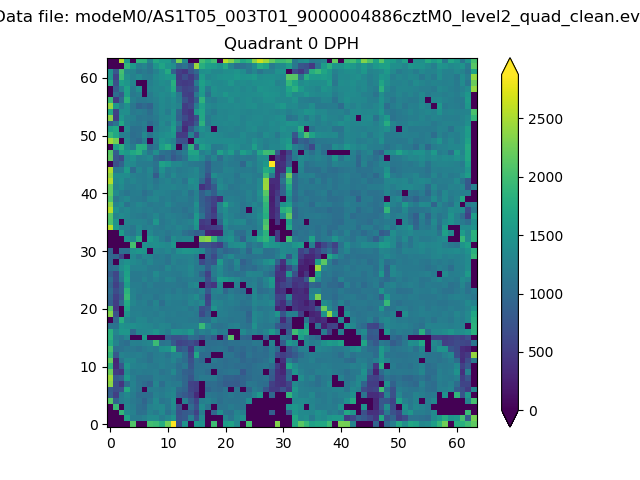 |
 |
Quadrant B |
|---|---|---|---|
| Quadrant D | 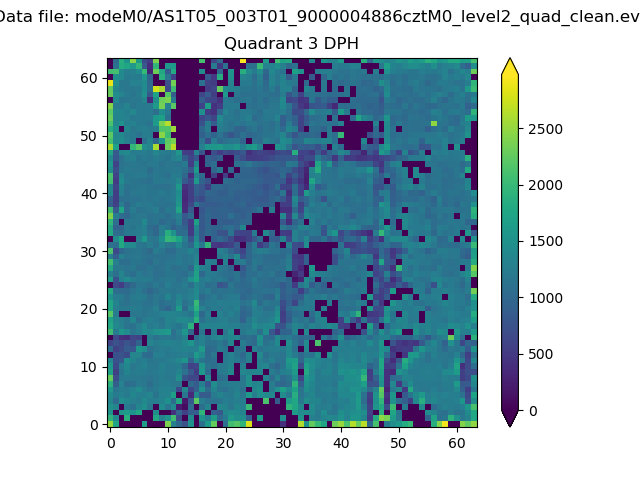 |
 |
Quadrant C |
| Plot type | Count rate plots | Images |
|---|---|---|
| Comparison with Poisson distribution Blue bars denote a histogram of data divided into 1 sec bins. Red curve is a Poisson curve with rate = median count rate of data. |
 |
 |
| Quadrant-wise count rates Data is divided into 100 sec bins |
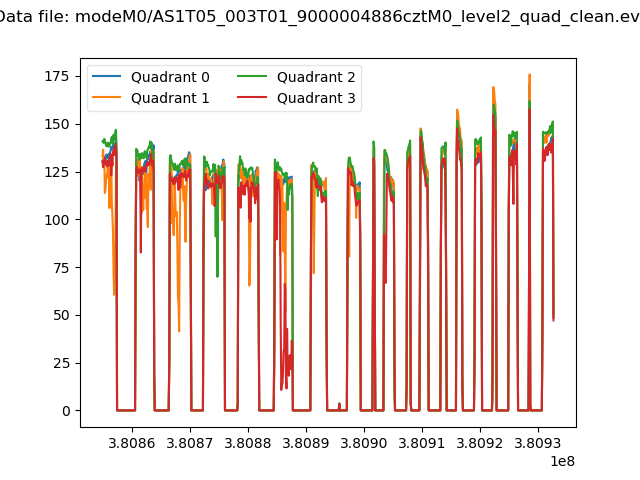 |
|
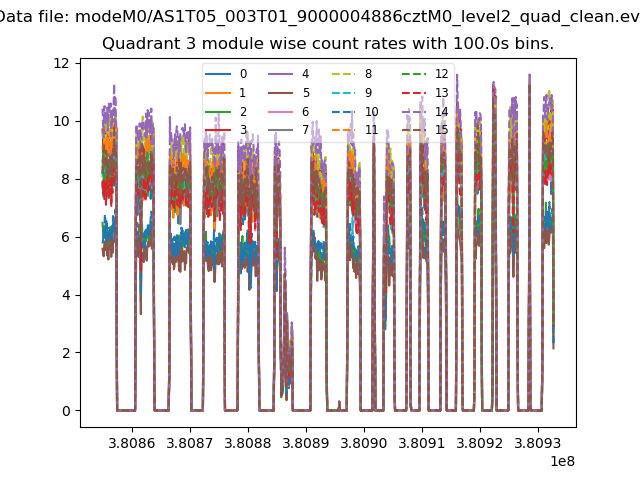
| Module-wise count rates for Quadrant A Data is divided into 100 sec bins |
 |
 |
| Module-wise count rates for Quadrant B Data is divided into 100 sec bins |
 |
 |
| Module-wise count rates for Quadrant C Data is divided into 100 sec bins |
 |
 |
| Module-wise count rates for Quadrant D Data is divided into 100 sec bins |
 |
 |
| Parameter | Plot |
|---|---|
| CZT HV Monitor | 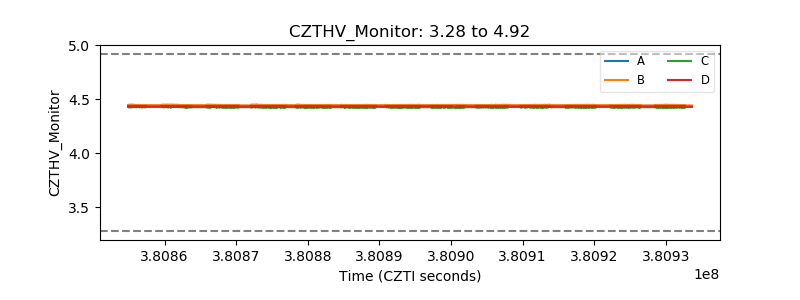 |
| D_VDD | 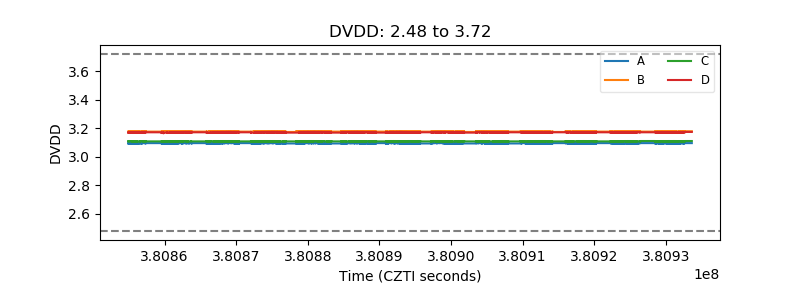 |
| Temperature 1 | 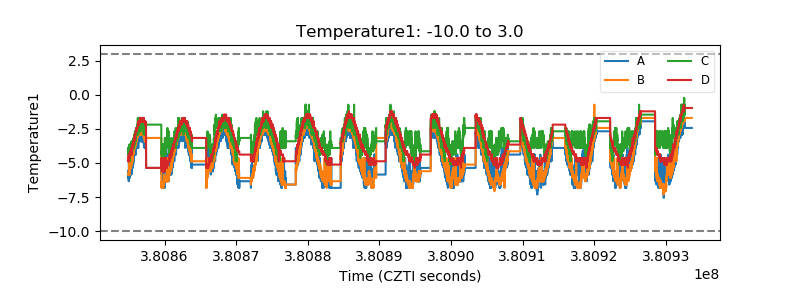 |
| Veto HV Monitor |  |
| Veto LLD | 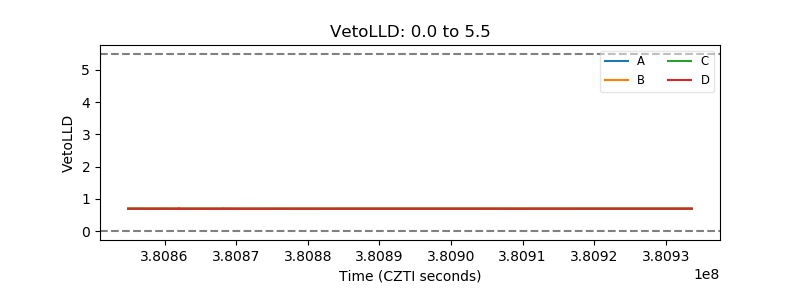 |
| Alpha Counter |  |
| _CPM_Rate | 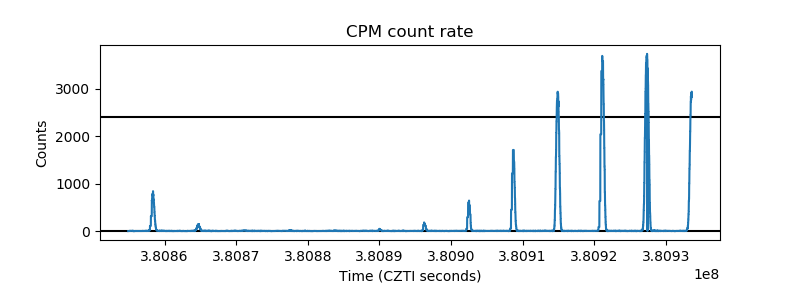 |
| CZT Counter | 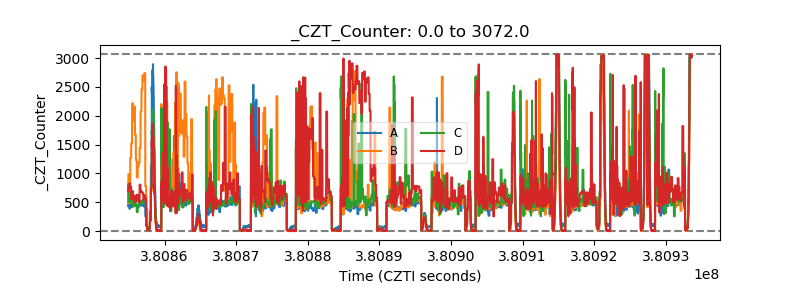 |
| +2.5 Volts monitor |  |
| +5 Volts monitor |  |
| _ROLL_ROT | 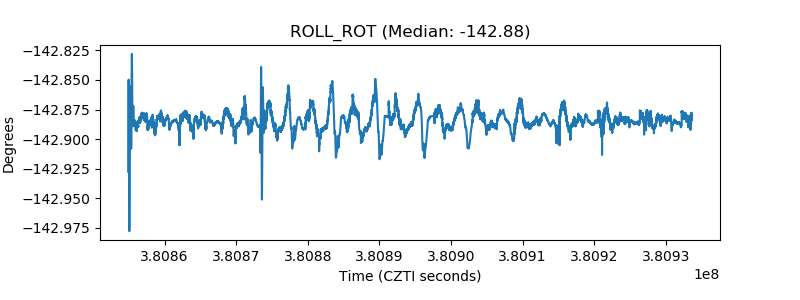 |
| _Roll_DEC | 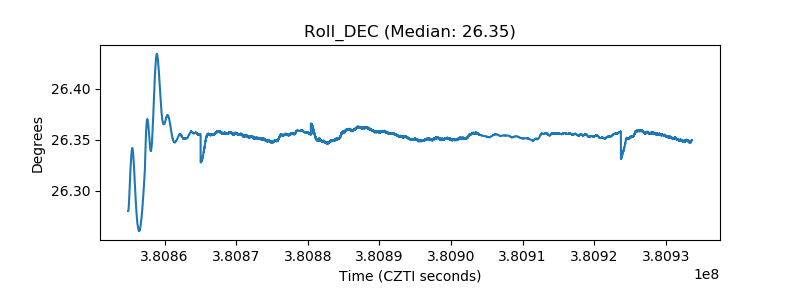 |
| _Roll_RA | 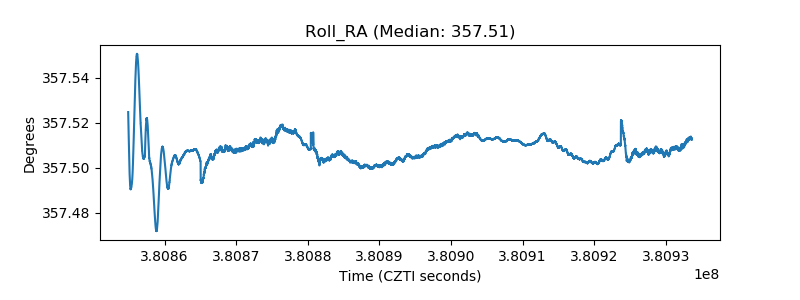 |
| Veto Counter | 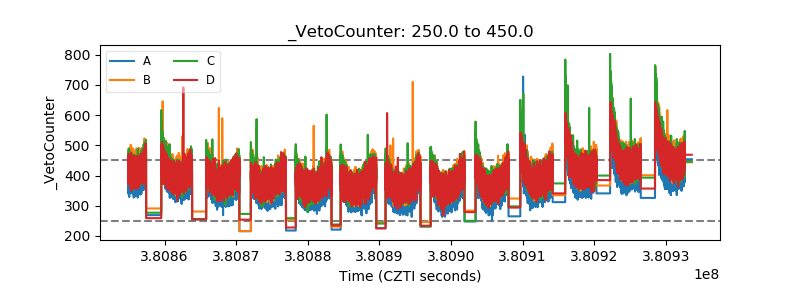 |