| Param | Original file | Final file |
|---|---|---|
| Filename | modeM0/AS1T04_086T01_9000004890_34275cztM0_level2.evt | modeM0/AS1T04_086T01_9000004890_34275cztM0_level2_quad_clean.evt |
| Size (bytes) | 466,364,160 | 69,255,360 |
| Size | 444.8 MB | 66.0 MB |
| Events in quadrant A | 2,434,026 | 443,579 |
| Events in quadrant B | 3,512,108 | 438,502 |
| Events in quadrant C | 2,773,436 | 447,614 |
| Events in quadrant D | 5,052,187 | 403,303 |
| Mode M0 | |||
|---|---|---|---|
| Quadrant | BADHDUFLAG | Total packets | Discarded packets |
| A | 0 | 10551 | 2 |
| B | 0 | 13631 | 1 |
| C | 0 | 11202 | 1 |
| D | 0 | 18544 | 1 |
| Mode SS | |||
|---|---|---|---|
| Quadrant | BADHDUFLAG | Total packets | Discarded packets |
| A | 0 | 108 | 0 |
| B | 0 | 108 | 0 |
| C | 0 | 108 | 0 |
| D | 0 | 108 | 0 |
| Mode M9 | |||
|---|---|---|---|
| Quadrant | BADHDUFLAG | Total packets | Discarded packets |
| A | 0 | 18 | 0 |
| B | 0 | 18 | 0 |
| C | 0 | 18 | 0 |
| D | 0 | 18 | 0 |
| Quadrant | Total seconds | Saturated seconds | Saturation percentage |
|---|---|---|---|
| A | 5186 | 5 | 0.096413% |
| B | 5186 | 271 | 5.225607% |
| C | 5186 | 22 | 0.424219% |
| D | 5186 | 334 | 6.440417% |
Noise dominated data is calculated using 1-second bins in cleaned event files. If a bin has >2000 counts, and if more than 50% of those come from <1% of pixels, then it is considered to be noise-dominated and hence unusable.
| Quadrant | # 1 sec bins | Bins with >0 counts | Bins with >2000 counts | High rate bins dominated by noise | Noise dominated (total time) | Noise dominated (detector-on time) | Marked lightcurve |
|---|---|---|---|---|---|---|---|
| A | 7039 | 5187 | 0 | 0 | 0.00% | 0.00% | 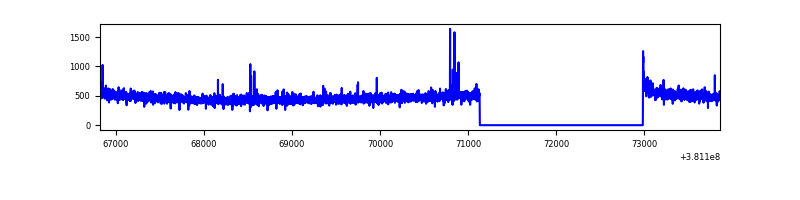 |
| B | 7039 | 5187 | 194 | 194 | 2.76% | 3.74% | 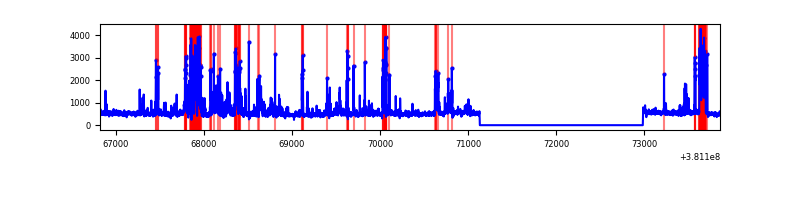 |
| C | 7039 | 5187 | 15 | 15 | 0.21% | 0.29% | 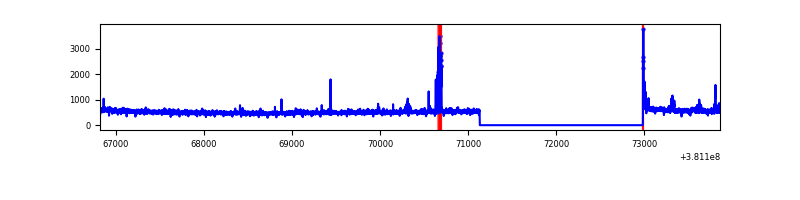 |
| D | 7039 | 5187 | 318 | 318 | 4.52% | 6.13% | 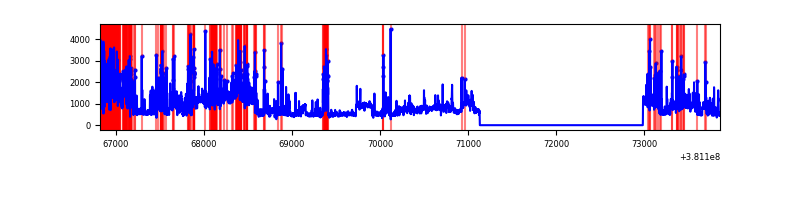 |
Top three noisy pixels from each quadrant. If the there are fewer than three noisy pixels in the level2.evt file, extra rows are filled as -1
| Pixel properties | Quadrant properties | ||||||
|---|---|---|---|---|---|---|---|
| Quadrant | DetID | PixID | Counts | Sigma | Mean | Median | Sigma |
| A | 9 | 143 | 21317 | 167.68 | 618 | 606 | 123.5 |
| A | 10 | 83 | 18487 | 144.77 | 618 | 606 | 123.5 |
| A | 13 | 254 | 8739 | 65.85 | 618 | 606 | 123.5 |
| B | 5 | 172 | 830820 | 7211.93 | 609 | 594 | 115.1 |
| B | 5 | 31 | 151341 | 1309.5 | 609 | 594 | 115.1 |
| B | 0 | 189 | 29815 | 253.83 | 609 | 594 | 115.1 |
| C | 15 | 214 | 222766 | 1573.3 | 615 | 620 | 141.2 |
| C | 14 | 254 | 92409 | 650.08 | 615 | 620 | 141.2 |
| C | 0 | 10 | 26765 | 185.17 | 615 | 620 | 141.2 |
| D | 2 | 250 | 1090952 | 7495.59 | 600 | 585 | 145.5 |
| D | 8 | 195 | 953993 | 6554.08 | 600 | 585 | 145.5 |
| D | 1 | 52 | 214051 | 1467.45 | 600 | 585 | 145.5 |
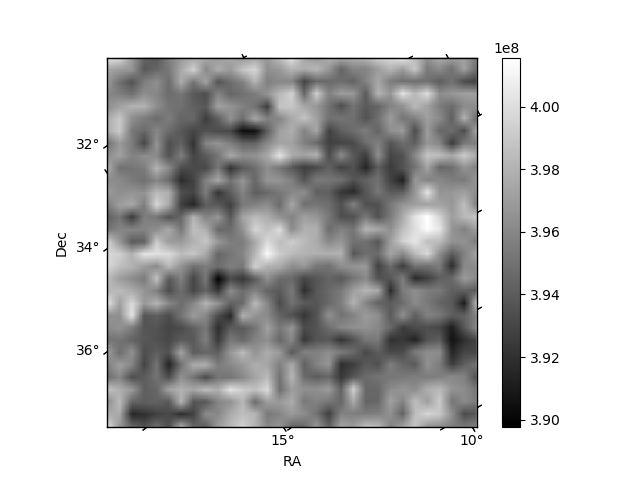
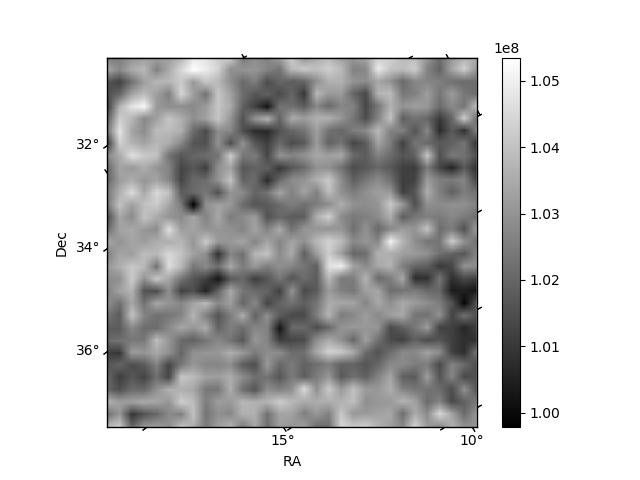
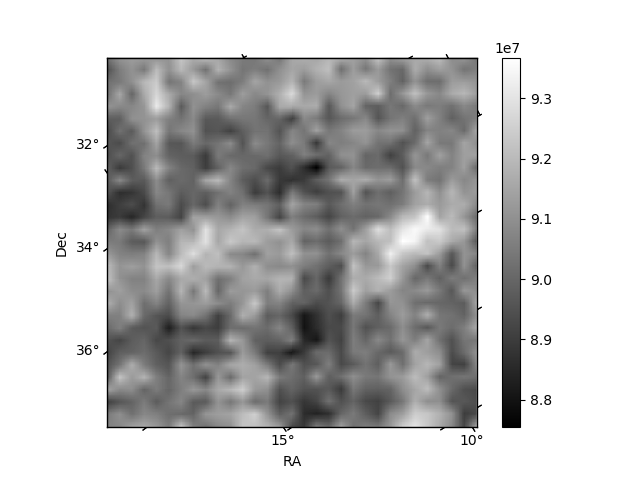
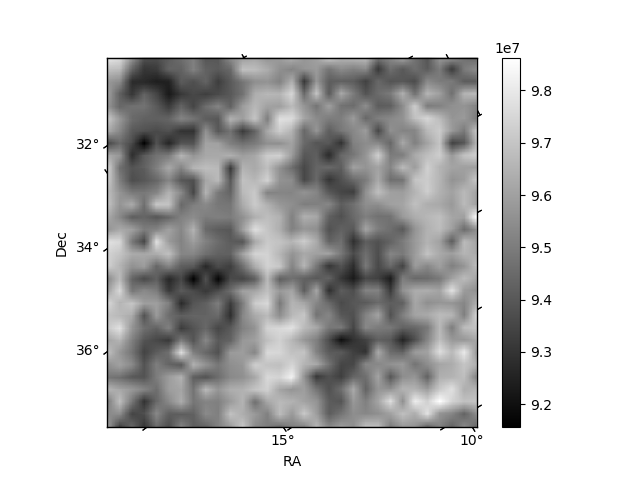
Histogram calculated using DETX and DETY for each event in the final _common_clean file
| Quadrant A | 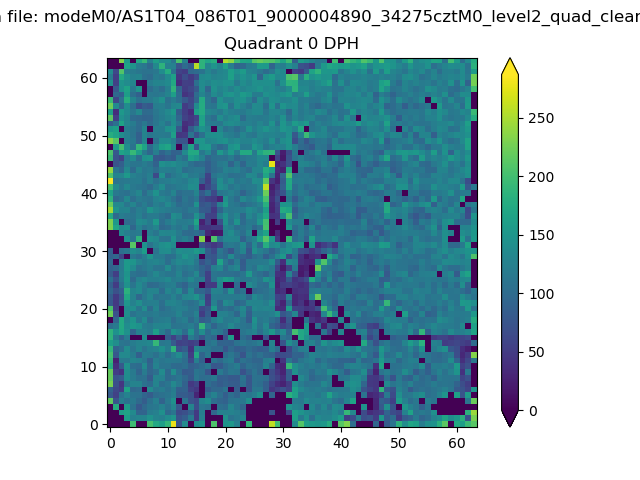 |
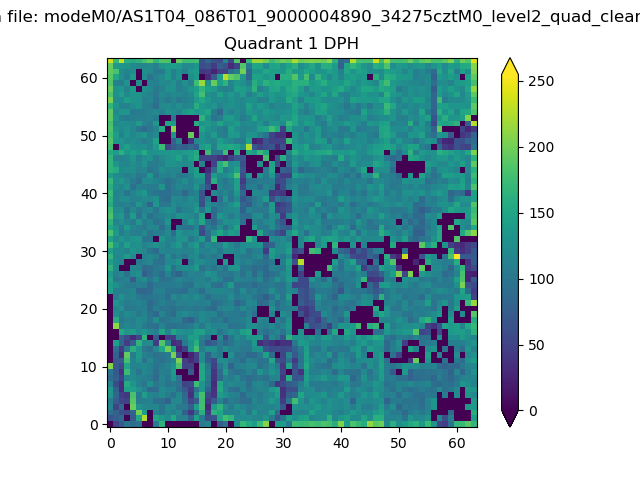 |
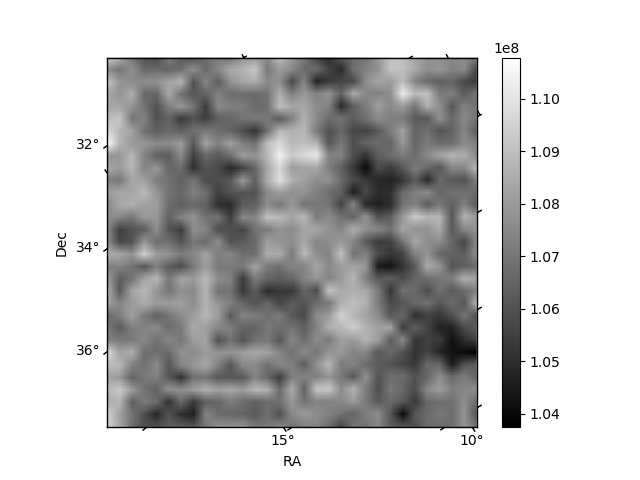
Quadrant B |
|---|---|---|---|
| Quadrant D | 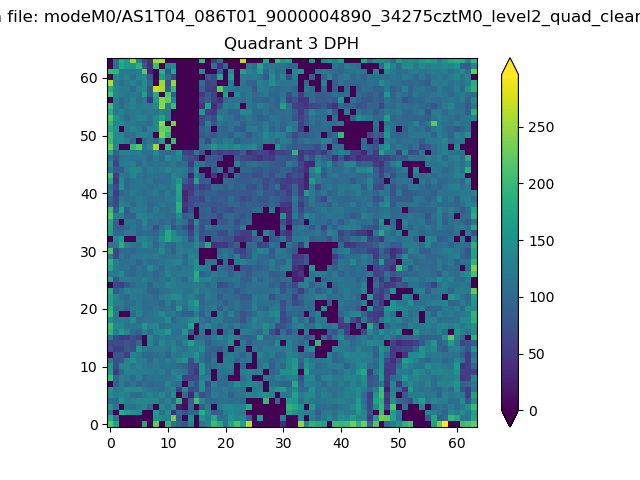 |
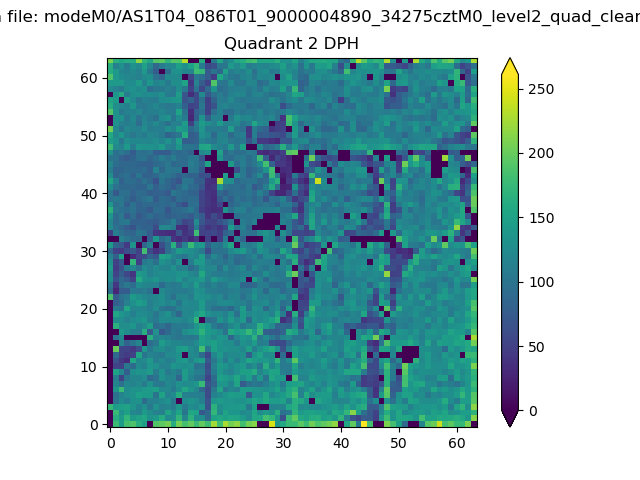 |
Quadrant C |
| Plot type | Count rate plots | Images |
|---|---|---|
| Comparison with Poisson distribution Blue bars denote a histogram of data divided into 1 sec bins. Red curve is a Poisson curve with rate = median count rate of data. |
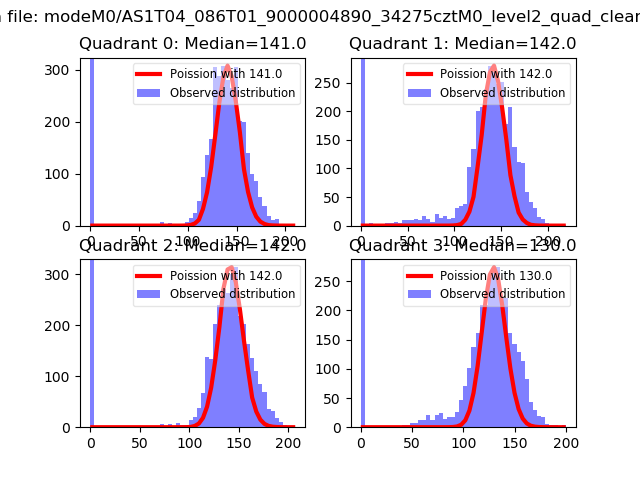 |
 |
| Quadrant-wise count rates Data is divided into 100 sec bins |
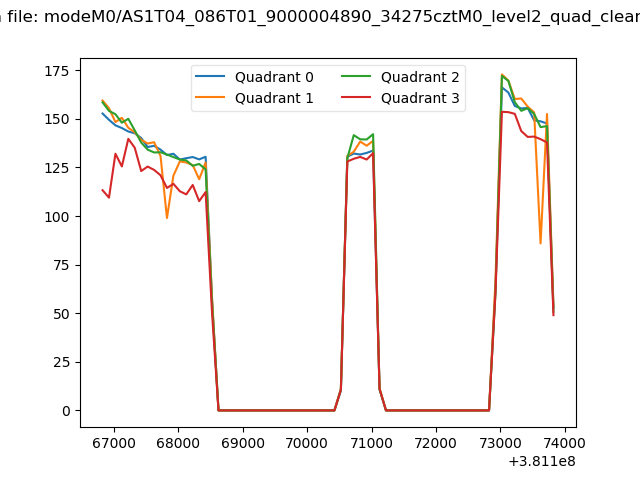 |
|
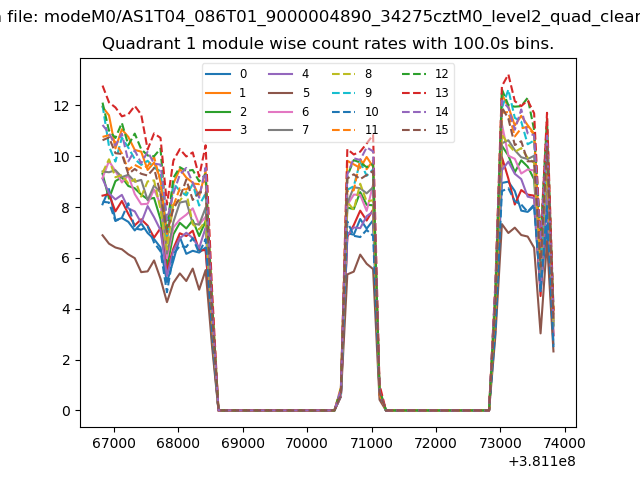
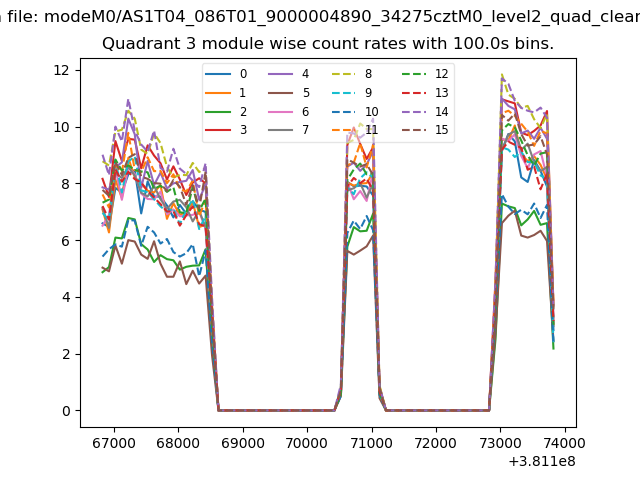
| Module-wise count rates for Quadrant A Data is divided into 100 sec bins |
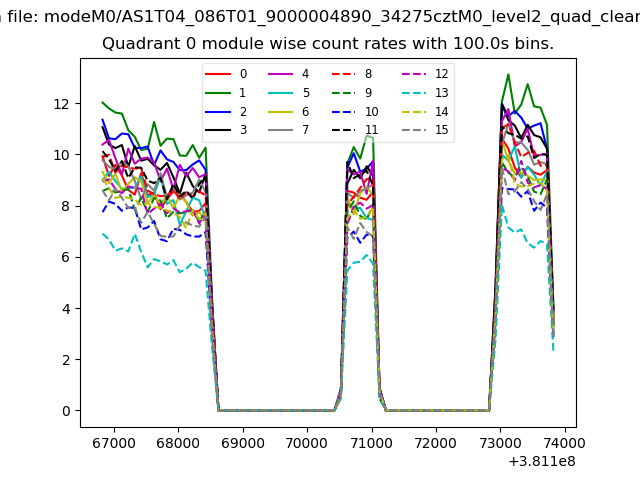 |
 |
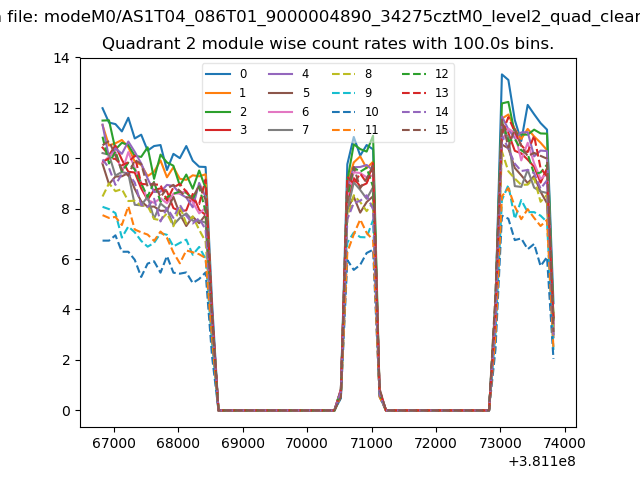
| Module-wise count rates for Quadrant B Data is divided into 100 sec bins |
 |
 |
| Module-wise count rates for Quadrant C Data is divided into 100 sec bins |
 |
 |
| Module-wise count rates for Quadrant D Data is divided into 100 sec bins |
 |
 |
| Parameter | Plot |
|---|---|
| CZT HV Monitor |  |
| D_VDD | 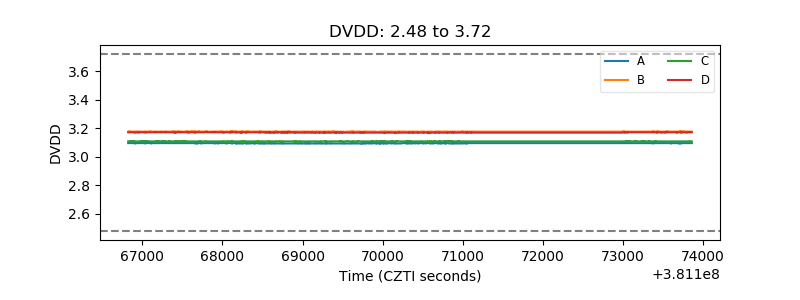 |
| Temperature 1 | 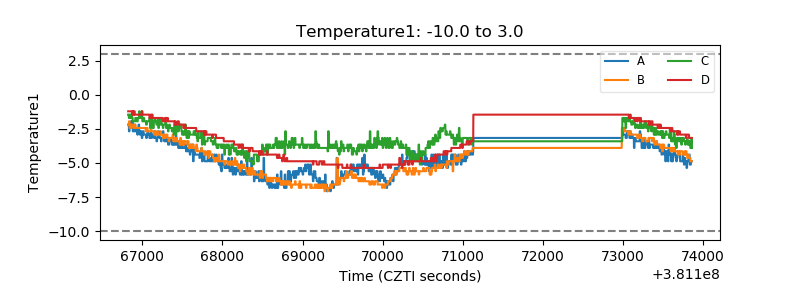 |
| Veto HV Monitor | 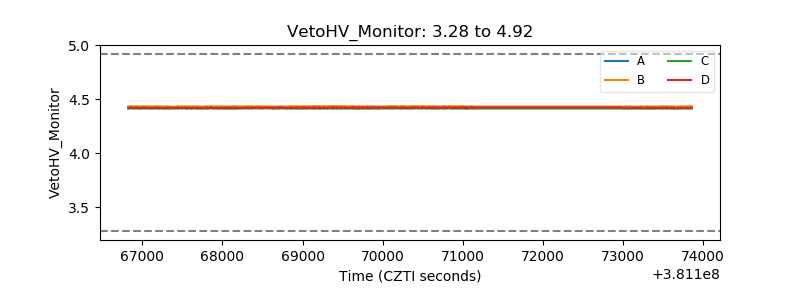 |
| Veto LLD | 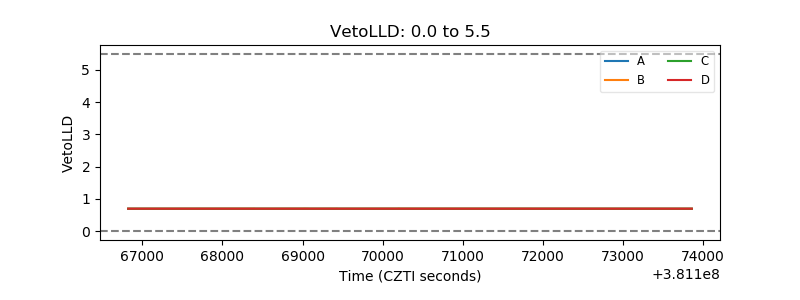 |
| Alpha Counter | 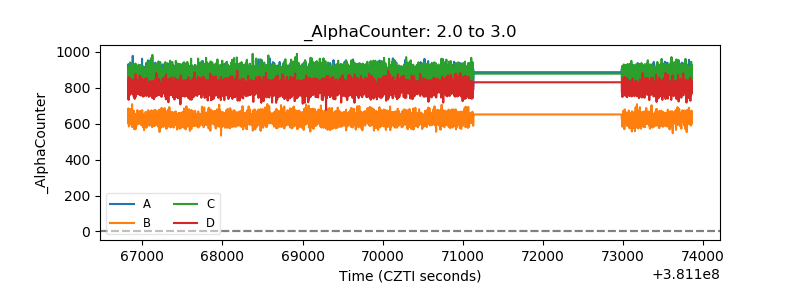 |
| _CPM_Rate | 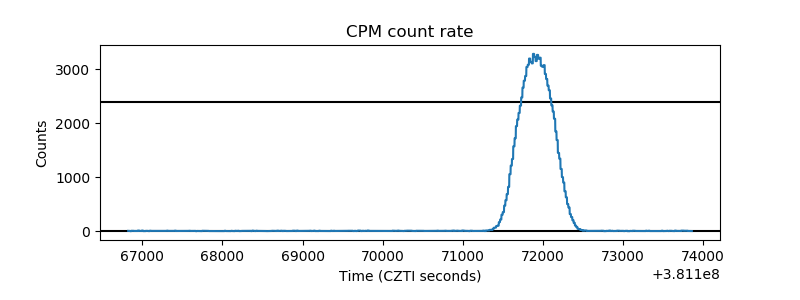 |
| CZT Counter | 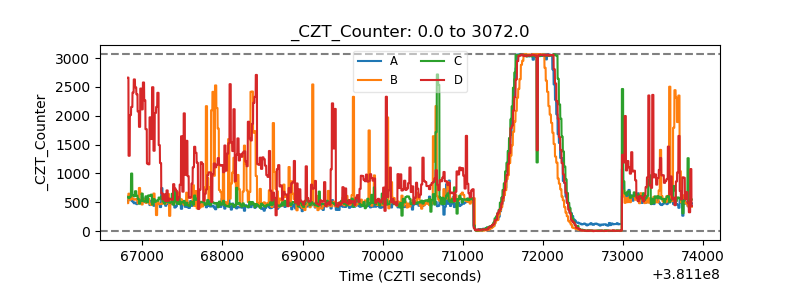 |
| +2.5 Volts monitor |  |
| +5 Volts monitor |  |
| _ROLL_ROT | 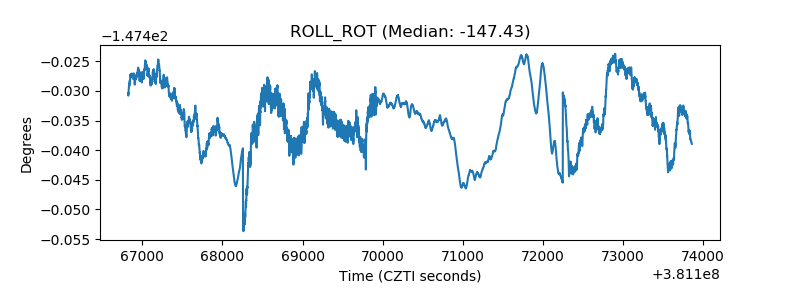 |
| _Roll_DEC | 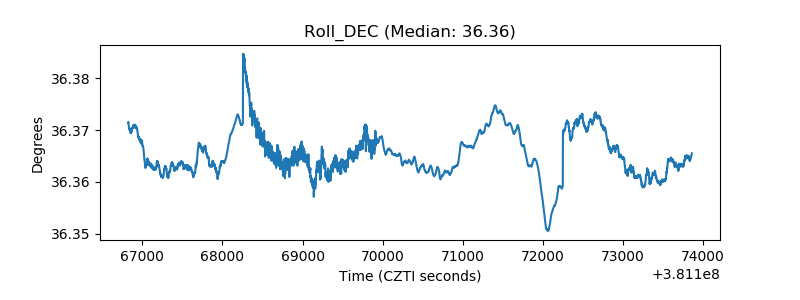 |
| _Roll_RA | 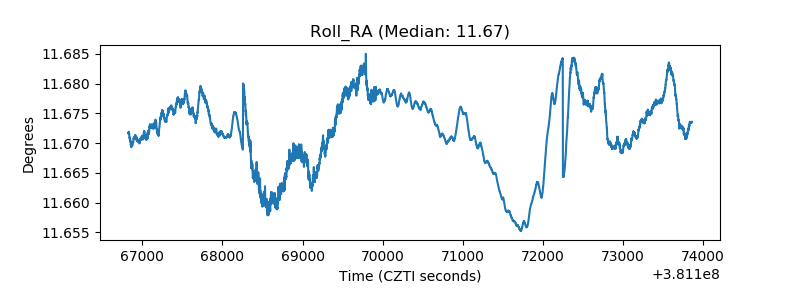 |
| Veto Counter | 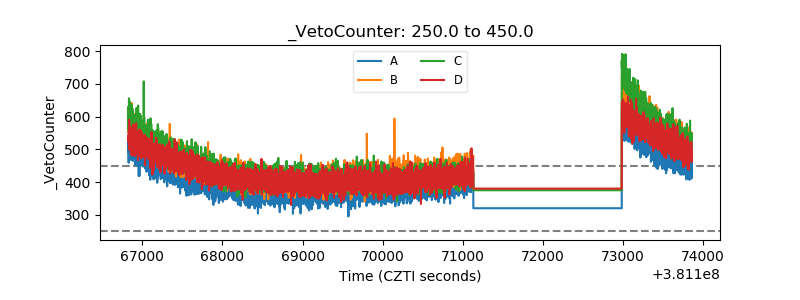 |