| Param | Original file | Final file |
|---|---|---|
| Filename | modeM0/AS1T04_086T01_9000004890_34285cztM0_level2.evt | modeM0/AS1T04_086T01_9000004890_34285cztM0_level2_quad_clean.evt |
| Size (bytes) | 393,004,800 | 71,297,280 |
| Size | 374.8 MB | 68.0 MB |
| Events in quadrant A | 2,031,482 | 464,974 |
| Events in quadrant B | 2,942,605 | 464,682 |
| Events in quadrant C | 2,320,202 | 472,426 |
| Events in quadrant D | 4,299,491 | 437,770 |
| Mode M0 | |||
|---|---|---|---|
| Quadrant | BADHDUFLAG | Total packets | Discarded packets |
| A | 0 | 9108 | 2 |
| B | 0 | 11675 | 1 |
| C | 0 | 9609 | 1 |
| D | 0 | 15888 | 1 |
| Mode SS | |||
|---|---|---|---|
| Quadrant | BADHDUFLAG | Total packets | Discarded packets |
| A | 0 | 92 | 0 |
| B | 0 | 92 | 0 |
| C | 0 | 92 | 0 |
| D | 0 | 92 | 0 |
| Quadrant | Total seconds | Saturated seconds | Saturation percentage |
|---|---|---|---|
| A | 4534 | 4 | 0.088222% |
| B | 4534 | 124 | 2.734892% |
| C | 4534 | 21 | 0.463167% |
| D | 4534 | 155 | 3.418615% |
Noise dominated data is calculated using 1-second bins in cleaned event files. If a bin has >2000 counts, and if more than 50% of those come from <1% of pixels, then it is considered to be noise-dominated and hence unusable.
| Quadrant | # 1 sec bins | Bins with >0 counts | Bins with >2000 counts | High rate bins dominated by noise | Noise dominated (total time) | Noise dominated (detector-on time) | Marked lightcurve |
|---|---|---|---|---|---|---|---|
| A | 4534 | 4534 | 0 | 0 | 0.00% | 0.00% | 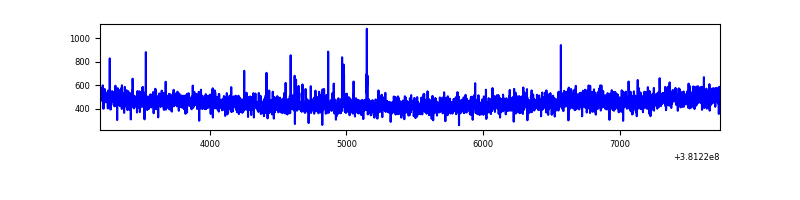 |
| B | 4534 | 4534 | 86 | 86 | 1.90% | 1.90% | 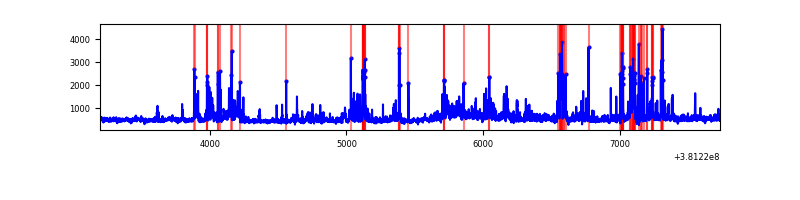 |
| C | 4534 | 4534 | 12 | 12 | 0.26% | 0.26% | 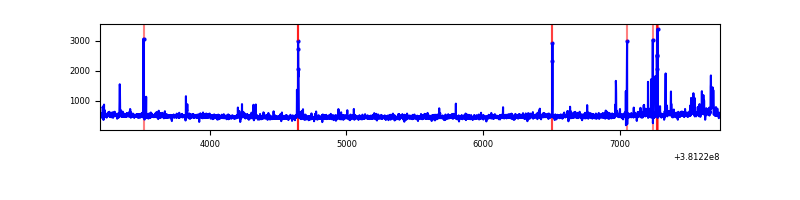 |
| D | 4534 | 4534 | 143 | 143 | 3.15% | 3.15% | 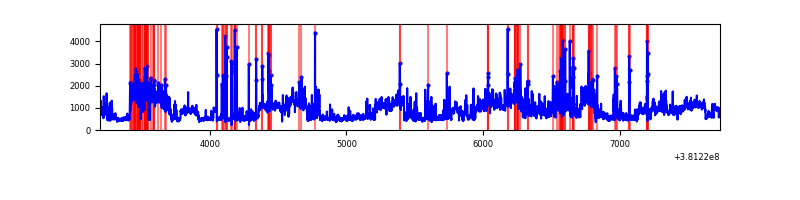 |
Top three noisy pixels from each quadrant. If the there are fewer than three noisy pixels in the level2.evt file, extra rows are filled as -1
| Pixel properties | Quadrant properties | ||||||
|---|---|---|---|---|---|---|---|
| Quadrant | DetID | PixID | Counts | Sigma | Mean | Median | Sigma |
| A | 10 | 83 | 9145 | 82.74 | 516 | 505 | 104.4 |
| A | 13 | 254 | 8658 | 78.08 | 516 | 505 | 104.4 |
| A | 13 | 6 | 6788 | 60.17 | 516 | 505 | 104.4 |
| B | 5 | 172 | 477685 | 4851.17 | 508 | 494 | 98.4 |
| B | 4 | 251 | 204366 | 2072.58 | 508 | 494 | 98.4 |
| B | 0 | 245 | 127911 | 1295.33 | 508 | 494 | 98.4 |
| C | 15 | 214 | 192981 | 1640.25 | 505 | 510 | 117.3 |
| C | 14 | 254 | 71577 | 605.64 | 505 | 510 | 117.3 |
| C | 0 | 10 | 20939 | 174.1 | 505 | 510 | 117.3 |
| D | 8 | 195 | 953294 | 7776.04 | 501 | 488 | 122.5 |
| D | 12 | 235 | 351739 | 2866.63 | 501 | 488 | 122.5 |
| D | 8 | 230 | 335163 | 2731.35 | 501 | 488 | 122.5 |
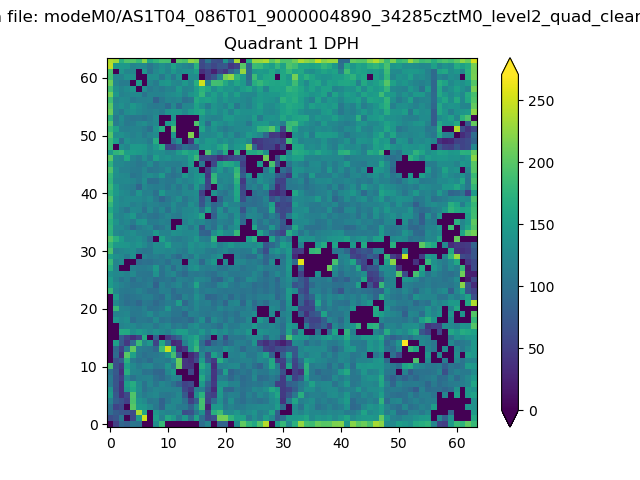
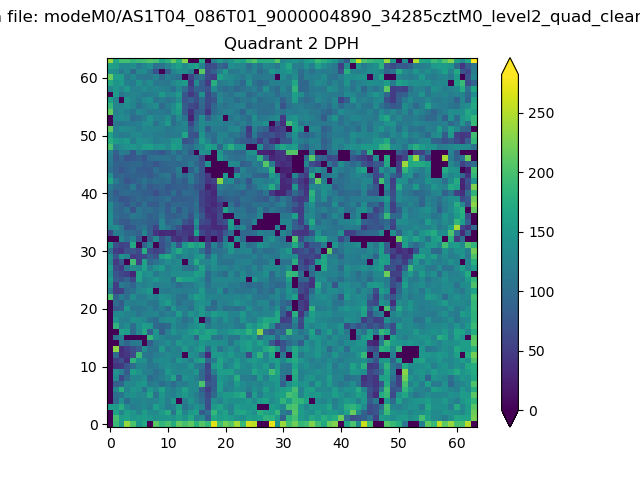
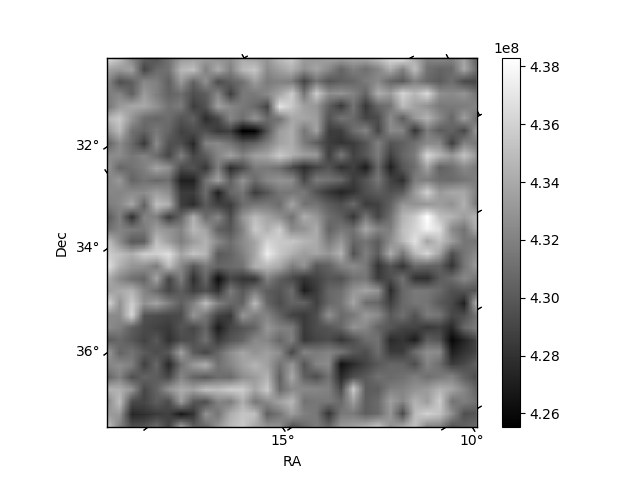
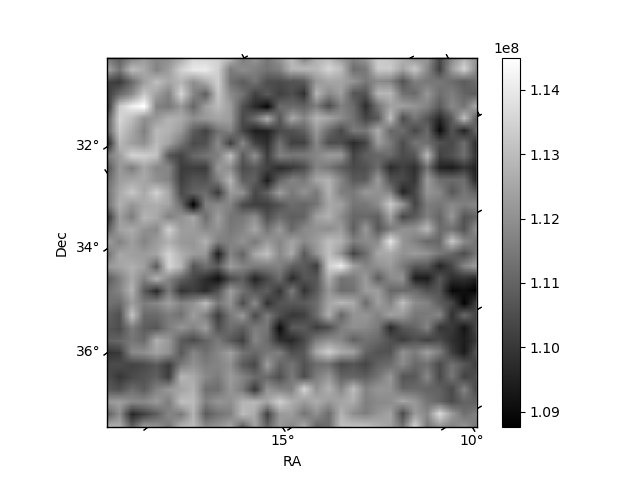
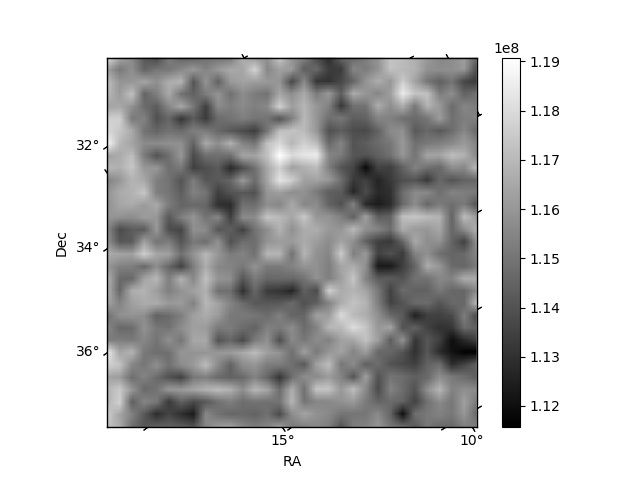
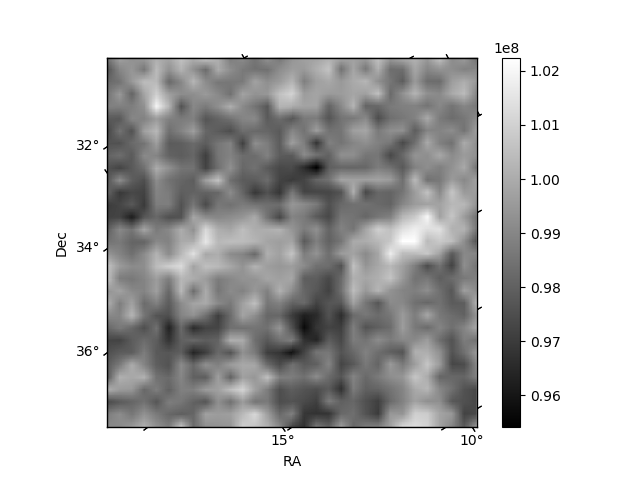
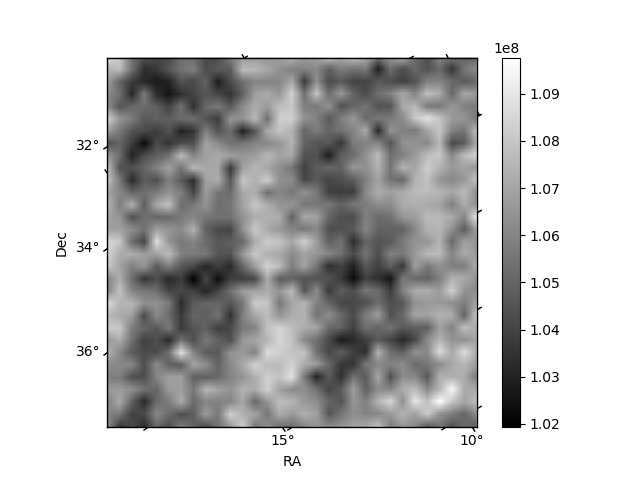
Histogram calculated using DETX and DETY for each event in the final _common_clean file
| Quadrant A |  |
 |
Quadrant B |
|---|---|---|---|
| Quadrant D | 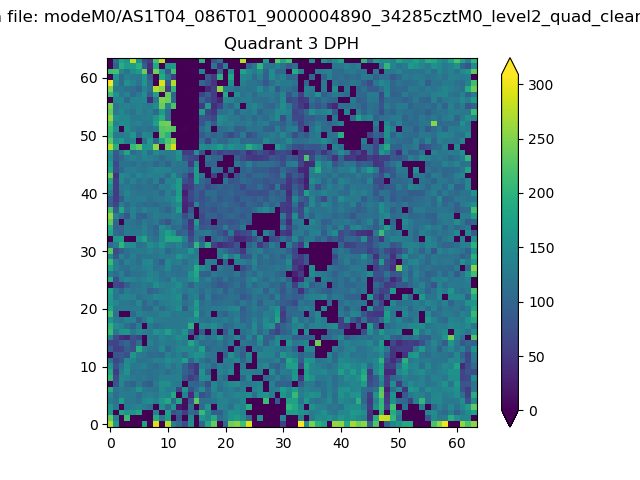 |
 |
Quadrant C |
| Plot type | Count rate plots | Images |
|---|---|---|
| Comparison with Poisson distribution Blue bars denote a histogram of data divided into 1 sec bins. Red curve is a Poisson curve with rate = median count rate of data. |
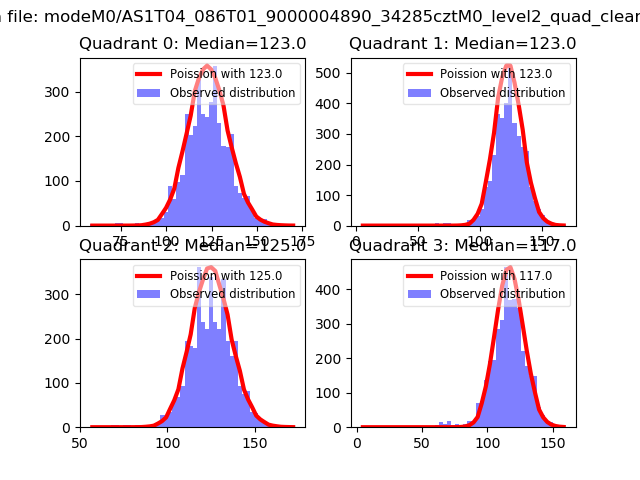 |
 |
| Quadrant-wise count rates Data is divided into 100 sec bins |
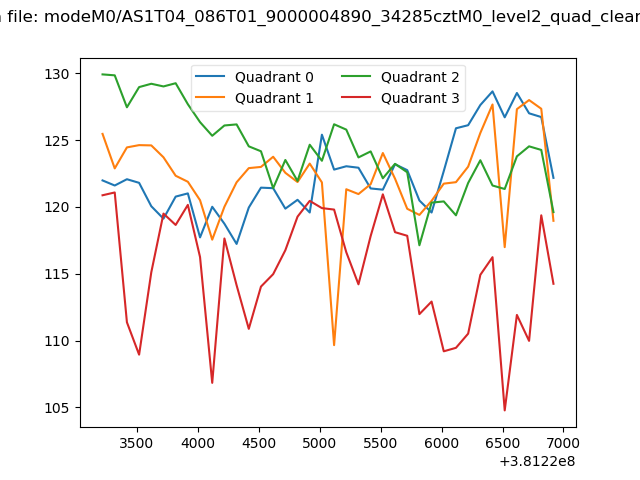 |
|
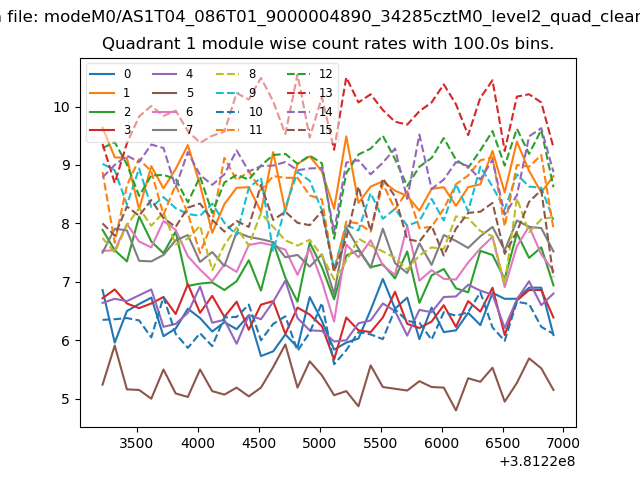
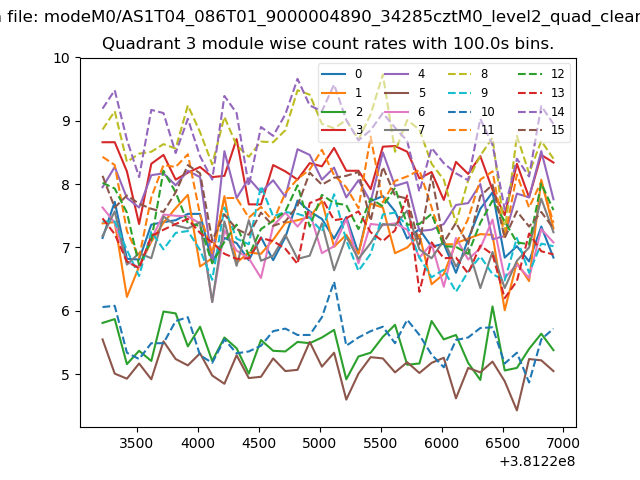
| Module-wise count rates for Quadrant A Data is divided into 100 sec bins |
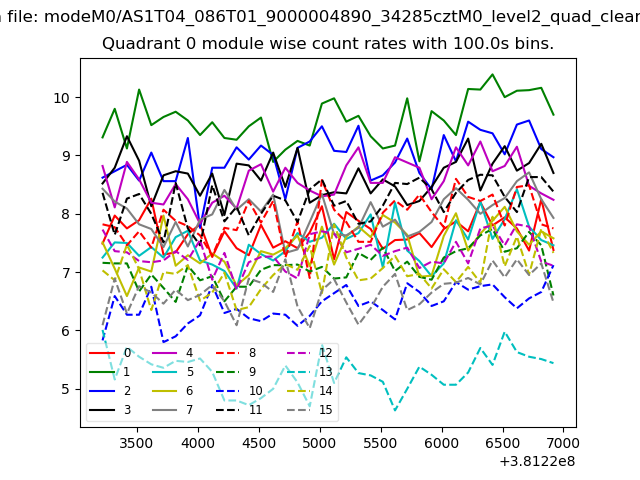 |
 |
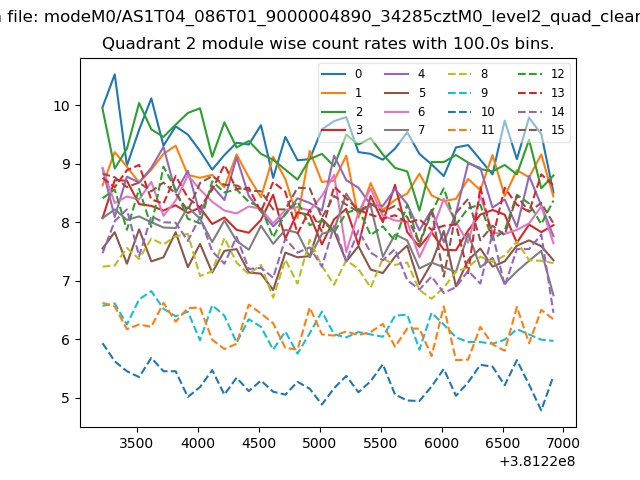
| Module-wise count rates for Quadrant B Data is divided into 100 sec bins |
 |
 |
| Module-wise count rates for Quadrant C Data is divided into 100 sec bins |
 |
 |
| Module-wise count rates for Quadrant D Data is divided into 100 sec bins |
 |
 |
| Parameter | Plot |
|---|---|
| CZT HV Monitor | 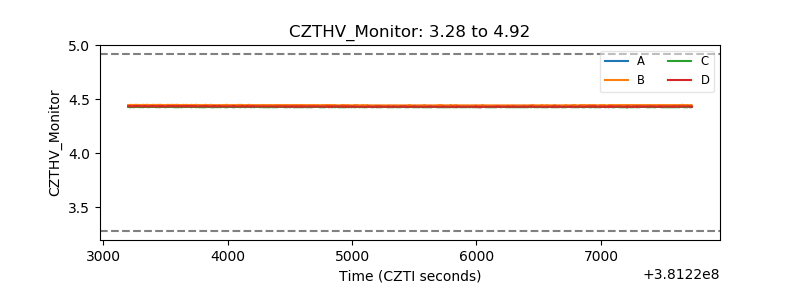 |
| D_VDD | 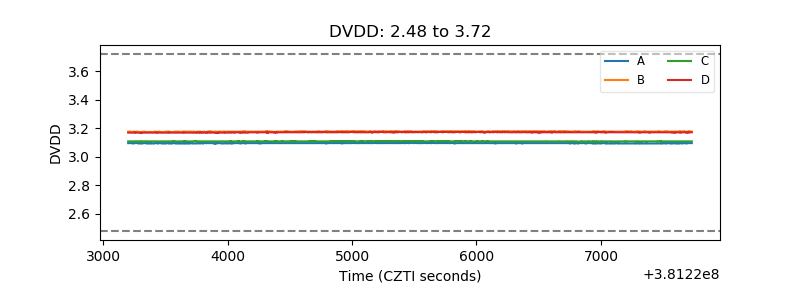 |
| Temperature 1 | 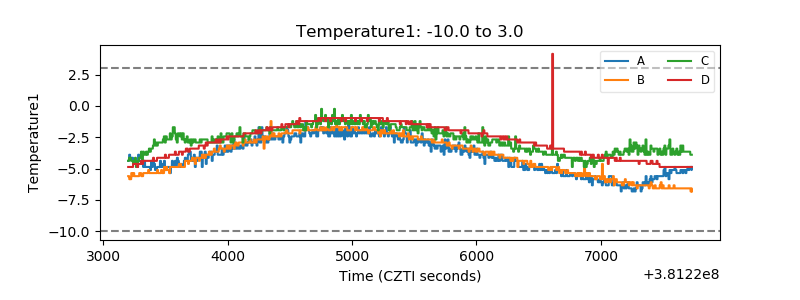 |
| Veto HV Monitor |  |
| Veto LLD | 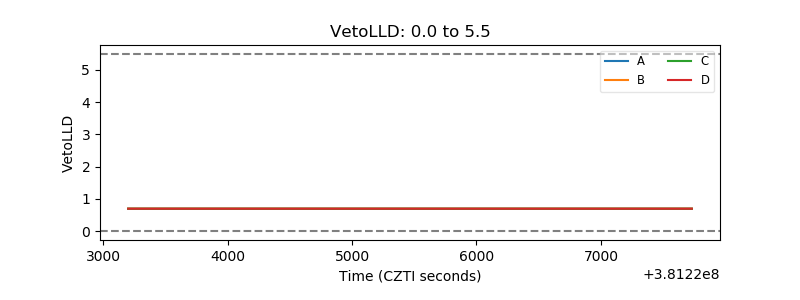 |
| Alpha Counter | 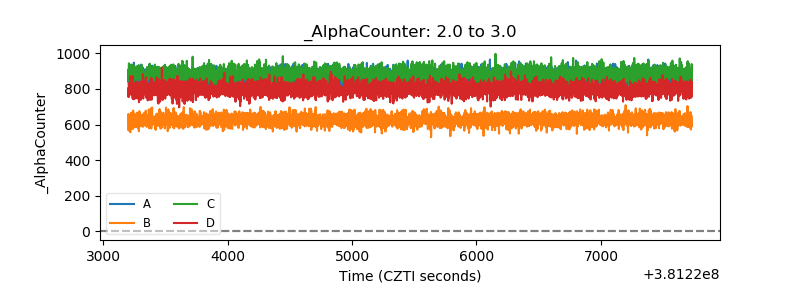 |
| _CPM_Rate |  |
| CZT Counter | 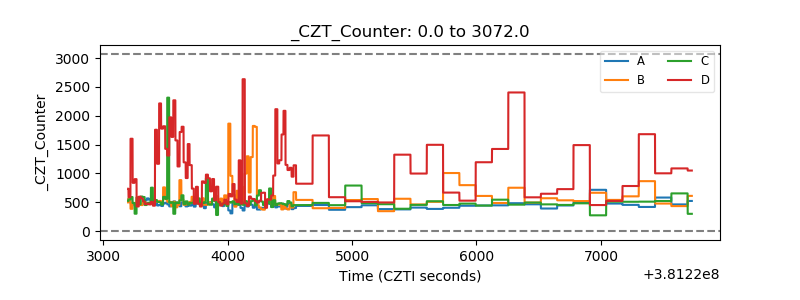 |
| +2.5 Volts monitor |  |
| +5 Volts monitor |  |
| _ROLL_ROT | 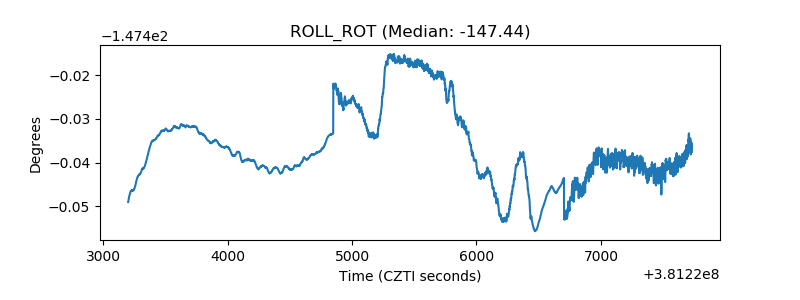 |
| _Roll_DEC |  |
| _Roll_RA | 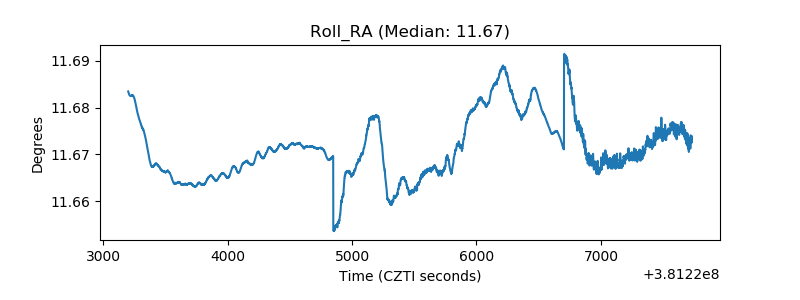 |
| Veto Counter | 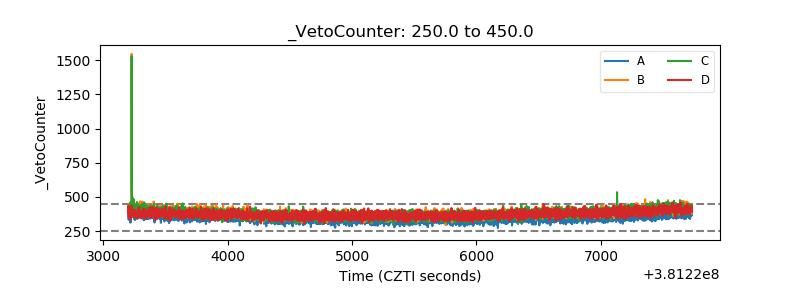 |