| Param | Original file | Final file |
|---|---|---|
| Filename | modeM0/AS1A11_047T07_9000004892cztM0_level2.fits | modeM0/AS1A11_047T07_9000004892cztM0_level2_quad_clean.evt |
| Size (bytes) | 245,592,000 | 233,242,560 |
| Size | 234.2 MB | 222.4 MB |
| Events in quadrant A | 1,540,034 | 1,421,206 |
| Events in quadrant B | 1,452,422 | 1,393,423 |
| Events in quadrant C | 1,539,734 | 1,391,790 |
| Events in quadrant D | 1,289,574 | 1,240,112 |
| Mode M0 | |||
|---|---|---|---|
| Quadrant | BADHDUFLAG | Total packets | Discarded packets |
| A | 0 | 49864 | 0 |
| B | 0 | 64666 | 0 |
| C | 0 | 52010 | 0 |
| D | 0 | 75495 | 0 |
| Mode M9 | |||
|---|---|---|---|
| Quadrant | BADHDUFLAG | Total packets | Discarded packets |
| A | 0 | 119 | 0 |
| B | 0 | 119 | 0 |
| C | 0 | 119 | 0 |
| D | 0 | 119 | 0 |
| Mode SS | |||
|---|---|---|---|
| Quadrant | BADHDUFLAG | Total packets | Discarded packets |
| A | 0 | 484 | 0 |
| B | 0 | 484 | 0 |
| C | 0 | 484 | 0 |
| D | 0 | 484 | 0 |
| Quadrant | Total seconds | Saturated seconds | Saturation percentage |
|---|---|---|---|
| A | 23477 | 53 | 0.225753% |
| B | 23477 | 923 | 3.931507% |
| C | 23477 | 132 | 0.562252% |
| D | 23477 | 948 | 4.037995% |
Noise dominated data is calculated using 1-second bins in cleaned event files. If a bin has >2000 counts, and if more than 50% of those come from <1% of pixels, then it is considered to be noise-dominated and hence unusable.
| Quadrant | # 1 sec bins | Bins with >0 counts | Bins with >2000 counts | High rate bins dominated by noise | Noise dominated (total time) | Noise dominated (detector-on time) | Marked lightcurve |
|---|---|---|---|---|---|---|---|
| A | 35464 | 23477 | 0 | 0 | 0.00% | 0.00% | 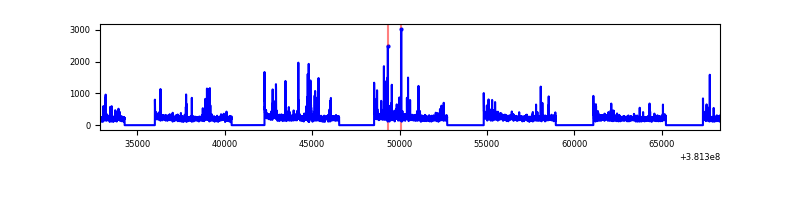 |
| B | 35464 | 23466 | 0 | 0 | 0.00% | 0.00% | 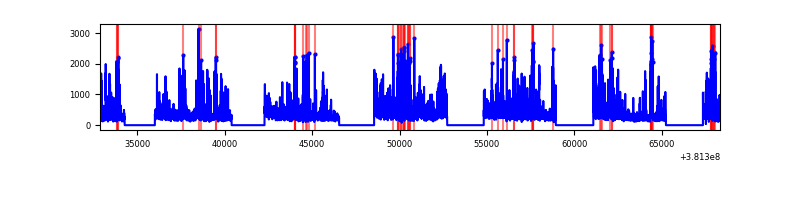 |
| C | 35464 | 23477 | 0 | 0 | 0.00% | 0.00% | 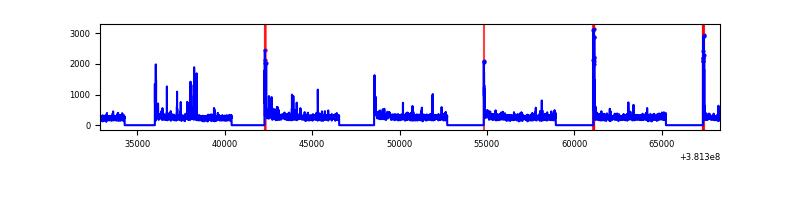 |
| D | 35464 | 23463 | 0 | 0 | 0.00% | 0.00% | 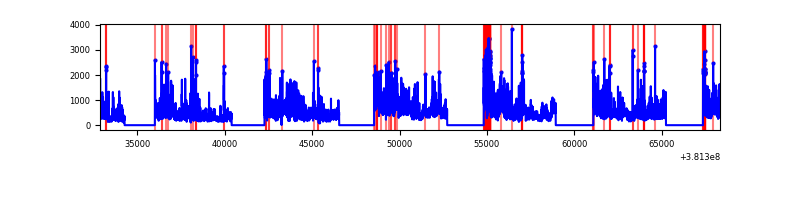 |
Top three noisy pixels from each quadrant. If the there are fewer than three noisy pixels in the level2.evt file, extra rows are filled as -1
| Pixel properties | Quadrant properties | ||||||
|---|---|---|---|---|---|---|---|
| Quadrant | DetID | PixID | Counts | Sigma | Mean | Median | Sigma |
| A | 7 | 110 | 1274 | 9.12 | 402 | 383 | 97.7 |
| A | 9 | 19 | 1271 | 9.09 | 402 | 383 | 97.7 |
| A | 0 | 29 | 1221 | 8.58 | 402 | 383 | 97.7 |
| B | 2 | 9 | 1244 | 11.24 | 385 | 369 | 77.9 |
| B | 3 | 80 | 1124 | 9.7 | 385 | 369 | 77.9 |
| B | 2 | 8 | 1045 | 8.68 | 385 | 369 | 77.9 |
| C | 1 | 81 | 1296 | 8.71 | 408 | 387 | 104.4 |
| C | 1 | 80 | 1263 | 8.39 | 408 | 387 | 104.4 |
| C | 3 | 202 | 1180 | 7.59 | 408 | 387 | 104.4 |
| D | 6 | 231 | 978 | 6.5 | 370 | 340 | 98.2 |
| D | 10 | 189 | 951 | 6.22 | 370 | 340 | 98.2 |
| D | 6 | 38 | 949 | 6.2 | 370 | 340 | 98.2 |
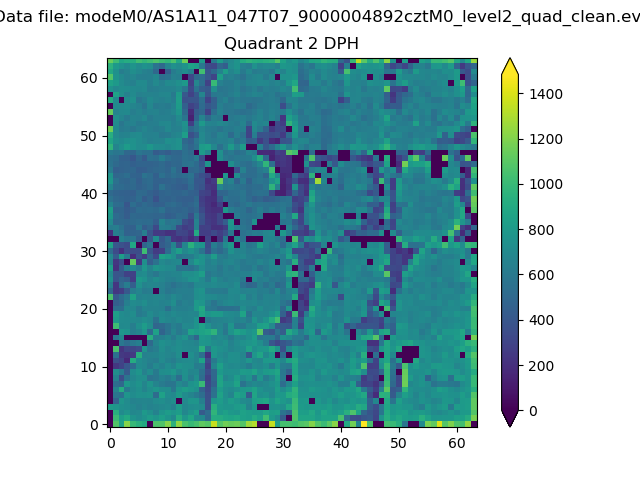
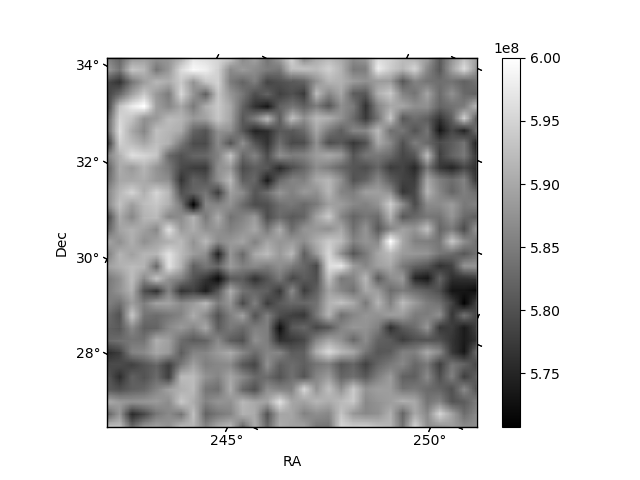
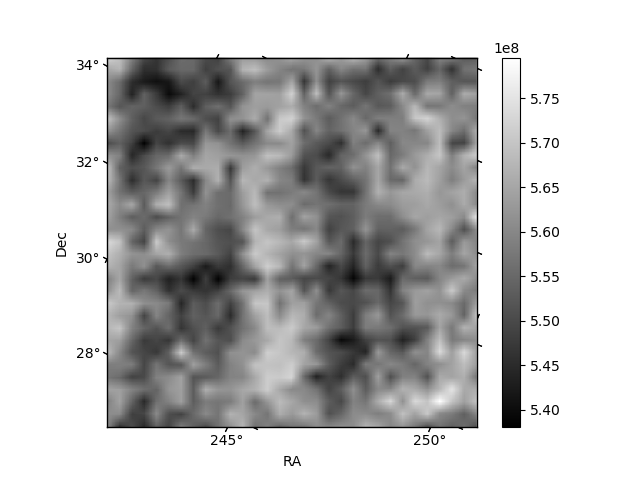
Histogram calculated using DETX and DETY for each event in the final _common_clean file
| Quadrant A | 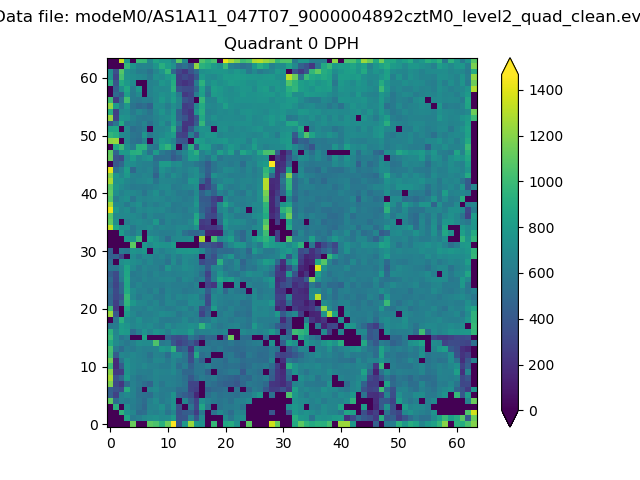 |
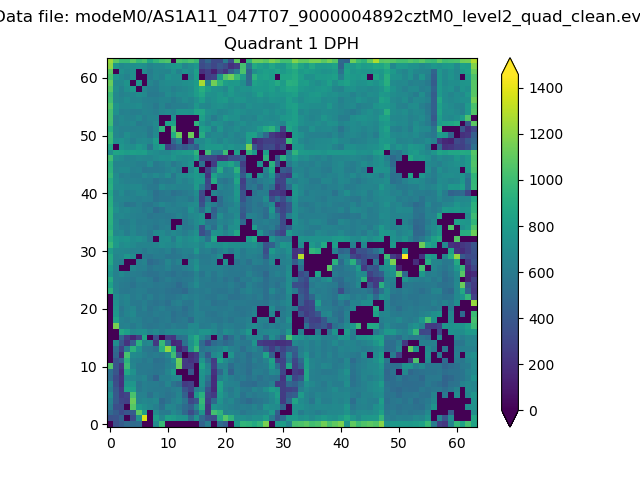 |
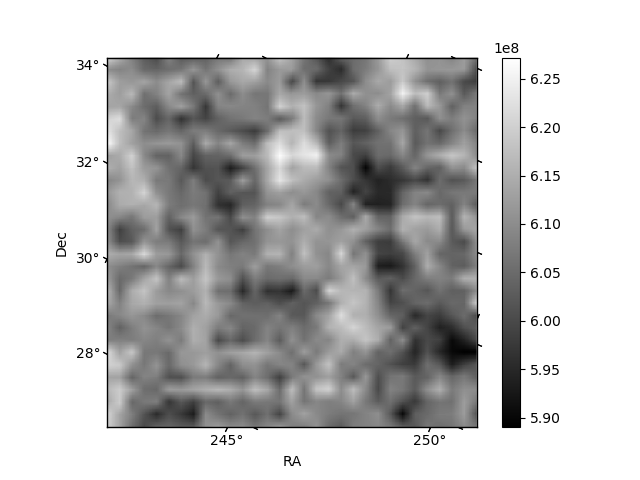
Quadrant B |
|---|---|---|---|
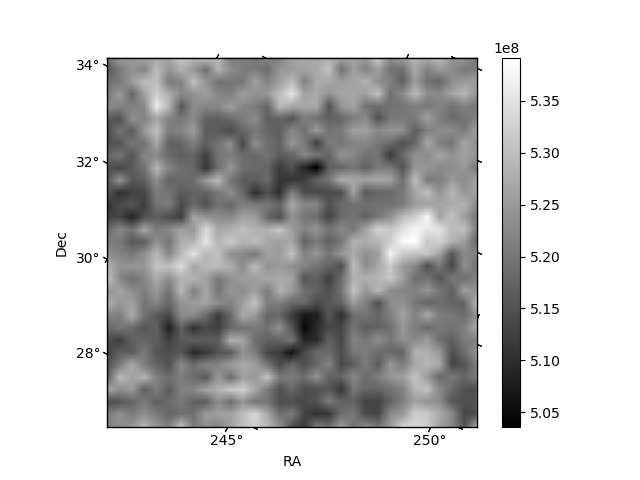
| Quadrant D | 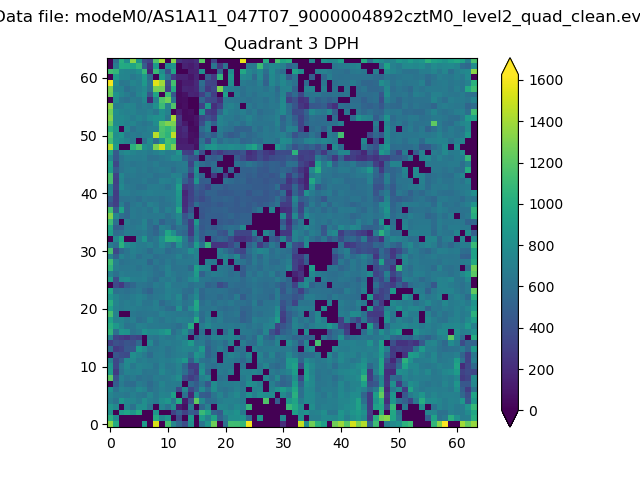 |
 |
Quadrant C |
| Plot type | Count rate plots | Images |
|---|---|---|
| Comparison with Poisson distribution Blue bars denote a histogram of data divided into 1 sec bins. Red curve is a Poisson curve with rate = median count rate of data. |
 |
 |
| Quadrant-wise count rates Data is divided into 100 sec bins |
 |
|
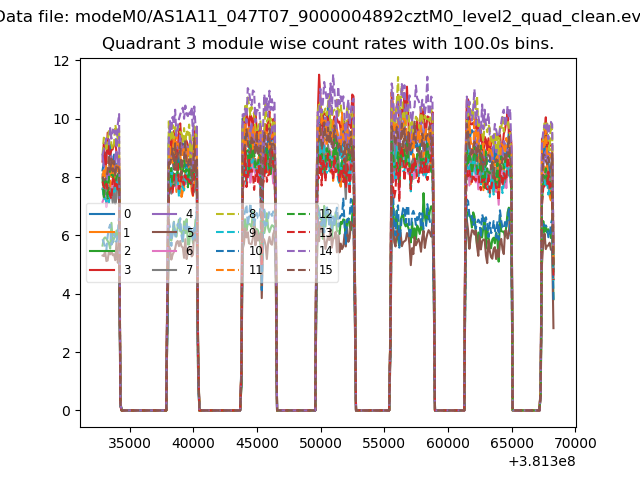
| Module-wise count rates for Quadrant A Data is divided into 100 sec bins |
 |
 |
| Module-wise count rates for Quadrant B Data is divided into 100 sec bins |
 |
 |
| Module-wise count rates for Quadrant C Data is divided into 100 sec bins |
 |
 |
| Module-wise count rates for Quadrant D Data is divided into 100 sec bins |
 |
 |
| Parameter | Plot |
|---|---|
| CZT HV Monitor | 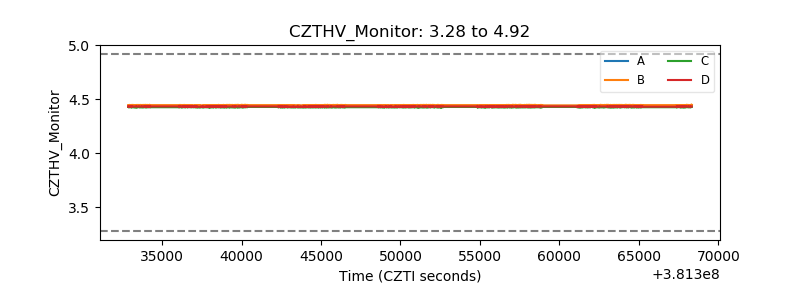 |
| D_VDD | 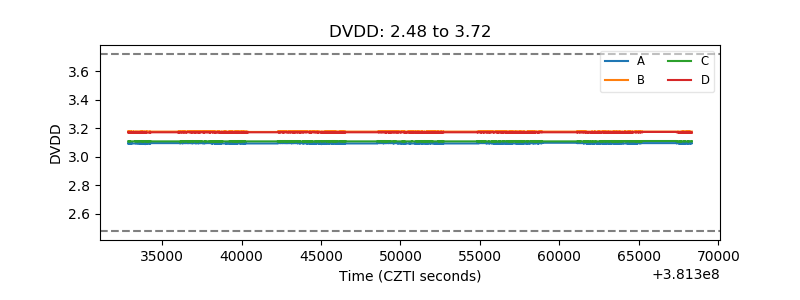 |
| Temperature 1 | 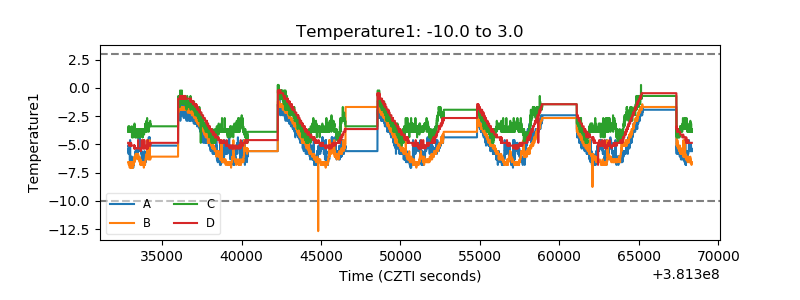 |
| Veto HV Monitor |  |
| Veto LLD |  |
| Alpha Counter |  |
| _CPM_Rate | 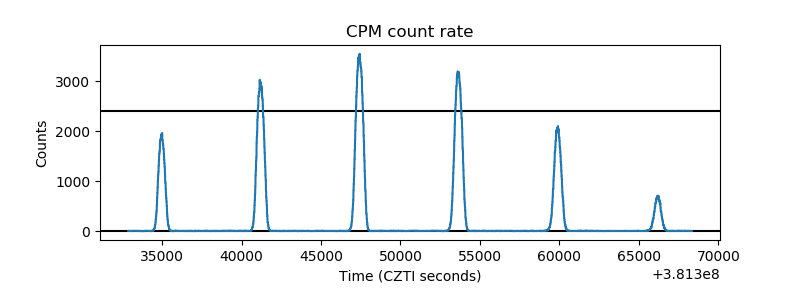 |
| CZT Counter | 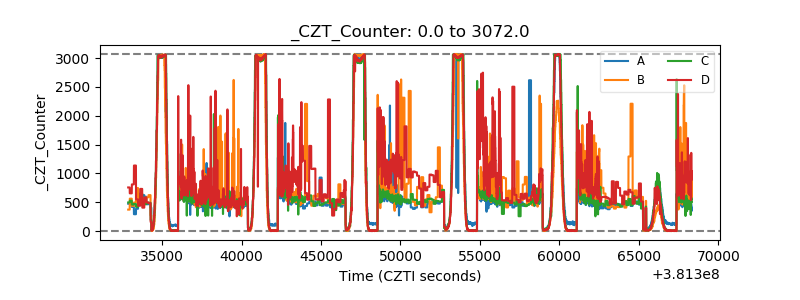 |
| +2.5 Volts monitor |  |
| +5 Volts monitor |  |
| _ROLL_ROT |  |
| _Roll_DEC | 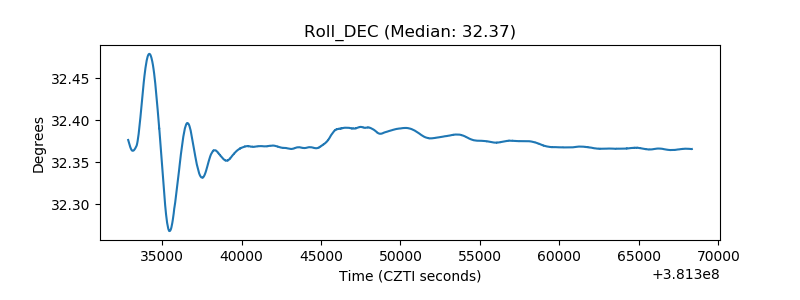 |
| _Roll_RA | 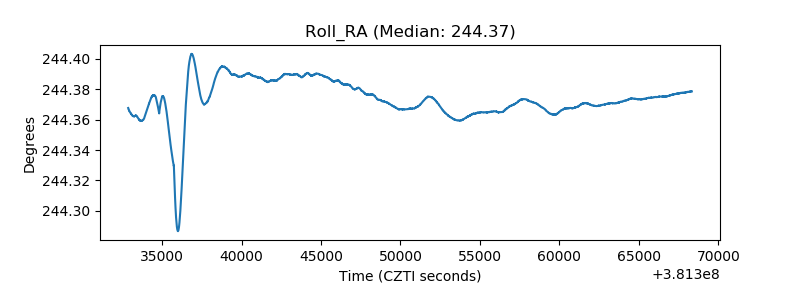 |
| Veto Counter | 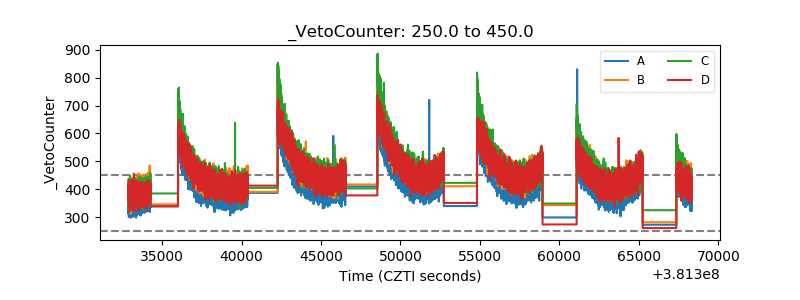 |