| Param | Original file | Final file |
|---|---|---|
| Filename | modeM0/AS1A11_047T07_9000004892_34309cztM0_level2.evt | modeM0/AS1A11_047T07_9000004892_34309cztM0_level2_quad_clean.evt |
| Size (bytes) | 97,966,080 | 19,491,840 |
| Size | 93.4 MB | 18.6 MB |
| Events in quadrant A | 481,937 | 130,957 |
| Events in quadrant B | 826,303 | 125,981 |
| Events in quadrant C | 597,763 | 133,201 |
| Events in quadrant D | 991,564 | 124,100 |
| Mode M0 | |||
|---|---|---|---|
| Quadrant | BADHDUFLAG | Total packets | Discarded packets |
| A | 0 | 2031 | 1 |
| B | 0 | 3099 | 1 |
| C | 0 | 2309 | 1 |
| D | 0 | 3672 | 1 |
| Mode M9 | |||
|---|---|---|---|
| Quadrant | BADHDUFLAG | Total packets | Discarded packets |
| A | 0 | 13 | 0 |
| B | 0 | 13 | 0 |
| C | 0 | 13 | 0 |
| D | 0 | 14 | 0 |
| Mode SS | |||
|---|---|---|---|
| Quadrant | BADHDUFLAG | Total packets | Discarded packets |
| A | 0 | 20 | 0 |
| B | 0 | 20 | 0 |
| C | 0 | 20 | 0 |
| D | 0 | 20 | 0 |
| Quadrant | Total seconds | Saturated seconds | Saturation percentage |
|---|---|---|---|
| A | 976 | 4 | 0.409836% |
| B | 976 | 111 | 11.372951% |
| C | 976 | 30 | 3.073770% |
| D | 976 | 47 | 4.815574% |
Noise dominated data is calculated using 1-second bins in cleaned event files. If a bin has >2000 counts, and if more than 50% of those come from <1% of pixels, then it is considered to be noise-dominated and hence unusable.
| Quadrant | # 1 sec bins | Bins with >0 counts | Bins with >2000 counts | High rate bins dominated by noise | Noise dominated (total time) | Noise dominated (detector-on time) | Marked lightcurve |
|---|---|---|---|---|---|---|---|
| A | 976 | 976 | 1 | 1 | 0.10% | 0.10% | 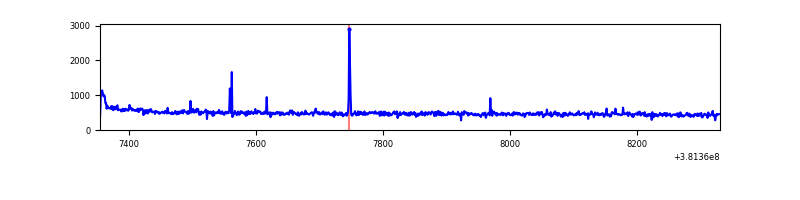 |
| B | 976 | 976 | 71 | 71 | 7.27% | 7.27% | 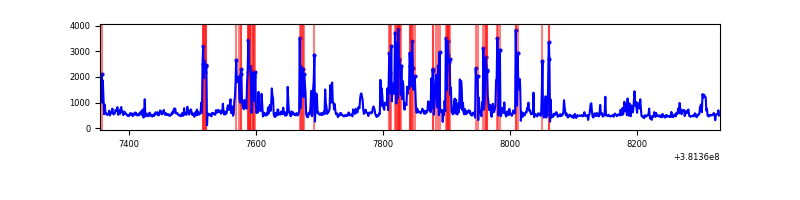 |
| C | 976 | 976 | 25 | 25 | 2.56% | 2.56% | 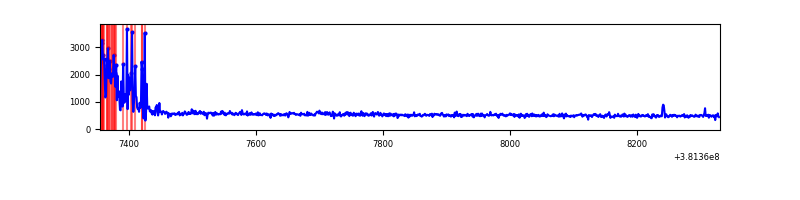 |
| D | 976 | 976 | 34 | 34 | 3.48% | 3.48% | 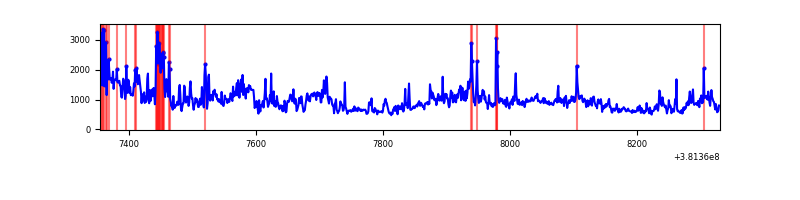 |
Top three noisy pixels from each quadrant. If the there are fewer than three noisy pixels in the level2.evt file, extra rows are filled as -1
| Pixel properties | Quadrant properties | ||||||
|---|---|---|---|---|---|---|---|
| Quadrant | DetID | PixID | Counts | Sigma | Mean | Median | Sigma |
| A | 10 | 83 | 12608 | 483.34 | 117 | 115 | 25.8 |
| A | 9 | 143 | 8215 | 313.38 | 117 | 115 | 25.8 |
| A | 13 | 6 | 4424 | 166.71 | 117 | 115 | 25.8 |
| B | 4 | 171 | 181530 | 7439.02 | 113 | 110 | 24.4 |
| B | 5 | 255 | 78707 | 3222.82 | 113 | 110 | 24.4 |
| B | 5 | 172 | 49943 | 2043.37 | 113 | 110 | 24.4 |
| C | 0 | 10 | 87945 | 3017.18 | 117 | 118 | 29.1 |
| C | 15 | 214 | 44363 | 1519.98 | 117 | 118 | 29.1 |
| C | 14 | 67 | 3126 | 103.34 | 117 | 118 | 29.1 |
| D | 8 | 195 | 140285 | 4689.17 | 112 | 109 | 29.9 |
| D | 12 | 227 | 139044 | 4647.66 | 112 | 109 | 29.9 |
| D | 12 | 235 | 125028 | 4178.8 | 112 | 109 | 29.9 |
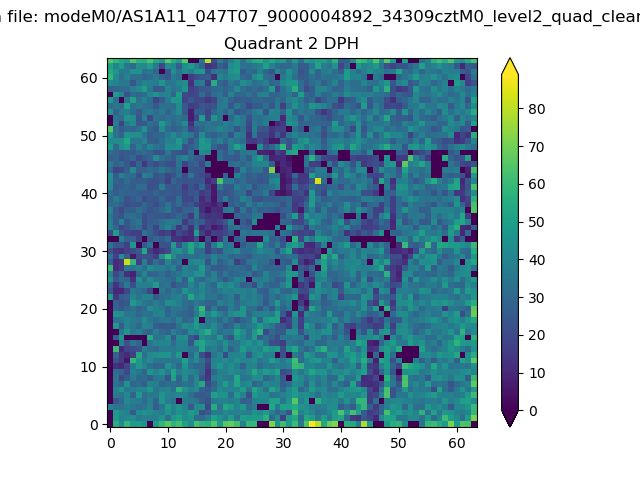
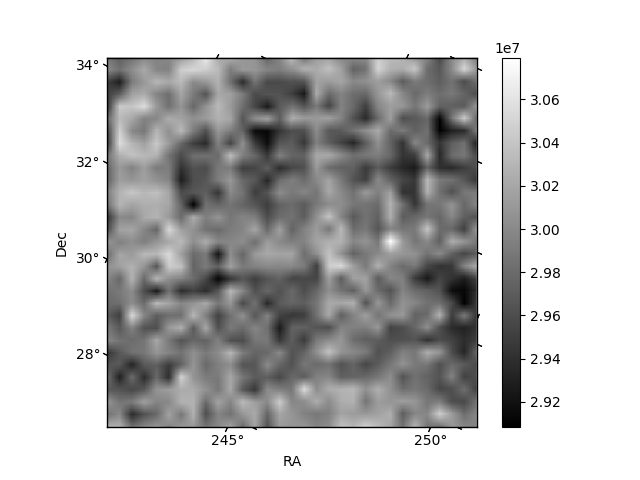
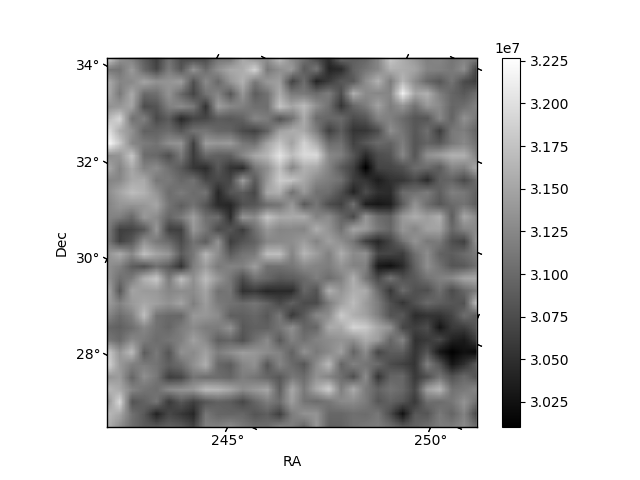
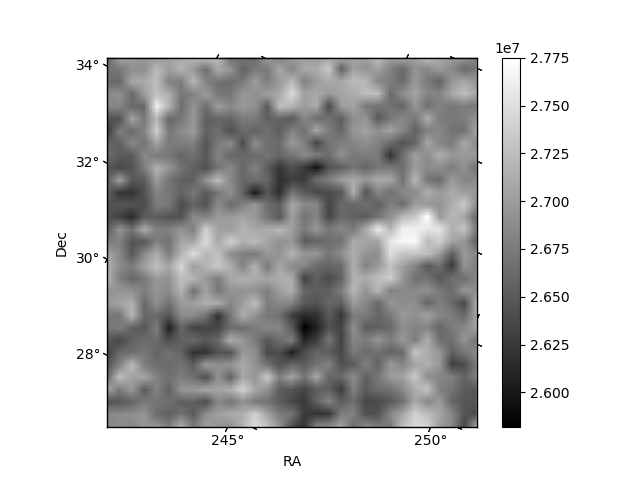
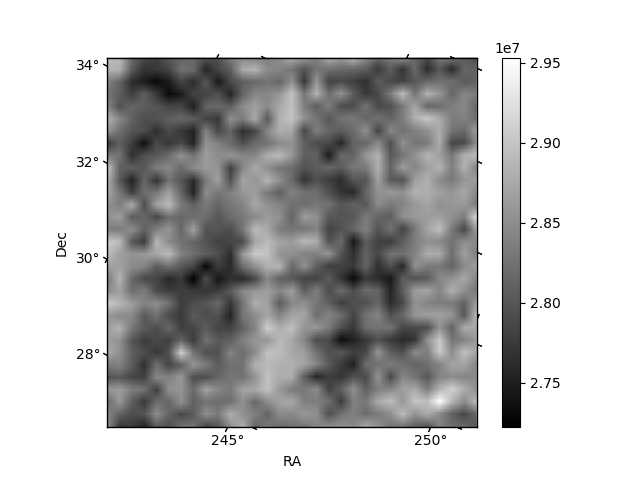
Histogram calculated using DETX and DETY for each event in the final _common_clean file
| Quadrant A |  |
 |
Quadrant B |
|---|---|---|---|
| Quadrant D |  |
 |
Quadrant C |
| Plot type | Count rate plots | Images |
|---|---|---|
| Comparison with Poisson distribution Blue bars denote a histogram of data divided into 1 sec bins. Red curve is a Poisson curve with rate = median count rate of data. |
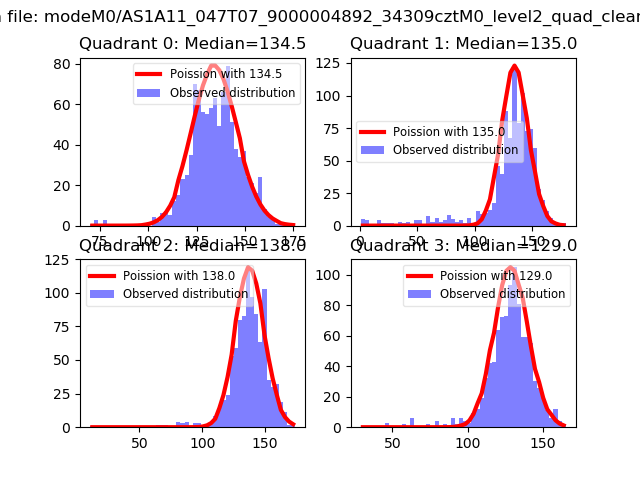 |
 |
| Quadrant-wise count rates Data is divided into 100 sec bins |
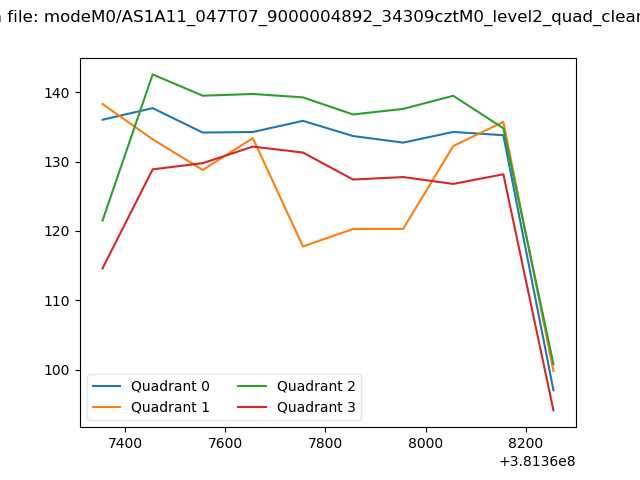 |
|
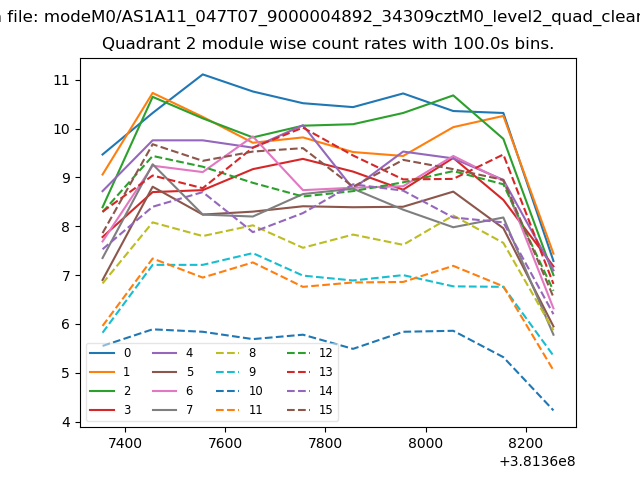
| Module-wise count rates for Quadrant A Data is divided into 100 sec bins |
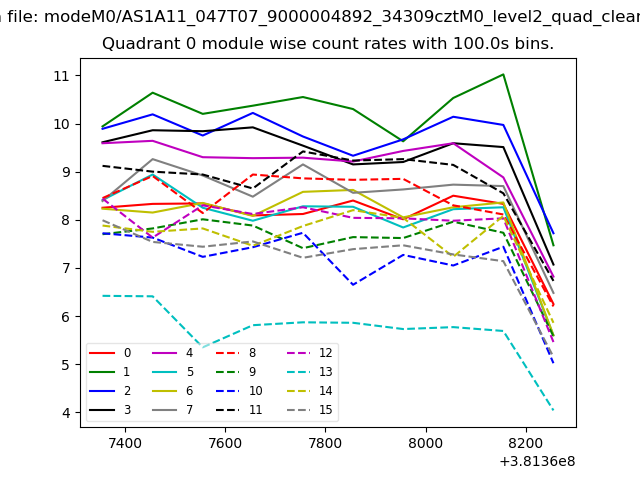 |
 |
| Module-wise count rates for Quadrant B Data is divided into 100 sec bins |
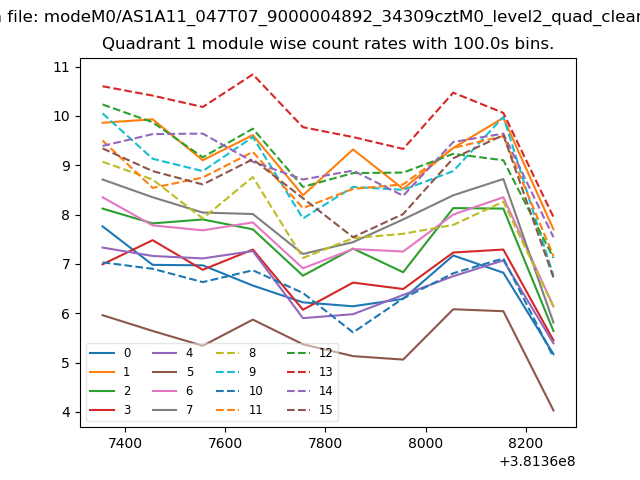 |
 |
| Module-wise count rates for Quadrant C Data is divided into 100 sec bins |
 |
 |
| Module-wise count rates for Quadrant D Data is divided into 100 sec bins |
 |
 |
| Parameter | Plot |
|---|---|
| CZT HV Monitor | 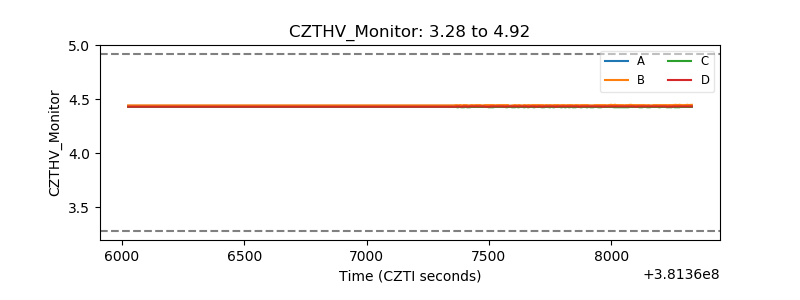 |
| D_VDD | 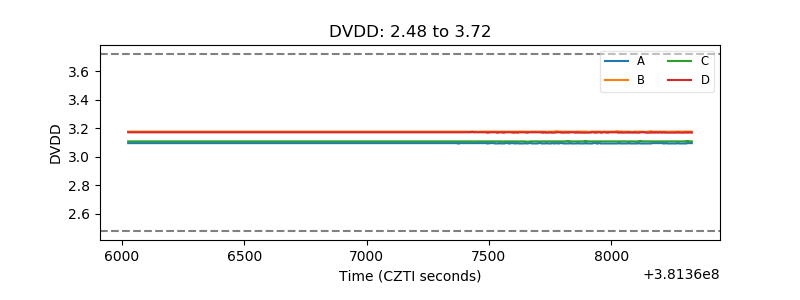 |
| Temperature 1 | 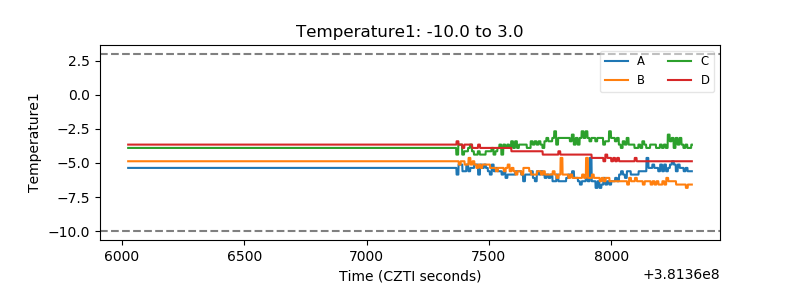 |
| Veto HV Monitor | 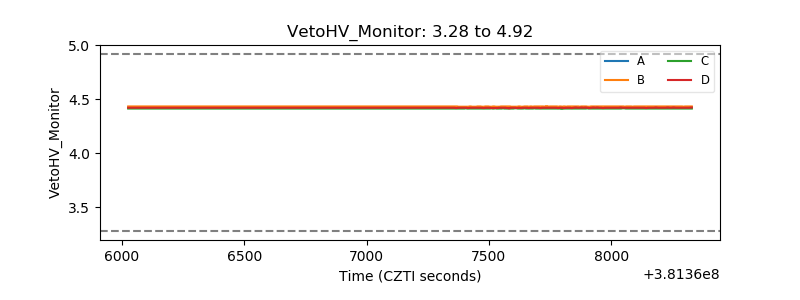 |
| Veto LLD |  |
| Alpha Counter | 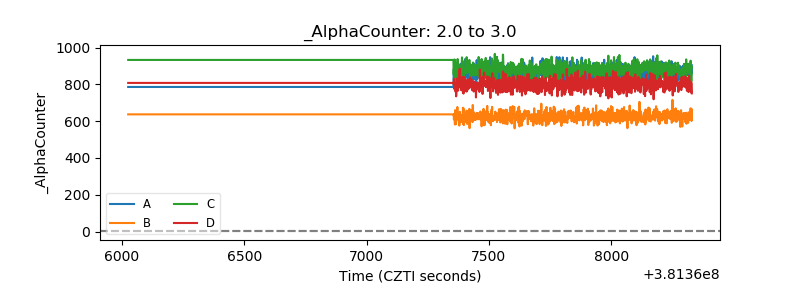 |
| _CPM_Rate | 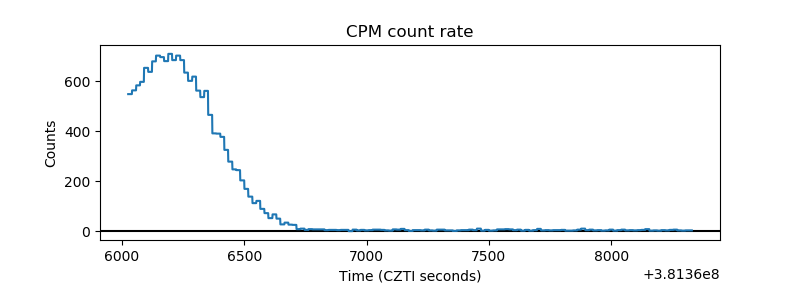 |
| CZT Counter | 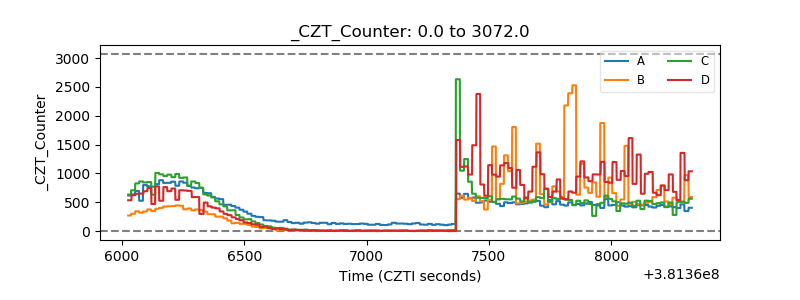 |
| +2.5 Volts monitor | 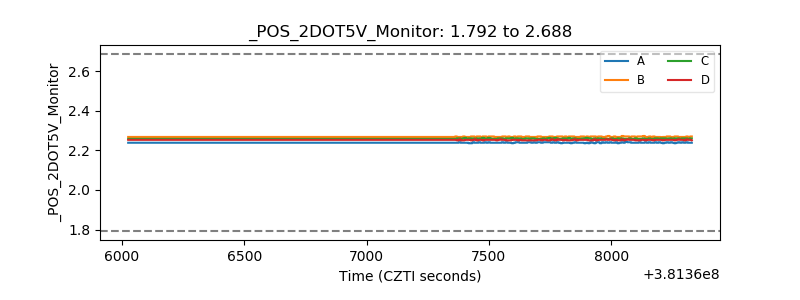 |
| +5 Volts monitor |  |
| _ROLL_ROT | 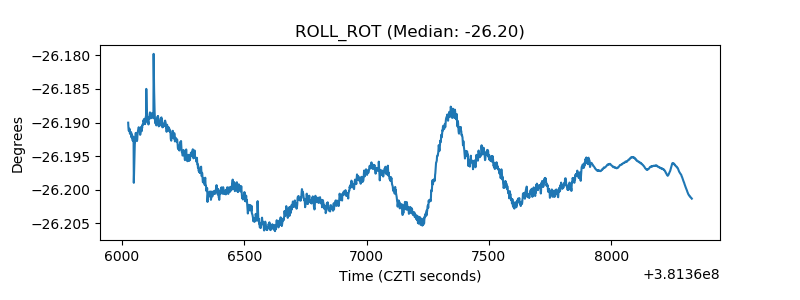 |
| _Roll_DEC | 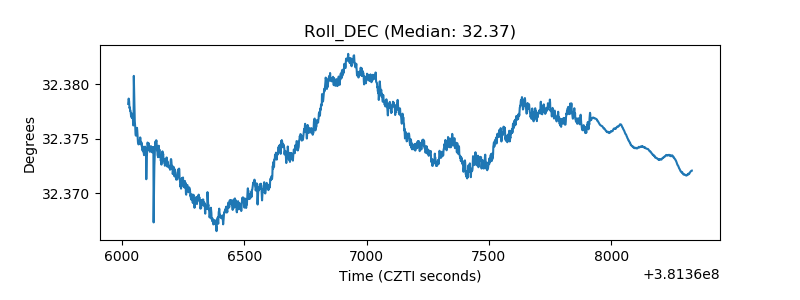 |
| _Roll_RA | 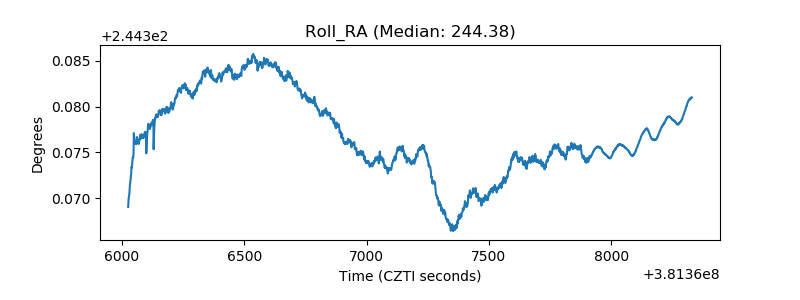 |
| Veto Counter | 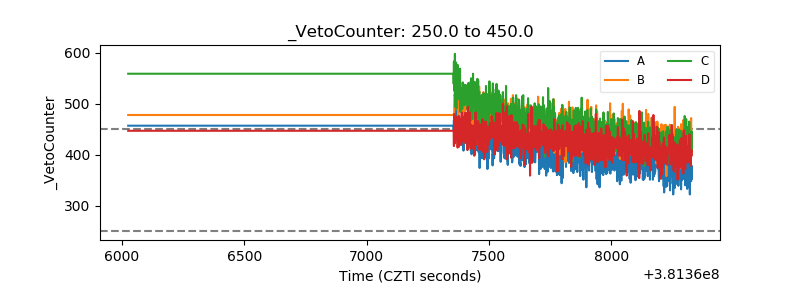 |