| Param | Original file | Final file |
|---|---|---|
| Filename | modeM0/AS1A11_091T01_9000004894cztM0_level2.fits | modeM0/AS1A11_091T01_9000004894cztM0_level2_quad_clean.evt |
| Size (bytes) | 279,109,440 | 273,401,280 |
| Size | 266.2 MB | 260.7 MB |
| Events in quadrant A | 1,719,356 | 1,649,457 |
| Events in quadrant B | 1,614,764 | 1,617,637 |
| Events in quadrant C | 1,682,216 | 1,572,347 |
| Events in quadrant D | 1,338,194 | 1,343,836 |
| Mode M0 | |||
|---|---|---|---|
| Quadrant | BADHDUFLAG | Total packets | Discarded packets |
| A | 0 | 61689 | 0 |
| B | 0 | 79646 | 0 |
| C | 0 | 65484 | 0 |
| D | 0 | 129252 | 0 |
| Mode M9 | |||
|---|---|---|---|
| Quadrant | BADHDUFLAG | Total packets | Discarded packets |
| A | 0 | 90 | 0 |
| B | 0 | 90 | 0 |
| C | 0 | 90 | 0 |
| D | 0 | 90 | 0 |
| Mode SS | |||
|---|---|---|---|
| Quadrant | BADHDUFLAG | Total packets | Discarded packets |
| A | 0 | 622 | 0 |
| B | 0 | 622 | 0 |
| C | 0 | 622 | 0 |
| D | 0 | 622 | 0 |
| Quadrant | Total seconds | Saturated seconds | Saturation percentage |
|---|---|---|---|
| A | 30497 | 39 | 0.127881% |
| B | 30498 | 1123 | 3.682209% |
| C | 30496 | 273 | 0.895199% |
| D | 30487 | 5195 | 17.040050% |
Noise dominated data is calculated using 1-second bins in cleaned event files. If a bin has >2000 counts, and if more than 50% of those come from <1% of pixels, then it is considered to be noise-dominated and hence unusable.
| Quadrant | # 1 sec bins | Bins with >0 counts | Bins with >2000 counts | High rate bins dominated by noise | Noise dominated (total time) | Noise dominated (detector-on time) | Marked lightcurve |
|---|---|---|---|---|---|---|---|
| A | 39457 | 30501 | 0 | 0 | 0.00% | 0.00% |  |
| B | 39457 | 30492 | 0 | 0 | 0.00% | 0.00% | 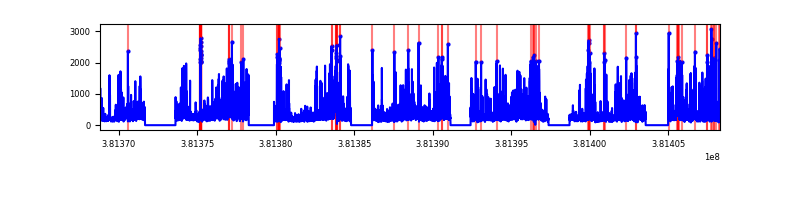 |
| C | 39457 | 30492 | 0 | 0 | 0.00% | 0.00% | 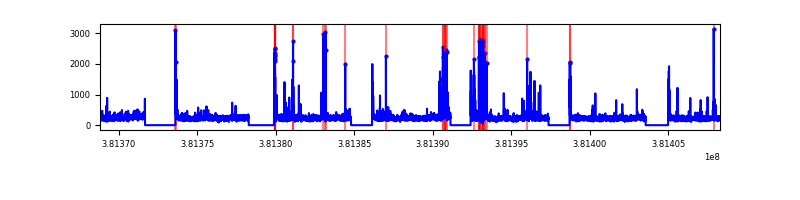 |
| D | 39457 | 30490 | 0 | 0 | 0.00% | 0.00% | 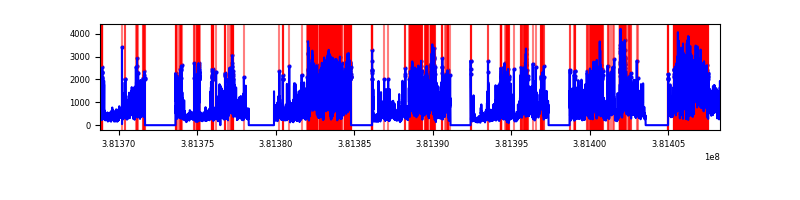 |
Top three noisy pixels from each quadrant. If the there are fewer than three noisy pixels in the level2.evt file, extra rows are filled as -1
| Pixel properties | Quadrant properties | ||||||
|---|---|---|---|---|---|---|---|
| Quadrant | DetID | PixID | Counts | Sigma | Mean | Median | Sigma |
| A | 9 | 19 | 1422 | 8.88 | 449 | 422 | 112.6 |
| A | 0 | 29 | 1400 | 8.68 | 449 | 422 | 112.6 |
| A | 7 | 110 | 1333 | 8.09 | 449 | 422 | 112.6 |
| B | 2 | 9 | 1365 | 11.22 | 427 | 408 | 85.3 |
| B | 3 | 80 | 1279 | 10.21 | 427 | 408 | 85.3 |
| B | 2 | 8 | 1170 | 8.93 | 427 | 408 | 85.3 |
| C | 1 | 65 | 1123 | 6.24 | 445 | 418 | 113.1 |
| C | 7 | 233 | 1090 | 5.94 | 445 | 418 | 113.1 |
| C | 9 | 242 | 1088 | 5.93 | 445 | 418 | 113.1 |
| D | 4 | 160 | 987 | 6.36 | 381 | 349 | 100.3 |
| D | 7 | 3 | 985 | 6.34 | 381 | 349 | 100.3 |
| D | 10 | 189 | 976 | 6.25 | 381 | 349 | 100.3 |
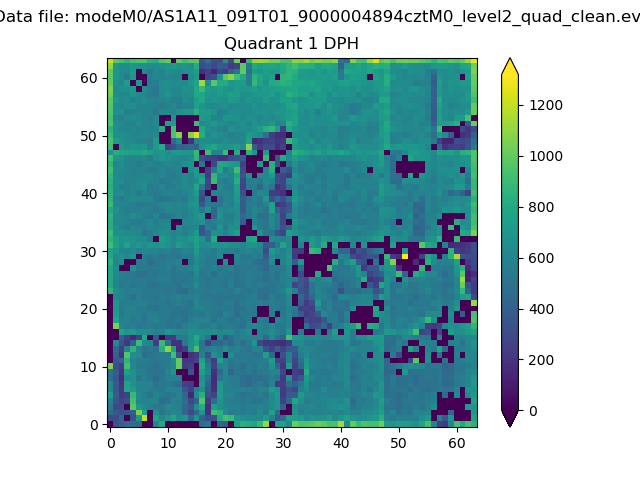
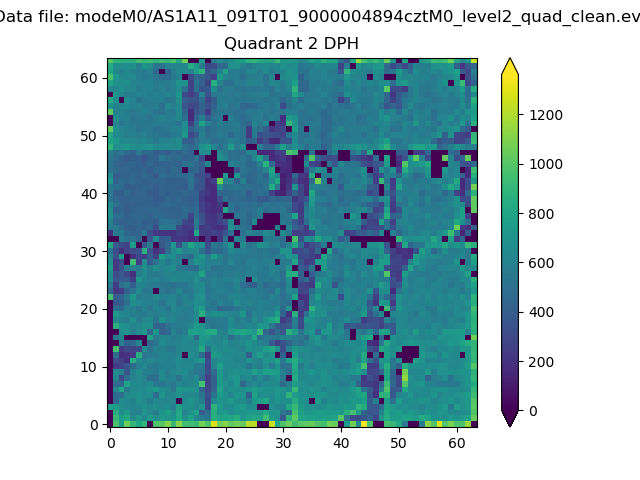
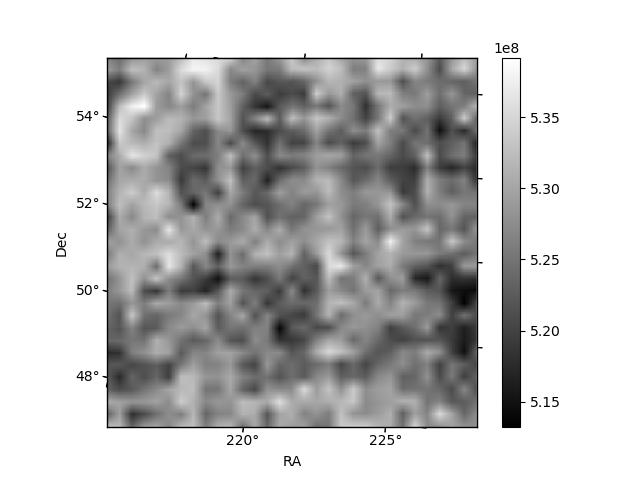
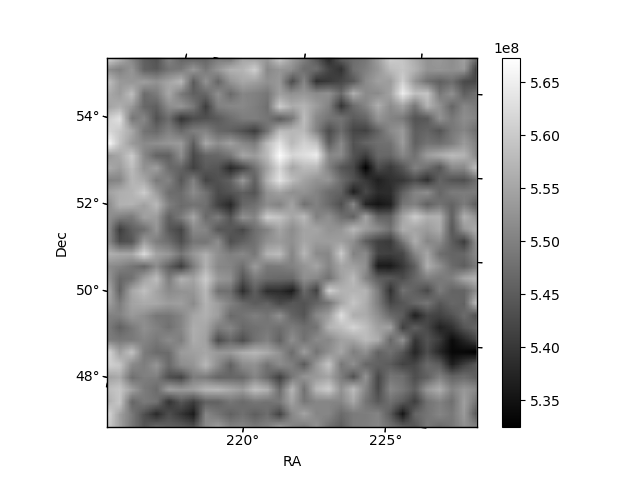
Histogram calculated using DETX and DETY for each event in the final _common_clean file
| Quadrant A | 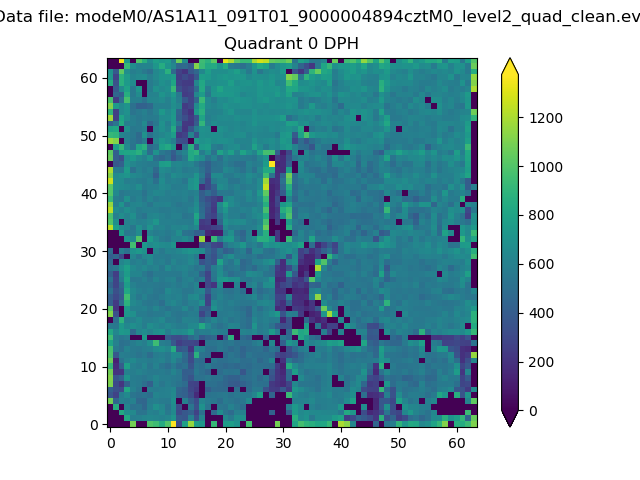 |
 |
Quadrant B |
|---|---|---|---|
| Quadrant D | 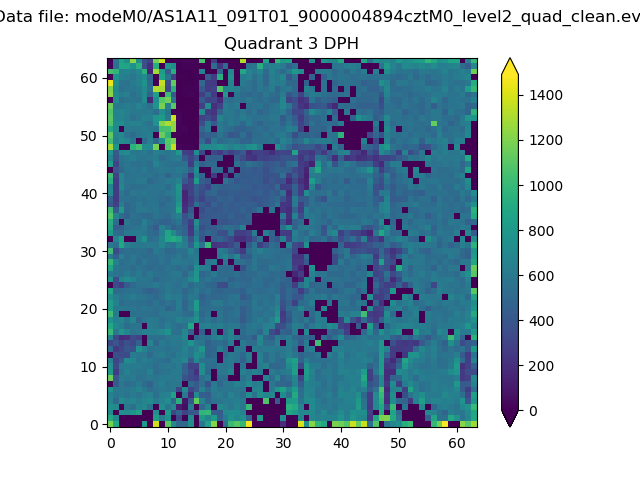 |
 |
Quadrant C |
| Plot type | Count rate plots | Images |
|---|---|---|
| Comparison with Poisson distribution Blue bars denote a histogram of data divided into 1 sec bins. Red curve is a Poisson curve with rate = median count rate of data. |
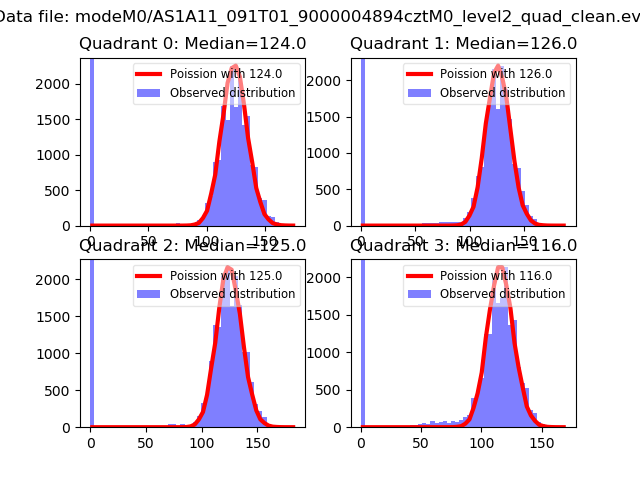 |
 |
| Quadrant-wise count rates Data is divided into 100 sec bins |
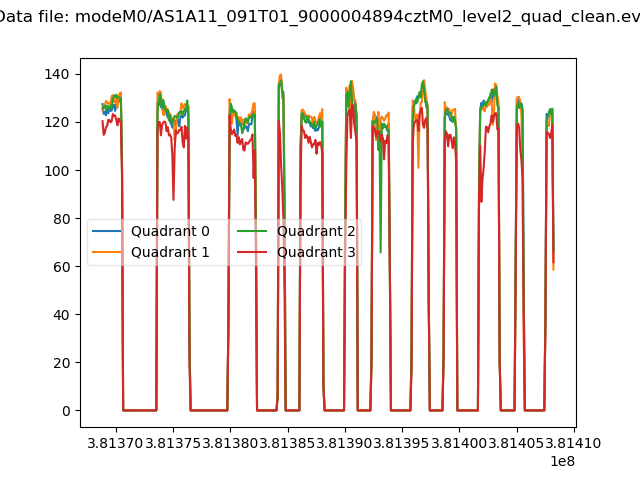 |
|
| Module-wise count rates for Quadrant A Data is divided into 100 sec bins |
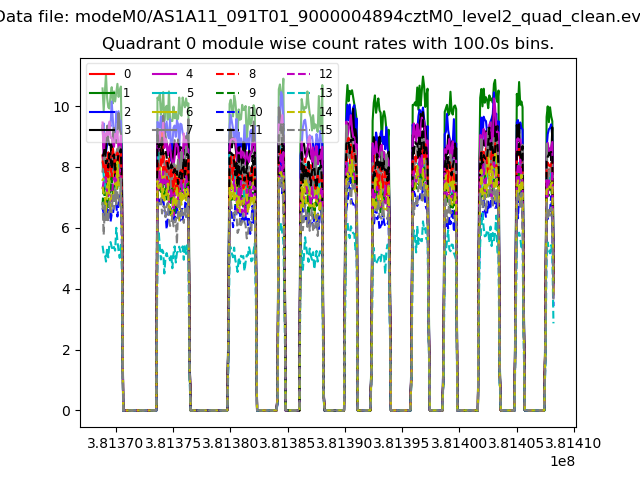 |
 |
| Module-wise count rates for Quadrant B Data is divided into 100 sec bins |
 |
 |
| Module-wise count rates for Quadrant C Data is divided into 100 sec bins |
 |
 |
| Module-wise count rates for Quadrant D Data is divided into 100 sec bins |
 |
 |
| Parameter | Plot |
|---|---|
| CZT HV Monitor |  |
| D_VDD | 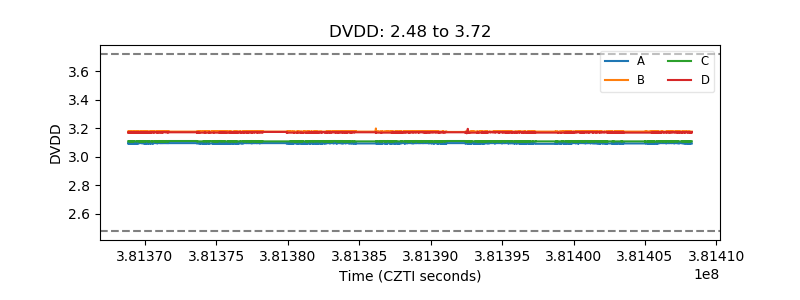 |
| Temperature 1 |  |
| Veto HV Monitor | 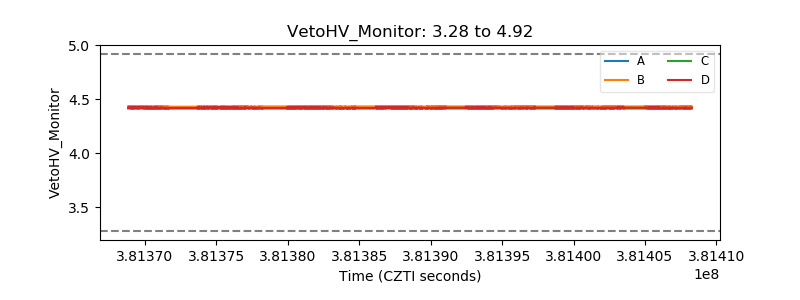 |
| Veto LLD |  |
| Alpha Counter |  |
| _CPM_Rate | 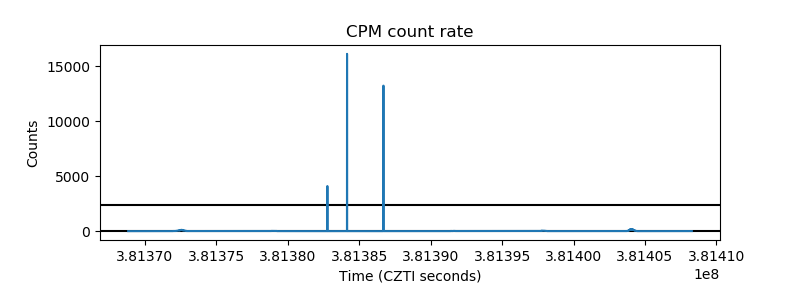 |
| CZT Counter | 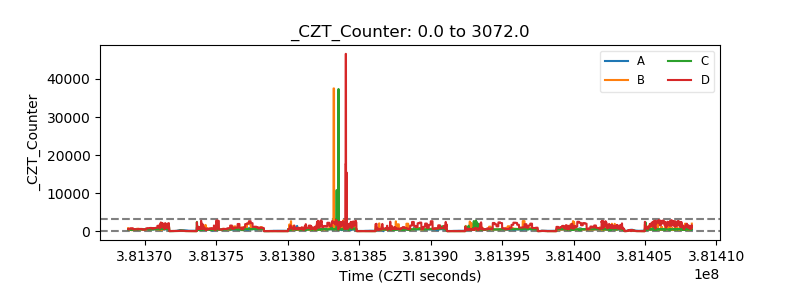 |
| +2.5 Volts monitor |  |
| +5 Volts monitor | 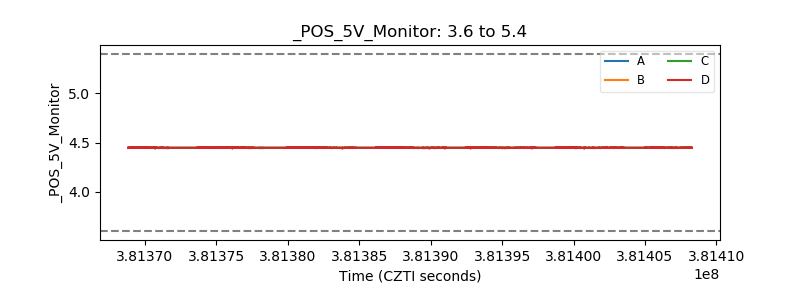 |
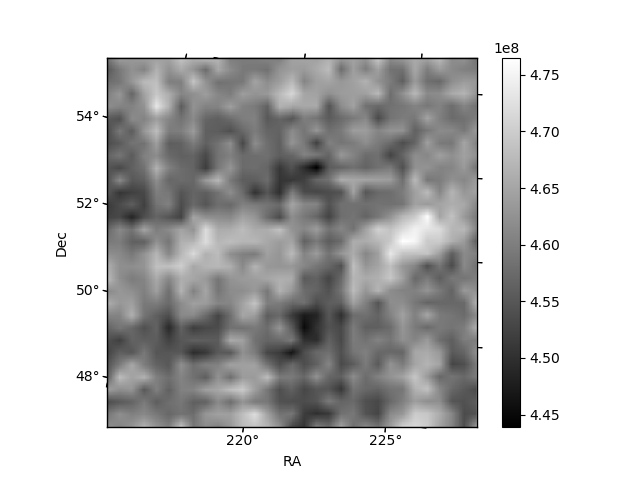
| _ROLL_ROT | 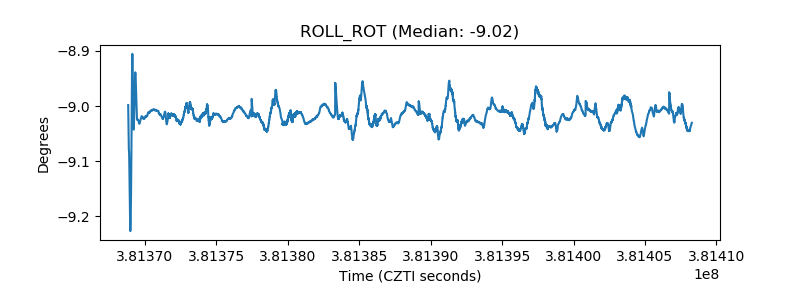 |
| _Roll_DEC | 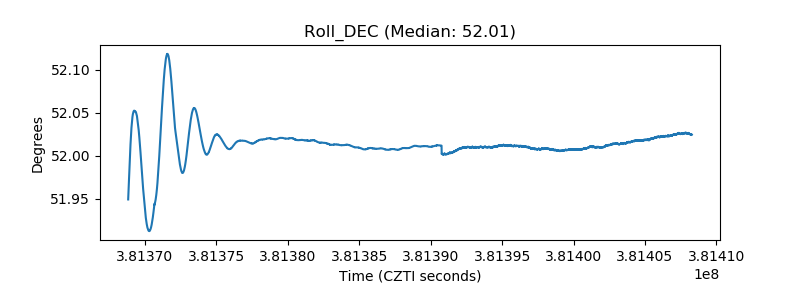 |
| _Roll_RA | 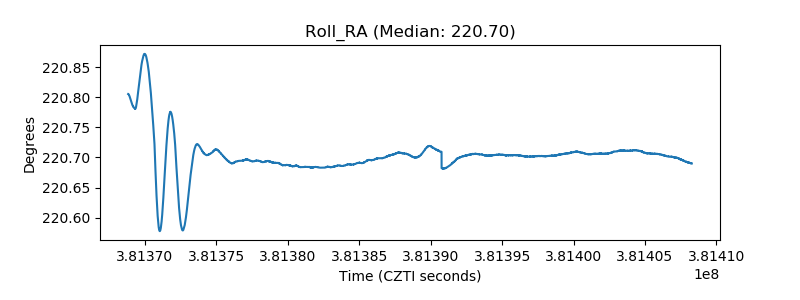 |
| Veto Counter |  |