| Param | Original file | Final file |
|---|---|---|
| Filename | modeM0/AS1A11_091T01_9000004894_34314cztM0_level2.evt | modeM0/AS1A11_091T01_9000004894_34314cztM0_level2_quad_clean.evt |
| Size (bytes) | 841,947,840 | 102,496,320 |
| Size | 802.9 MB | 97.7 MB |
| Events in quadrant A | 4,079,047 | 637,248 |
| Events in quadrant B | 5,877,276 | 635,195 |
| Events in quadrant C | 4,814,916 | 627,966 |
| Events in quadrant D | 10,121,599 | 580,579 |
| Mode M0 | |||
|---|---|---|---|
| Quadrant | BADHDUFLAG | Total packets | Discarded packets |
| A | 0 | 18059 | 3 |
| B | 0 | 23316 | 2 |
| C | 0 | 19539 | 2 |
| D | 0 | 36393 | 2 |
| Mode M9 | |||
|---|---|---|---|
| Quadrant | BADHDUFLAG | Total packets | Discarded packets |
| A | 0 | 20 | 0 |
| B | 0 | 20 | 0 |
| C | 0 | 20 | 0 |
| D | 0 | 21 | 0 |
| Mode SS | |||
|---|---|---|---|
| Quadrant | BADHDUFLAG | Total packets | Discarded packets |
| A | 0 | 182 | 0 |
| B | 0 | 182 | 0 |
| C | 0 | 182 | 0 |
| D | 0 | 182 | 0 |
| Quadrant | Total seconds | Saturated seconds | Saturation percentage |
|---|---|---|---|
| A | 8969 | 5 | 0.055748% |
| B | 8969 | 354 | 3.946928% |
| C | 8969 | 137 | 1.527484% |
| D | 8969 | 1164 | 12.978035% |
Noise dominated data is calculated using 1-second bins in cleaned event files. If a bin has >2000 counts, and if more than 50% of those come from <1% of pixels, then it is considered to be noise-dominated and hence unusable.
| Quadrant | # 1 sec bins | Bins with >0 counts | Bins with >2000 counts | High rate bins dominated by noise | Noise dominated (total time) | Noise dominated (detector-on time) | Marked lightcurve |
|---|---|---|---|---|---|---|---|
| A | 10310 | 8970 | 1 | 1 | 0.01% | 0.01% | 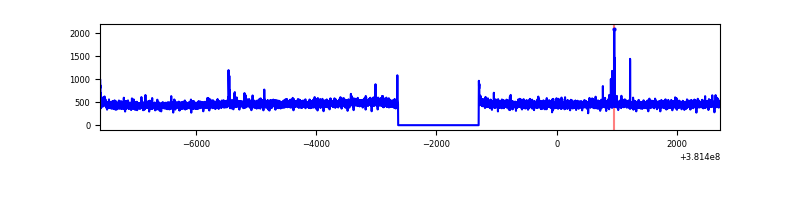 |
| B | 10310 | 8970 | 216 | 216 | 2.10% | 2.41% | 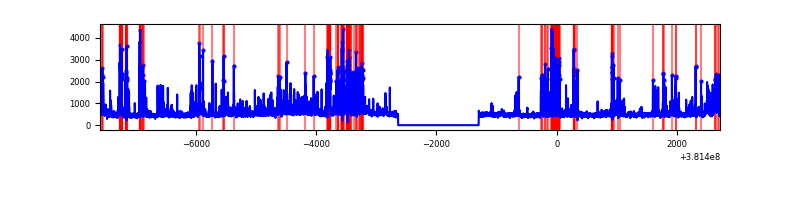 |
| C | 10310 | 8970 | 109 | 109 | 1.06% | 1.22% | 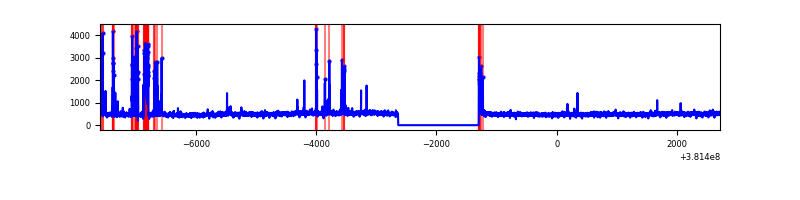 |
| D | 10310 | 8970 | 950 | 950 | 9.21% | 10.59% | 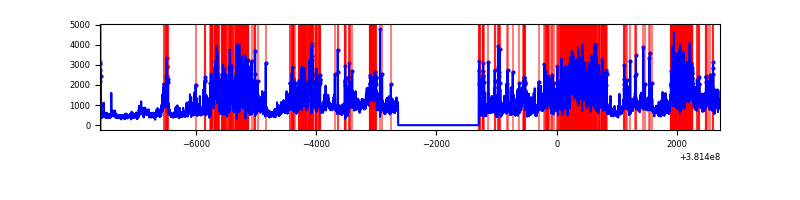 |
Top three noisy pixels from each quadrant. If the there are fewer than three noisy pixels in the level2.evt file, extra rows are filled as -1
| Pixel properties | Quadrant properties | ||||||
|---|---|---|---|---|---|---|---|
| Quadrant | DetID | PixID | Counts | Sigma | Mean | Median | Sigma |
| A | 10 | 83 | 32427 | 152.0 | 1037 | 1017 | 206.6 |
| A | 9 | 143 | 25314 | 117.58 | 1037 | 1017 | 206.6 |
| A | 13 | 254 | 15942 | 72.23 | 1037 | 1017 | 206.6 |
| B | 5 | 172 | 1142279 | 5835.05 | 1015 | 988 | 195.6 |
| B | 4 | 171 | 226101 | 1150.93 | 1015 | 988 | 195.6 |
| B | 4 | 251 | 172577 | 877.28 | 1015 | 988 | 195.6 |
| C | 14 | 254 | 424891 | 1830.35 | 999 | 1005 | 231.6 |
| C | 15 | 214 | 373178 | 1607.05 | 999 | 1005 | 231.6 |
| C | 0 | 10 | 73716 | 313.97 | 999 | 1005 | 231.6 |
| D | 1 | 52 | 1188177 | 5006.83 | 969 | 944 | 237.1 |
| D | 7 | 223 | 1103541 | 4649.9 | 969 | 944 | 237.1 |
| D | 10 | 118 | 1071357 | 4514.18 | 969 | 944 | 237.1 |
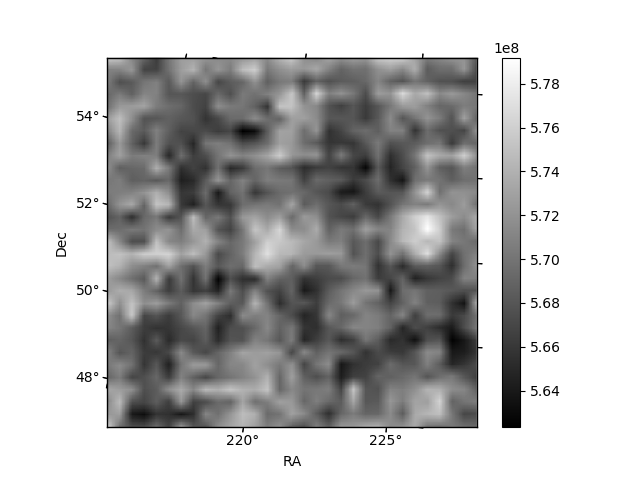
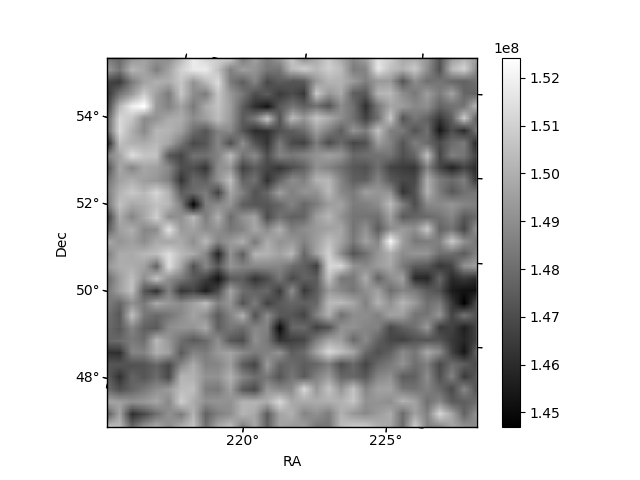
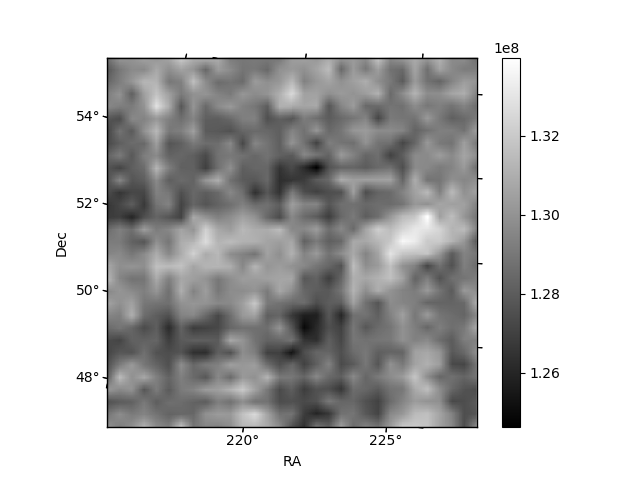
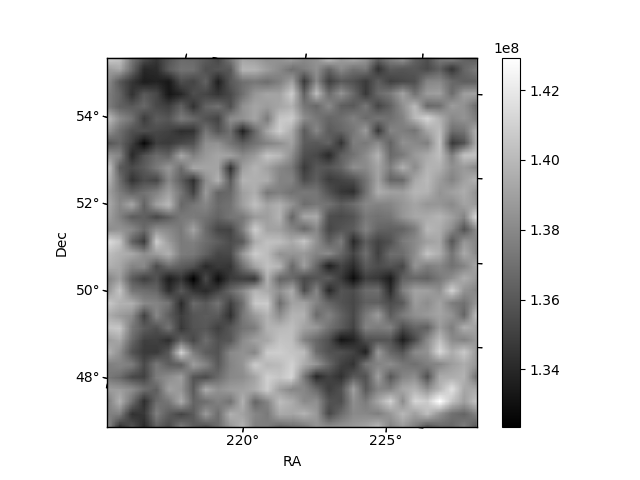
Histogram calculated using DETX and DETY for each event in the final _common_clean file
| Quadrant A | 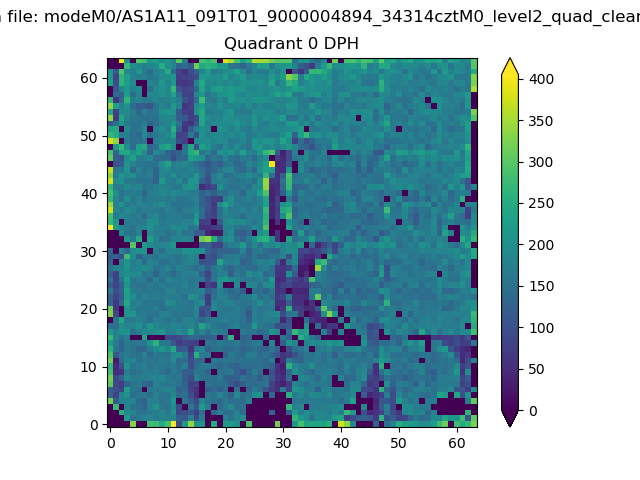 |
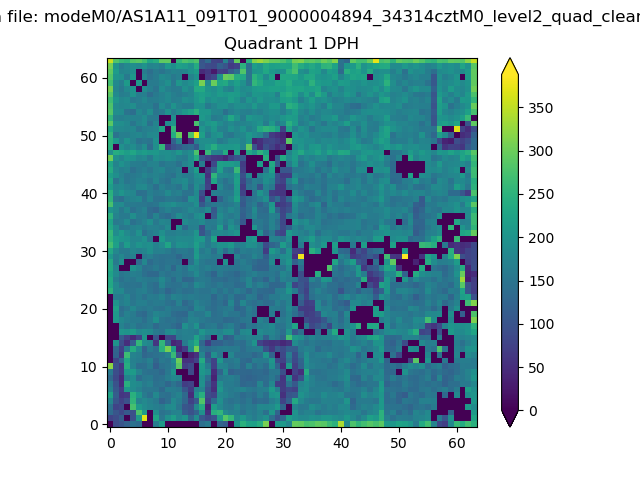 |
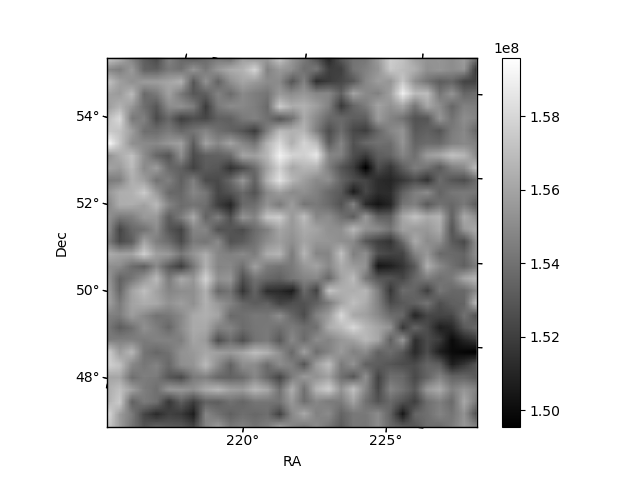
Quadrant B |
|---|---|---|---|
| Quadrant D | 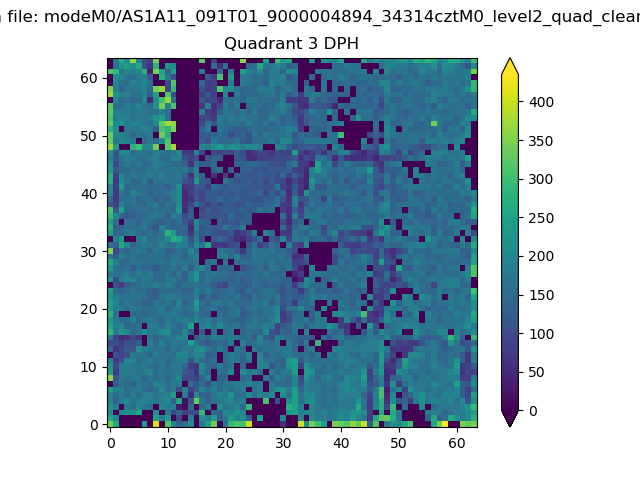 |
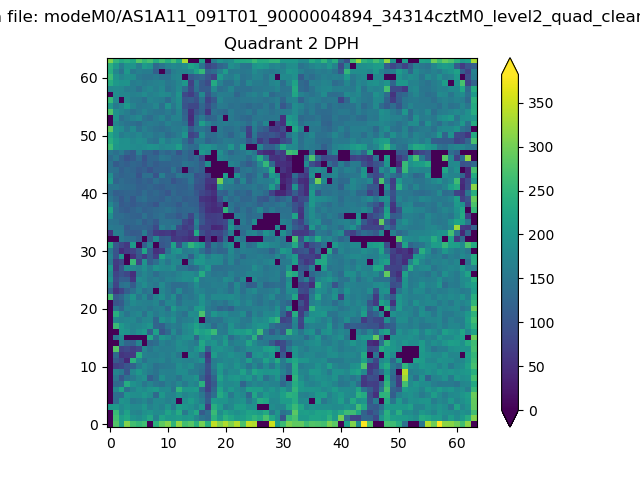 |
Quadrant C |
| Plot type | Count rate plots | Images |
|---|---|---|
| Comparison with Poisson distribution Blue bars denote a histogram of data divided into 1 sec bins. Red curve is a Poisson curve with rate = median count rate of data. |
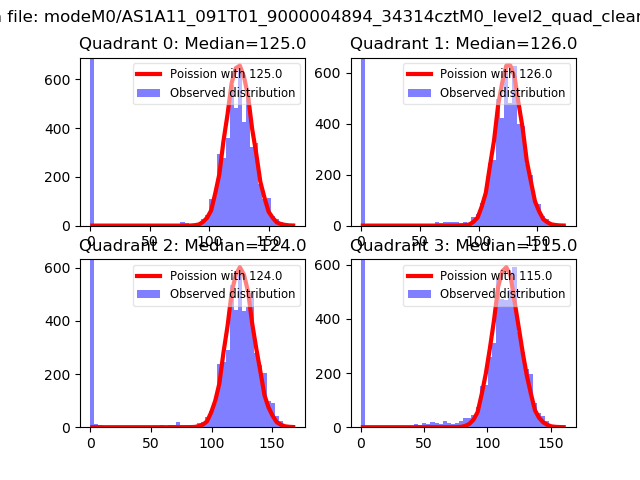 |
 |
| Quadrant-wise count rates Data is divided into 100 sec bins |
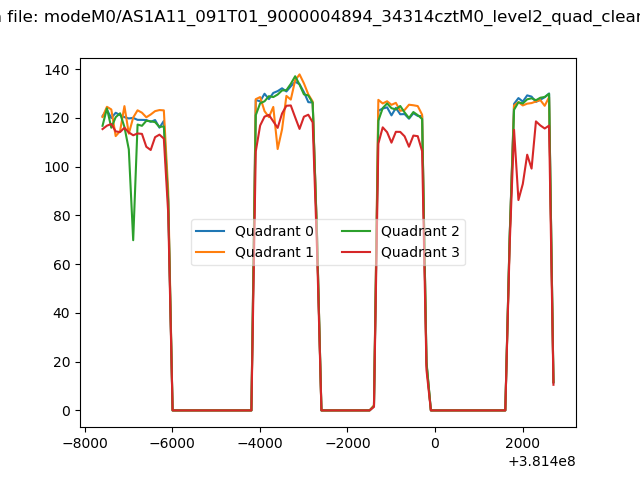 |
|
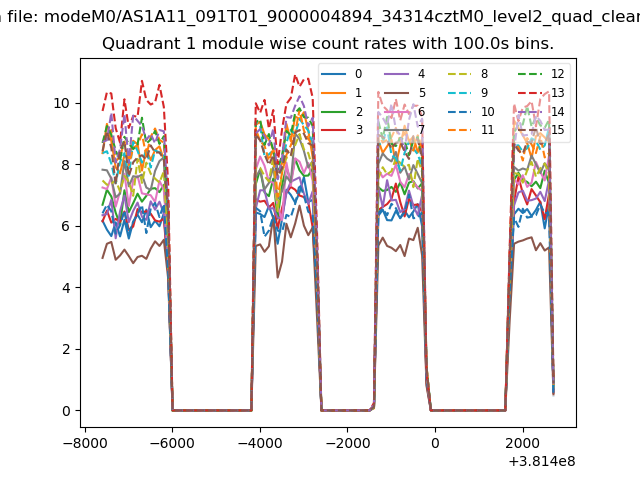
| Module-wise count rates for Quadrant A Data is divided into 100 sec bins |
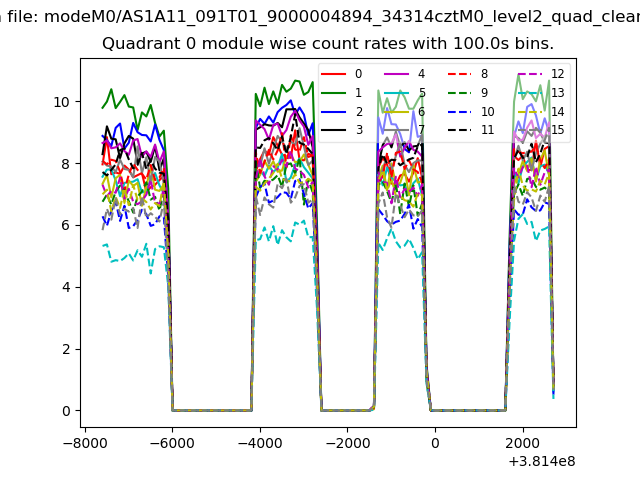 |
 |
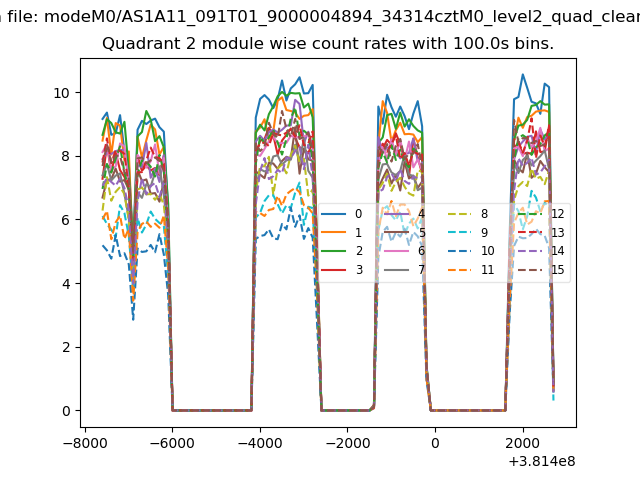
| Module-wise count rates for Quadrant B Data is divided into 100 sec bins |
 |
 |
| Module-wise count rates for Quadrant C Data is divided into 100 sec bins |
 |
 |
| Module-wise count rates for Quadrant D Data is divided into 100 sec bins |
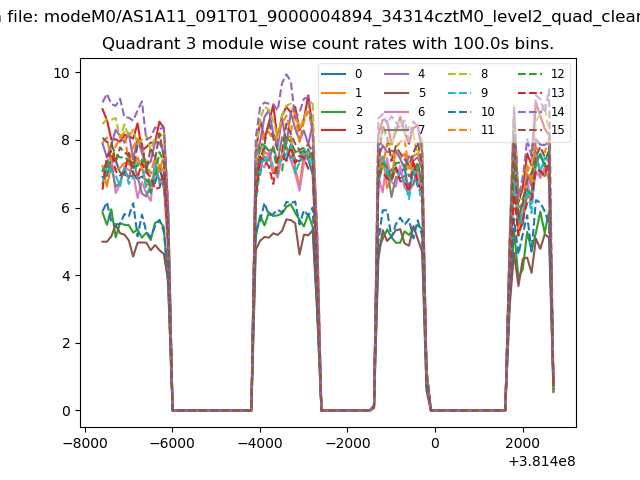 |
 |
| Parameter | Plot |
|---|---|
| CZT HV Monitor | 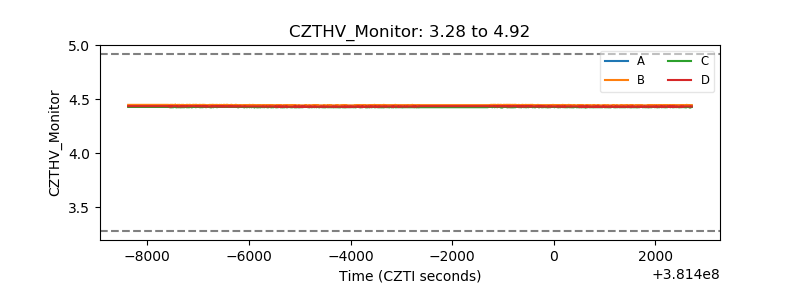 |
| D_VDD | 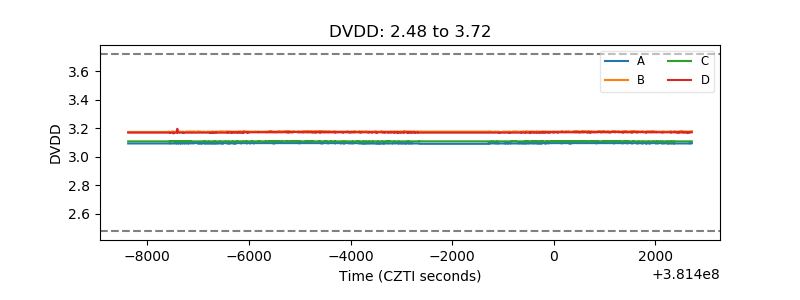 |
| Temperature 1 | 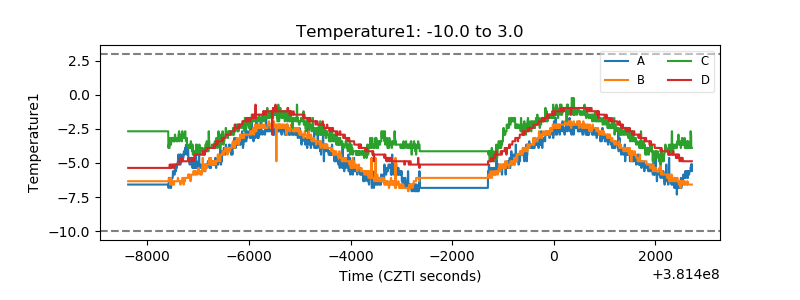 |
| Veto HV Monitor | 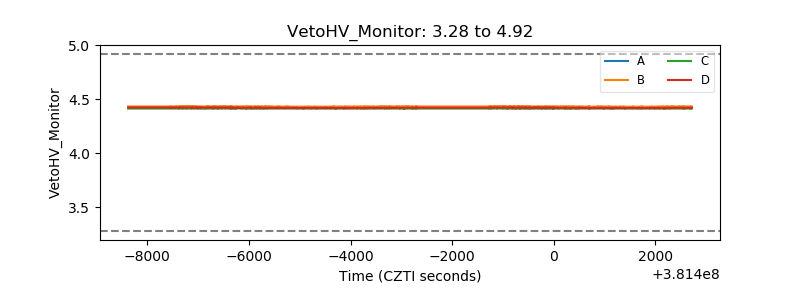 |
| Veto LLD | 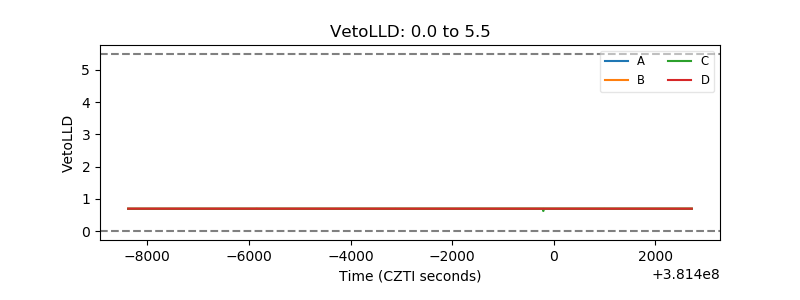 |
| Alpha Counter | 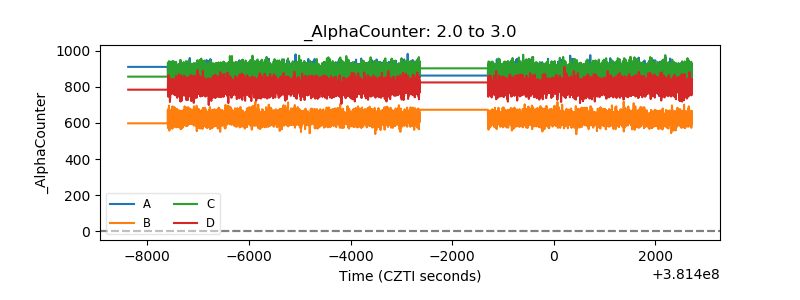 |
| _CPM_Rate | 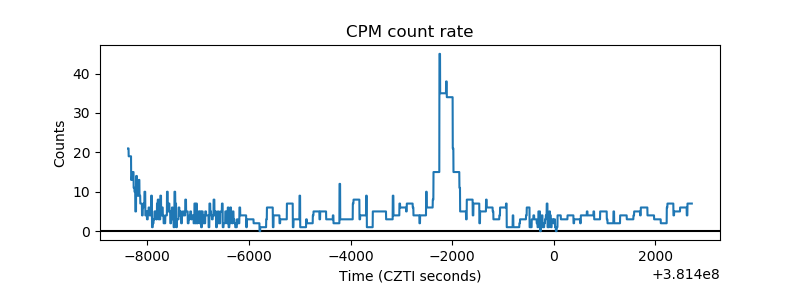 |
| CZT Counter | 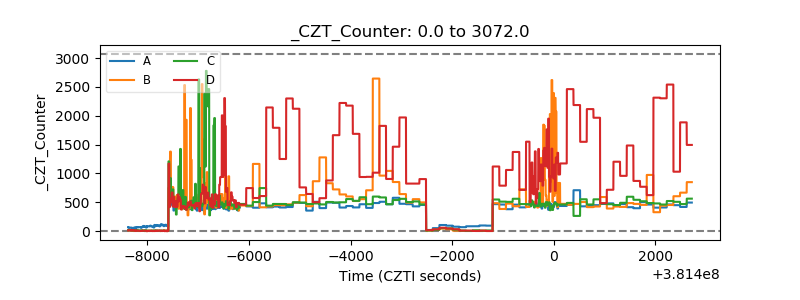 |
| +2.5 Volts monitor |  |
| +5 Volts monitor |  |
| _ROLL_ROT | 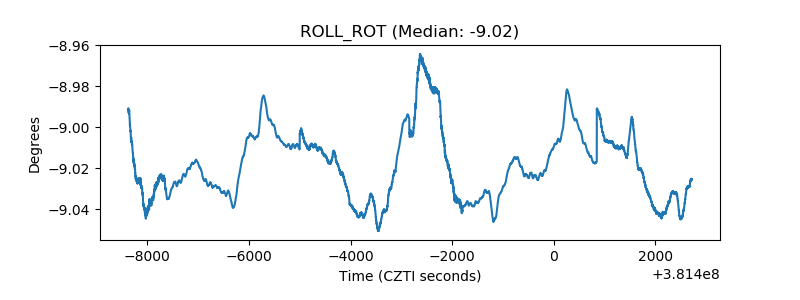 |
| _Roll_DEC | 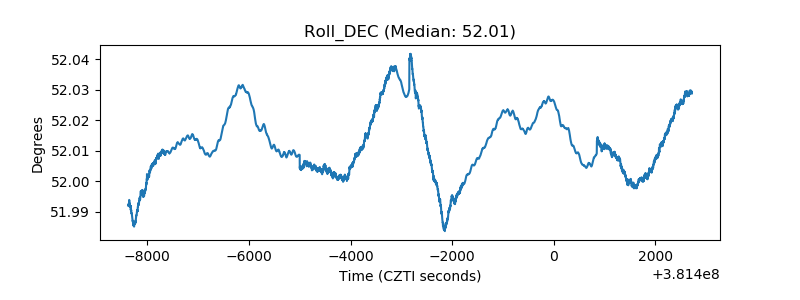 |
| _Roll_RA | 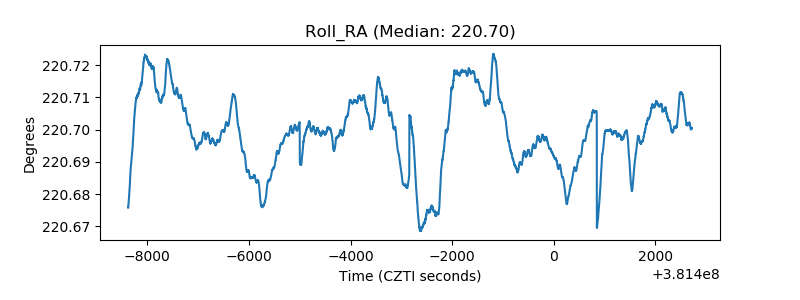 |
| Veto Counter | 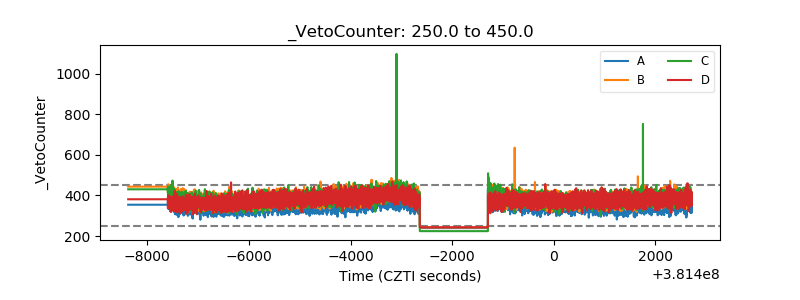 |