| Param | Original file | Final file |
|---|---|---|
| Filename | modeM0/AS1A05_012T02_9000004898cztM0_level2.fits | modeM0/AS1A05_012T02_9000004898cztM0_level2_quad_clean.evt |
| Size (bytes) | 117,360,000 | 92,612,160 |
| Size | 111.9 MB | 88.3 MB |
| Events in quadrant A | 759,614 | 538,660 |
| Events in quadrant B | 728,424 | 541,623 |
| Events in quadrant C | 754,412 | 525,791 |
| Events in quadrant D | 525,754 | 412,768 |
| Mode M0 | |||
|---|---|---|---|
| Quadrant | BADHDUFLAG | Total packets | Discarded packets |
| A | 0 | 23718 | 0 |
| B | 0 | 26541 | 0 |
| C | 0 | 28144 | 0 |
| D | 0 | 64943 | 0 |
| Mode M9 | |||
|---|---|---|---|
| Quadrant | BADHDUFLAG | Total packets | Discarded packets |
| A | 0 | 58 | 0 |
| B | 0 | 58 | 0 |
| C | 0 | 58 | 0 |
| D | 0 | 58 | 0 |
| Mode SS | |||
|---|---|---|---|
| Quadrant | BADHDUFLAG | Total packets | Discarded packets |
| A | 0 | 232 | 0 |
| B | 0 | 232 | 0 |
| C | 0 | 232 | 0 |
| D | 0 | 232 | 0 |
| Quadrant | Total seconds | Saturated seconds | Saturation percentage |
|---|---|---|---|
| A | 11341 | 25 | 0.220439% |
| B | 11341 | 106 | 0.934662% |
| C | 11341 | 270 | 2.380742% |
| D | 11341 | 3983 | 35.120360% |
Noise dominated data is calculated using 1-second bins in cleaned event files. If a bin has >2000 counts, and if more than 50% of those come from <1% of pixels, then it is considered to be noise-dominated and hence unusable.
| Quadrant | # 1 sec bins | Bins with >0 counts | Bins with >2000 counts | High rate bins dominated by noise | Noise dominated (total time) | Noise dominated (detector-on time) | Marked lightcurve |
|---|---|---|---|---|---|---|---|
| A | 17078 | 11341 | 0 | 0 | 0.00% | 0.00% |  |
| B | 17078 | 11340 | 0 | 0 | 0.00% | 0.00% | 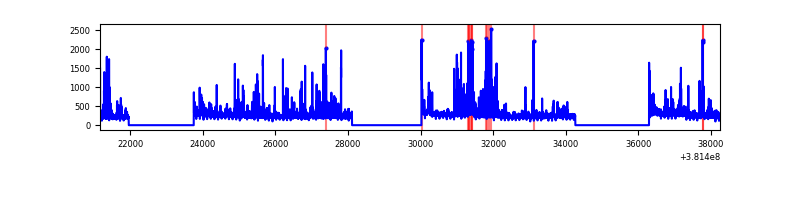 |
| C | 17078 | 11339 | 0 | 0 | 0.00% | 0.00% |  |
| D | 17078 | 11254 | 0 | 0 | 0.00% | 0.00% |  |
Top three noisy pixels from each quadrant. If the there are fewer than three noisy pixels in the level2.evt file, extra rows are filled as -1
| Pixel properties | Quadrant properties | ||||||
|---|---|---|---|---|---|---|---|
| Quadrant | DetID | PixID | Counts | Sigma | Mean | Median | Sigma |
| A | 9 | 19 | 663 | 9.73 | 197 | 188 | 48.8 |
| A | 0 | 29 | 627 | 9.0 | 197 | 188 | 48.8 |
| A | 7 | 110 | 607 | 8.59 | 197 | 188 | 48.8 |
| B | 2 | 9 | 589 | 10.13 | 193 | 187 | 39.7 |
| B | 3 | 80 | 566 | 9.55 | 193 | 187 | 39.7 |
| B | 5 | 128 | 500 | 7.89 | 193 | 187 | 39.7 |
| C | 3 | 203 | 573 | 7.35 | 200 | 191 | 51.9 |
| C | 3 | 202 | 569 | 7.28 | 200 | 191 | 51.9 |
| C | 3 | 187 | 508 | 6.1 | 200 | 191 | 51.9 |
| D | 10 | 113 | 382 | 6.0 | 150 | 138 | 40.7 |
| D | 6 | 67 | 378 | 5.9 | 150 | 138 | 40.7 |
| D | 3 | 14 | 377 | 5.88 | 150 | 138 | 40.7 |
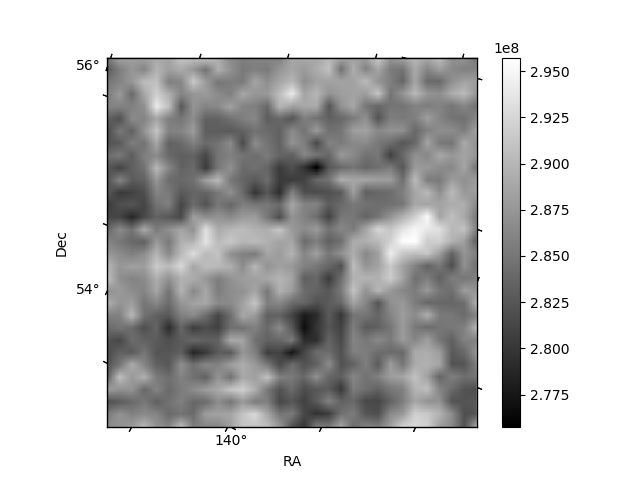
Histogram calculated using DETX and DETY for each event in the final _common_clean file
| Quadrant A | 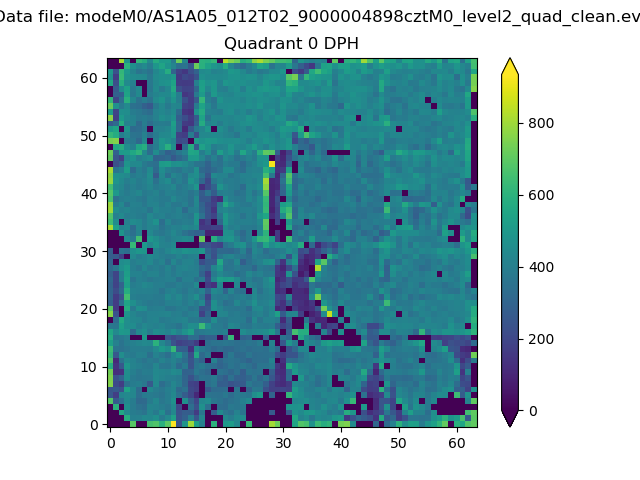 |
 |
Quadrant B |
|---|---|---|---|
| Quadrant D | 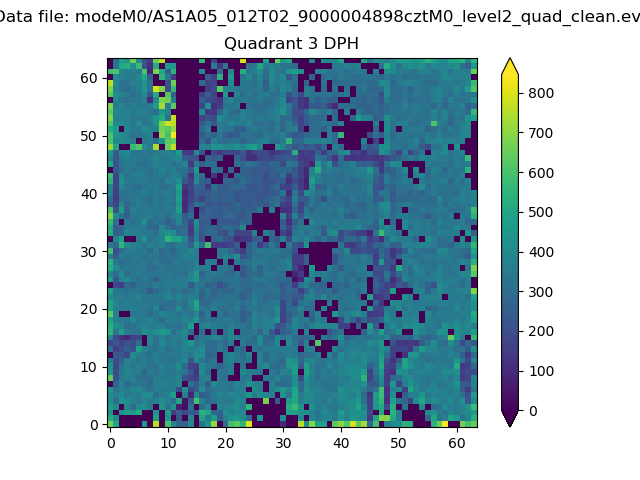 |
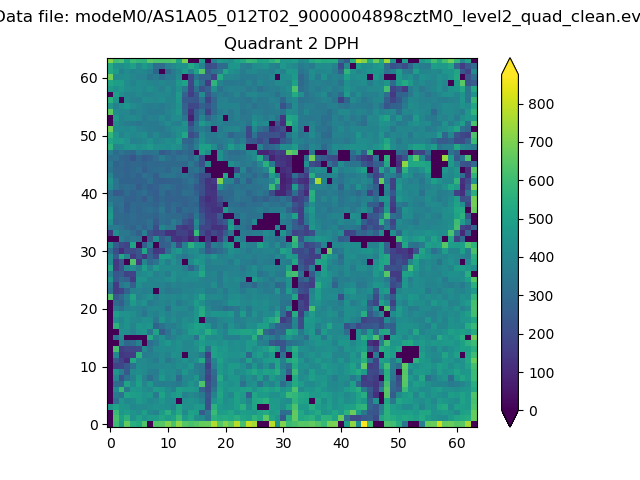 |
Quadrant C |
| Plot type | Count rate plots | Images |
|---|---|---|
| Comparison with Poisson distribution Blue bars denote a histogram of data divided into 1 sec bins. Red curve is a Poisson curve with rate = median count rate of data. |
 |
 |
| Quadrant-wise count rates Data is divided into 100 sec bins |
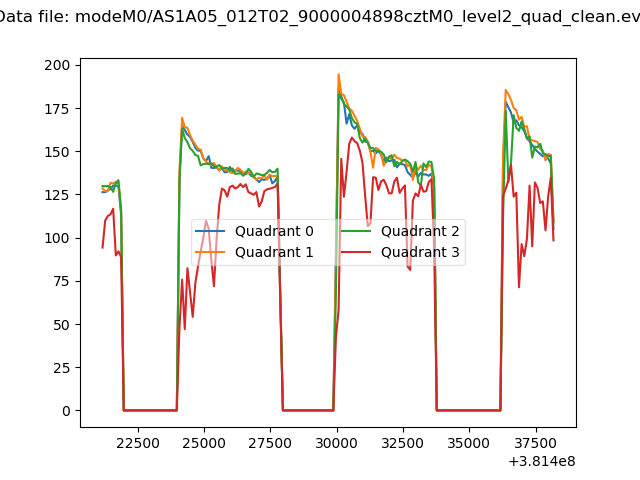 |
|
| Module-wise count rates for Quadrant A Data is divided into 100 sec bins |
 |
 |
| Module-wise count rates for Quadrant B Data is divided into 100 sec bins |
 |
 |
| Module-wise count rates for Quadrant C Data is divided into 100 sec bins |
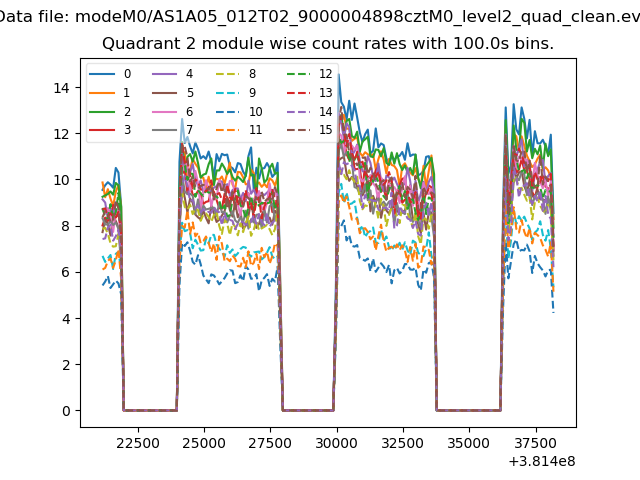 |
 |
| Module-wise count rates for Quadrant D Data is divided into 100 sec bins |
 |
 |
| Parameter | Plot |
|---|---|
| CZT HV Monitor |  |
| D_VDD |  |
| Temperature 1 |  |
| Veto HV Monitor |  |
| Veto LLD |  |
| Alpha Counter |  |
| _CPM_Rate |  |
| CZT Counter |  |
| +2.5 Volts monitor |  |
| +5 Volts monitor |  |
| _ROLL_ROT |  |
| _Roll_DEC |  |
| _Roll_RA | 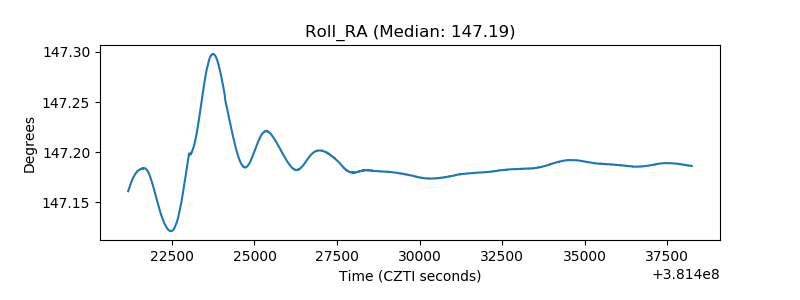 |
| Veto Counter |  |