| Param | Original file | Final file |
|---|---|---|
| Filename | modeM0/AS1A05_082T08_9000004900cztM0_level2.fits | modeM0/AS1A05_082T08_9000004900cztM0_level2_quad_clean.evt |
| Size (bytes) | 232,773,120 | 209,197,440 |
| Size | 222.0 MB | 199.5 MB |
| Events in quadrant A | 1,442,544 | 1,229,451 |
| Events in quadrant B | 1,367,168 | 1,213,699 |
| Events in quadrant C | 1,415,890 | 1,185,370 |
| Events in quadrant D | 1,173,846 | 1,056,373 |
| Mode M9 | |||
|---|---|---|---|
| Quadrant | BADHDUFLAG | Total packets | Discarded packets |
| A | 0 | 96 | 0 |
| B | 0 | 96 | 0 |
| C | 0 | 96 | 0 |
| D | 0 | 96 | 0 |
| Mode SS | |||
|---|---|---|---|
| Quadrant | BADHDUFLAG | Total packets | Discarded packets |
| A | 0 | 486 | 0 |
| B | 0 | 486 | 0 |
| C | 0 | 486 | 0 |
| D | 0 | 486 | 0 |
| Mode M0 | |||
|---|---|---|---|
| Quadrant | BADHDUFLAG | Total packets | Discarded packets |
| A | 0 | 48762 | 0 |
| B | 0 | 56412 | 0 |
| C | 0 | 56538 | 0 |
| D | 0 | 84499 | 0 |
| Quadrant | Total seconds | Saturated seconds | Saturation percentage |
|---|---|---|---|
| A | 23988 | 35 | 0.145906% |
| B | 23988 | 583 | 2.430382% |
| C | 23988 | 372 | 1.550775% |
| D | 23988 | 1720 | 7.170252% |
Noise dominated data is calculated using 1-second bins in cleaned event files. If a bin has >2000 counts, and if more than 50% of those come from <1% of pixels, then it is considered to be noise-dominated and hence unusable.
| Quadrant | # 1 sec bins | Bins with >0 counts | Bins with >2000 counts | High rate bins dominated by noise | Noise dominated (total time) | Noise dominated (detector-on time) | Marked lightcurve |
|---|---|---|---|---|---|---|---|
| A | 33429 | 23988 | 0 | 0 | 0.00% | 0.00% |  |
| B | 33429 | 23983 | 0 | 0 | 0.00% | 0.00% |  |
| C | 33429 | 23982 | 0 | 0 | 0.00% | 0.00% |  |
| D | 33429 | 23976 | 0 | 0 | 0.00% | 0.00% |  |
Top three noisy pixels from each quadrant. If the there are fewer than three noisy pixels in the level2.evt file, extra rows are filled as -1
| Pixel properties | Quadrant properties | ||||||
|---|---|---|---|---|---|---|---|
| Quadrant | DetID | PixID | Counts | Sigma | Mean | Median | Sigma |
| A | 7 | 110 | 1137 | 8.31 | 375 | 352 | 94.5 |
| A | 14 | 95 | 1135 | 8.29 | 375 | 352 | 94.5 |
| A | 0 | 29 | 1125 | 8.18 | 375 | 352 | 94.5 |
| B | 2 | 9 | 1157 | 11.07 | 362 | 345 | 73.4 |
| B | 3 | 80 | 1040 | 9.47 | 362 | 345 | 73.4 |
| B | 3 | 17 | 977 | 8.61 | 362 | 345 | 73.4 |
| C | 1 | 81 | 1200 | 8.74 | 374 | 352 | 97.0 |
| C | 1 | 80 | 1189 | 8.63 | 374 | 352 | 97.0 |
| C | 3 | 203 | 1106 | 7.77 | 374 | 352 | 97.0 |
| D | 4 | 160 | 874 | 6.31 | 335 | 306 | 90.0 |
| D | 6 | 38 | 823 | 5.75 | 335 | 306 | 90.0 |
| D | 10 | 113 | 820 | 5.71 | 335 | 306 | 90.0 |
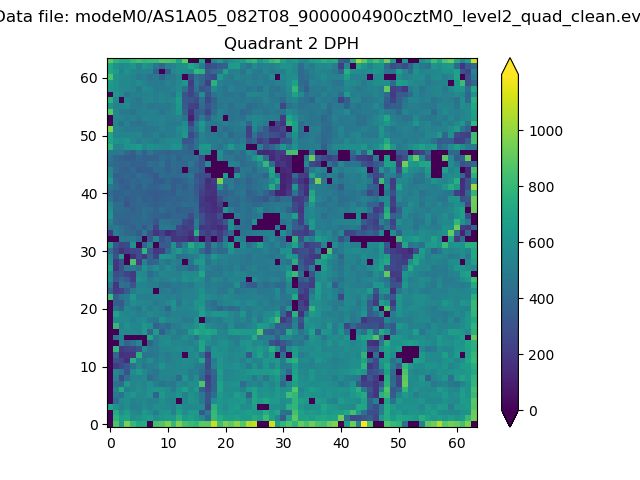
Histogram calculated using DETX and DETY for each event in the final _common_clean file
| Quadrant A |  |
 |
Quadrant B |
|---|---|---|---|
| Quadrant D | 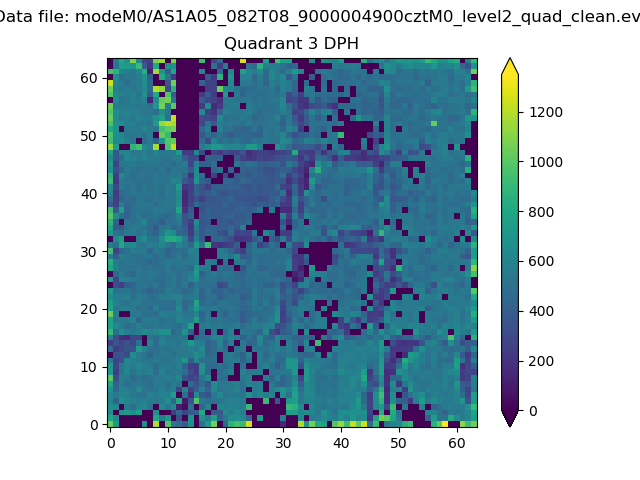 |
 |
Quadrant C |
| Plot type | Count rate plots | Images |
|---|---|---|
| Comparison with Poisson distribution Blue bars denote a histogram of data divided into 1 sec bins. Red curve is a Poisson curve with rate = median count rate of data. |
 |
 |
| Quadrant-wise count rates Data is divided into 100 sec bins |
 |
|
| Module-wise count rates for Quadrant A Data is divided into 100 sec bins |
 |
 |
| Module-wise count rates for Quadrant B Data is divided into 100 sec bins |
 |
 |
| Module-wise count rates for Quadrant C Data is divided into 100 sec bins |
 |
 |
| Module-wise count rates for Quadrant D Data is divided into 100 sec bins |
 |
 |
| Parameter | Plot |
|---|---|
| CZT HV Monitor |  |
| D_VDD | 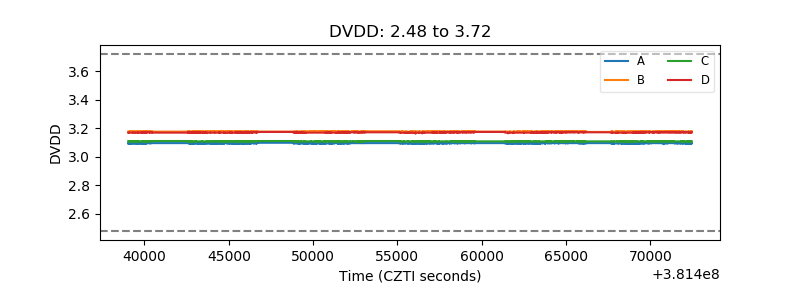 |
| Temperature 1 |  |
| Veto HV Monitor |  |
| Veto LLD |  |
| Alpha Counter |  |
| _CPM_Rate |  |
| CZT Counter |  |
| +2.5 Volts monitor |  |
| +5 Volts monitor |  |
| _ROLL_ROT |  |
| _Roll_DEC |  |
| _Roll_RA |  |
| Veto Counter |  |