| Param | Original file | Final file |
|---|---|---|
| Filename | modeM0/AS1A05_082T08_9000004900_34325cztM0_level2.evt | modeM0/AS1A05_082T08_9000004900_34325cztM0_level2_quad_clean.evt |
| Size (bytes) | 502,632,000 | 73,811,520 |
| Size | 479.3 MB | 70.4 MB |
| Events in quadrant A | 2,734,108 | 459,467 |
| Events in quadrant B | 3,788,798 | 453,510 |
| Events in quadrant C | 3,224,949 | 465,086 |
| Events in quadrant D | 5,067,252 | 437,558 |
| Mode M9 | |||
|---|---|---|---|
| Quadrant | BADHDUFLAG | Total packets | Discarded packets |
| A | 0 | 30 | 0 |
| B | 0 | 30 | 0 |
| C | 0 | 30 | 0 |
| D | 0 | 31 | 0 |
| Mode SS | |||
|---|---|---|---|
| Quadrant | BADHDUFLAG | Total packets | Discarded packets |
| A | 0 | 120 | 0 |
| B | 0 | 120 | 0 |
| C | 0 | 120 | 0 |
| D | 0 | 120 | 0 |
| Mode M0 | |||
|---|---|---|---|
| Quadrant | BADHDUFLAG | Total packets | Discarded packets |
| A | 0 | 12138 | 3 |
| B | 0 | 15138 | 2 |
| C | 0 | 13200 | 2 |
| D | 0 | 19417 | 2 |
| Quadrant | Total seconds | Saturated seconds | Saturation percentage |
|---|---|---|---|
| A | 6010 | 7 | 0.116473% |
| B | 6010 | 274 | 4.559068% |
| C | 6010 | 42 | 0.698835% |
| D | 6010 | 306 | 5.091514% |
Noise dominated data is calculated using 1-second bins in cleaned event files. If a bin has >2000 counts, and if more than 50% of those come from <1% of pixels, then it is considered to be noise-dominated and hence unusable.
| Quadrant | # 1 sec bins | Bins with >0 counts | Bins with >2000 counts | High rate bins dominated by noise | Noise dominated (total time) | Noise dominated (detector-on time) | Marked lightcurve |
|---|---|---|---|---|---|---|---|
| A | 7443 | 6011 | 1 | 1 | 0.01% | 0.02% | 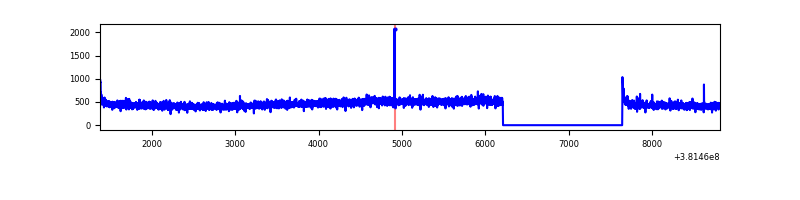 |
| B | 7443 | 6011 | 179 | 179 | 2.40% | 2.98% | 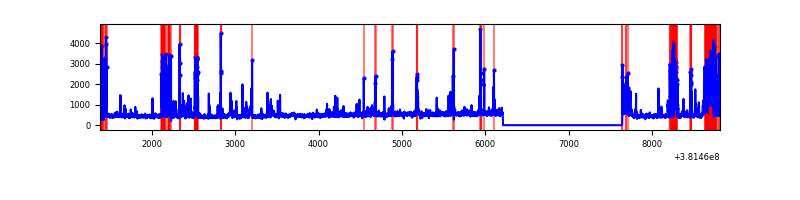 |
| C | 7443 | 6011 | 32 | 32 | 0.43% | 0.53% | 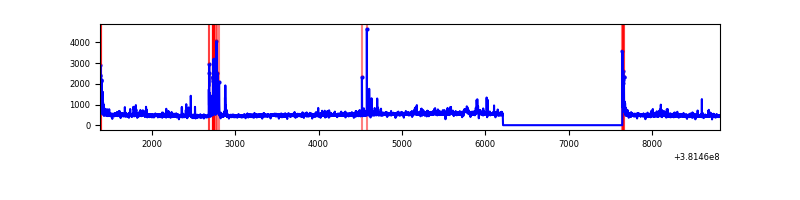 |
| D | 7443 | 6011 | 210 | 210 | 2.82% | 3.49% | 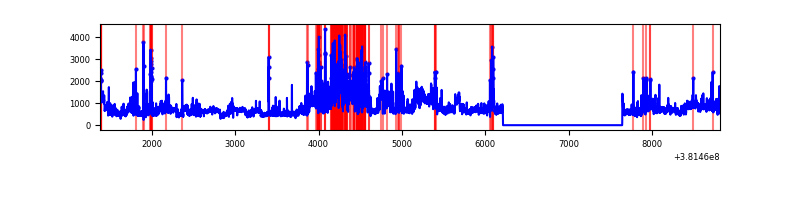 |
Top three noisy pixels from each quadrant. If the there are fewer than three noisy pixels in the level2.evt file, extra rows are filled as -1
| Pixel properties | Quadrant properties | ||||||
|---|---|---|---|---|---|---|---|
| Quadrant | DetID | PixID | Counts | Sigma | Mean | Median | Sigma |
| A | 10 | 83 | 30312 | 211.99 | 696 | 683 | 139.8 |
| A | 13 | 6 | 12386 | 83.73 | 696 | 683 | 139.8 |
| A | 13 | 254 | 9189 | 60.86 | 696 | 683 | 139.8 |
| B | 5 | 172 | 907979 | 6840.27 | 682 | 665 | 132.6 |
| B | 0 | 229 | 48615 | 361.5 | 682 | 665 | 132.6 |
| B | 4 | 251 | 29584 | 218.02 | 682 | 665 | 132.6 |
| C | 15 | 214 | 252447 | 1597.22 | 678 | 685 | 157.6 |
| C | 14 | 254 | 192423 | 1216.41 | 678 | 685 | 157.6 |
| C | 0 | 10 | 67539 | 424.13 | 678 | 685 | 157.6 |
| D | 8 | 195 | 855591 | 5176.65 | 669 | 649 | 165.2 |
| D | 12 | 235 | 764584 | 4625.61 | 669 | 649 | 165.2 |
| D | 10 | 118 | 543270 | 3285.56 | 669 | 649 | 165.2 |
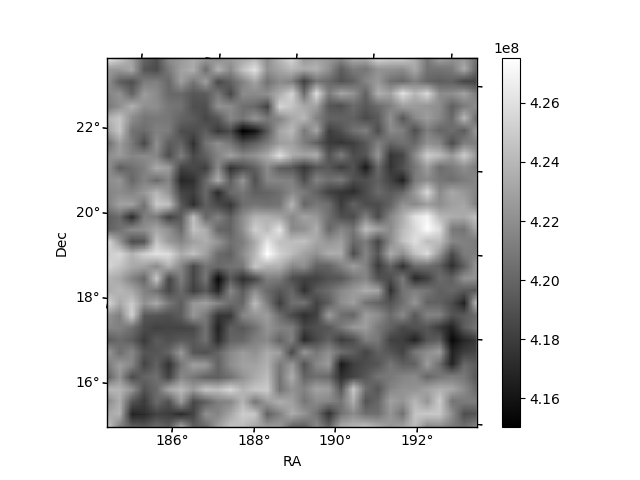
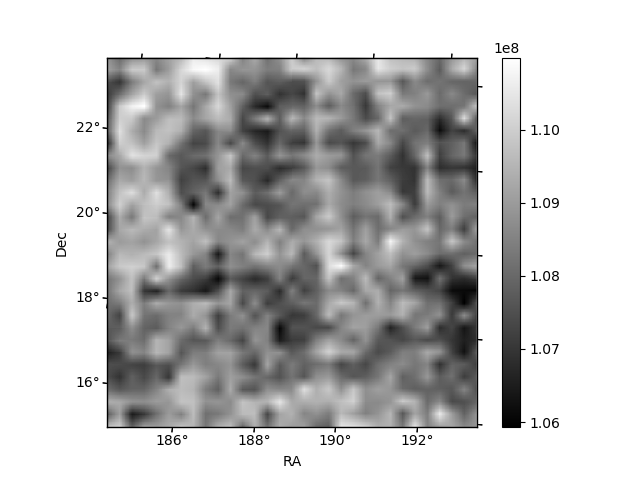
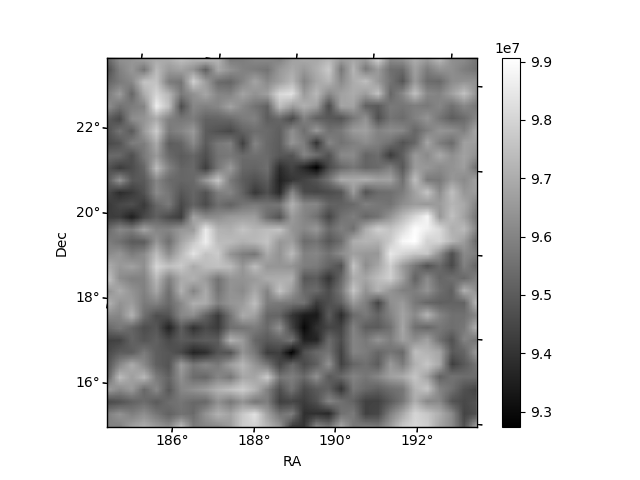
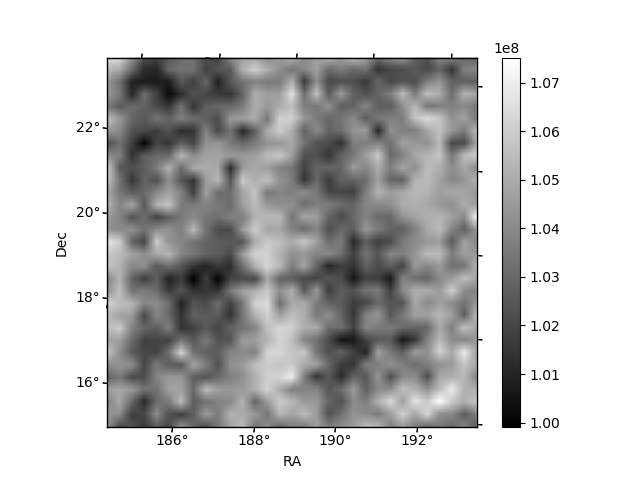
Histogram calculated using DETX and DETY for each event in the final _common_clean file
| Quadrant A | 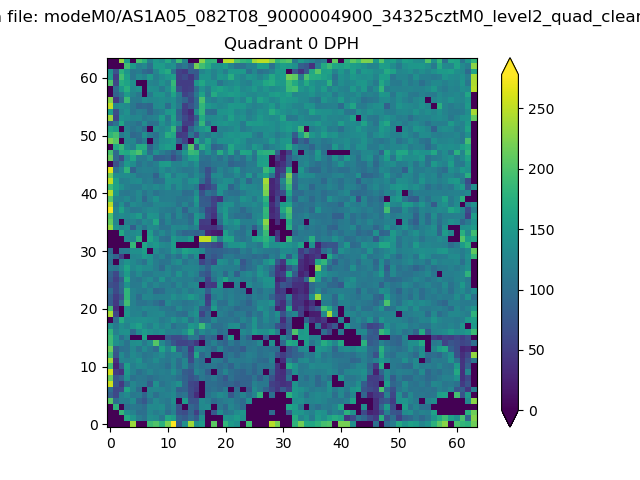 |
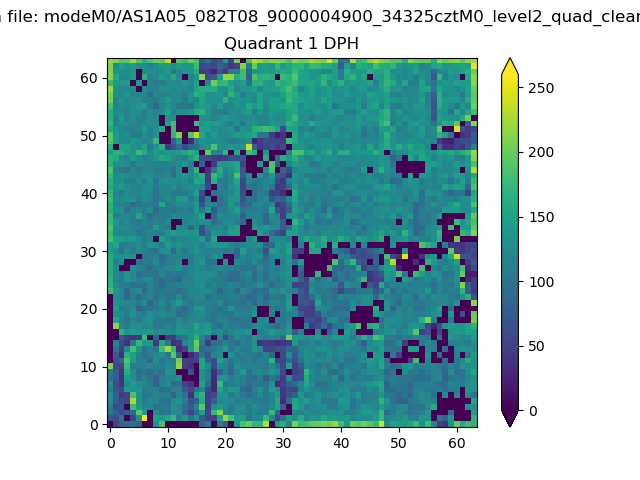 |
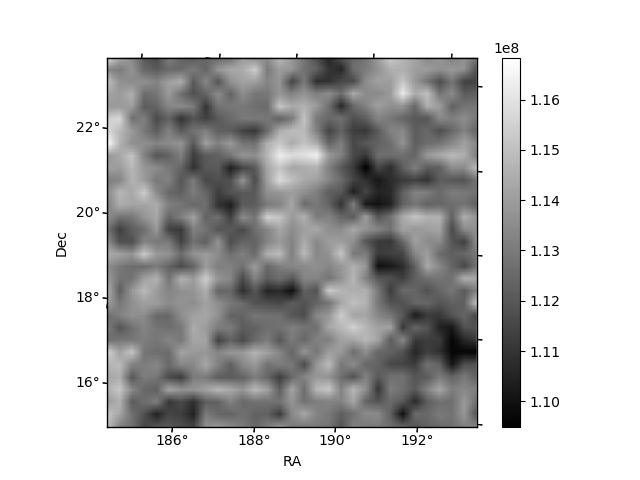
Quadrant B |
|---|---|---|---|
| Quadrant D | 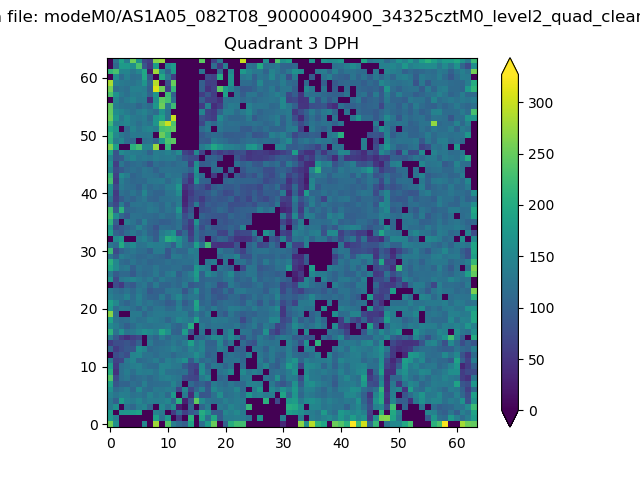 |
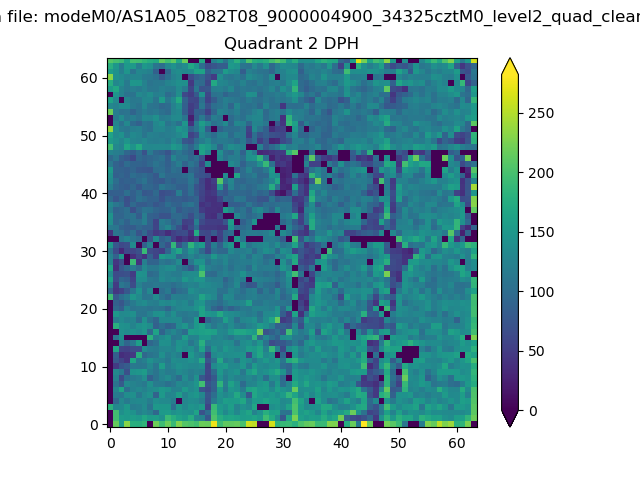 |
Quadrant C |
| Plot type | Count rate plots | Images |
|---|---|---|
| Comparison with Poisson distribution Blue bars denote a histogram of data divided into 1 sec bins. Red curve is a Poisson curve with rate = median count rate of data. |
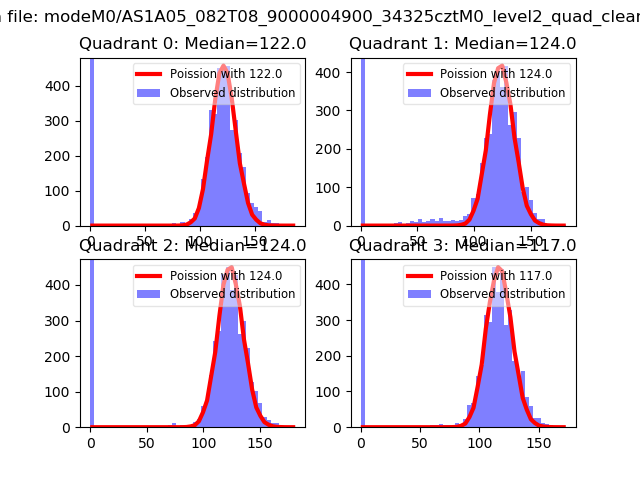 |
 |
| Quadrant-wise count rates Data is divided into 100 sec bins |
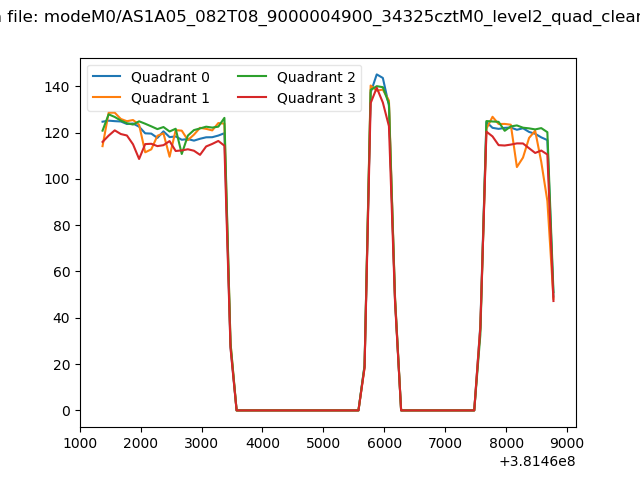 |
|
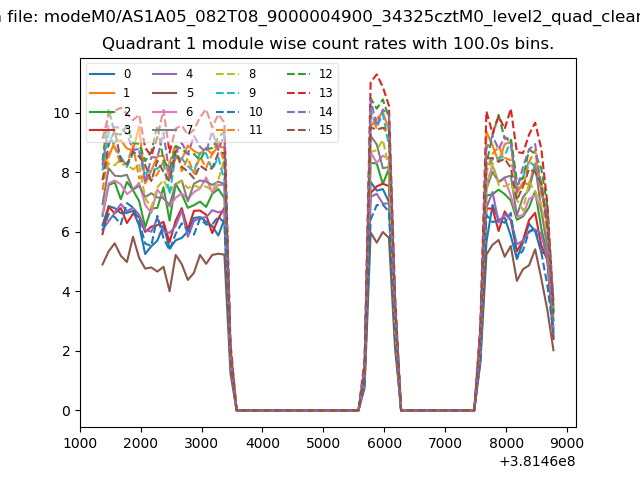
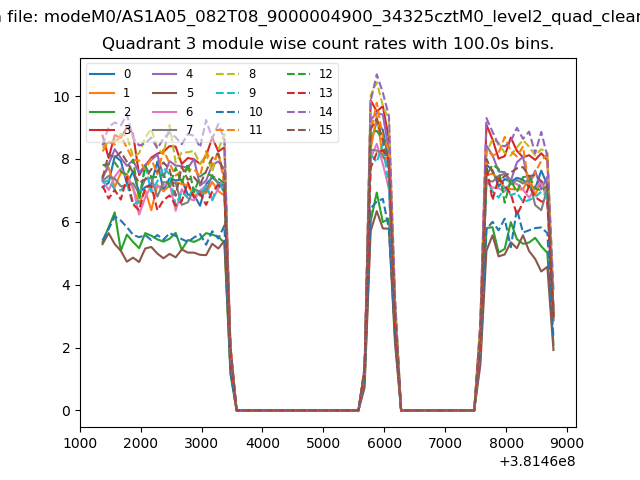
| Module-wise count rates for Quadrant A Data is divided into 100 sec bins |
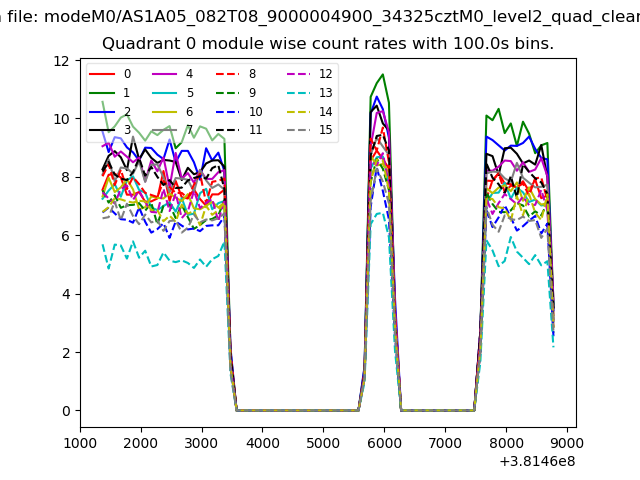 |
 |
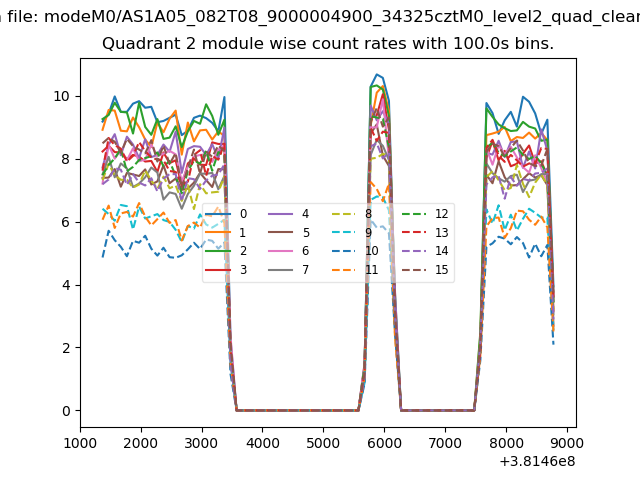
| Module-wise count rates for Quadrant B Data is divided into 100 sec bins |
 |
 |
| Module-wise count rates for Quadrant C Data is divided into 100 sec bins |
 |
 |
| Module-wise count rates for Quadrant D Data is divided into 100 sec bins |
 |
 |
| Parameter | Plot |
|---|---|
| CZT HV Monitor | 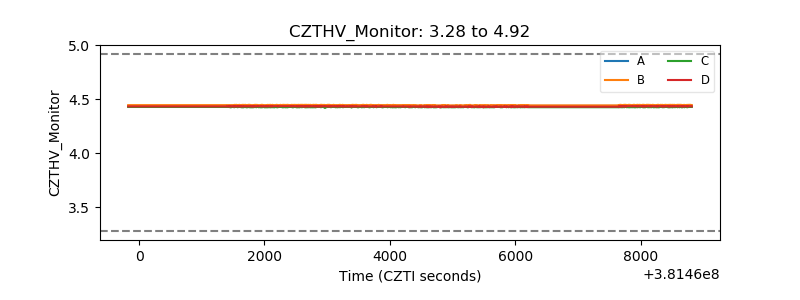 |
| D_VDD | 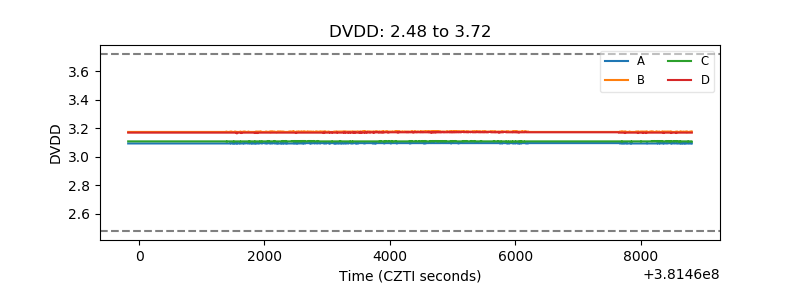 |
| Temperature 1 | 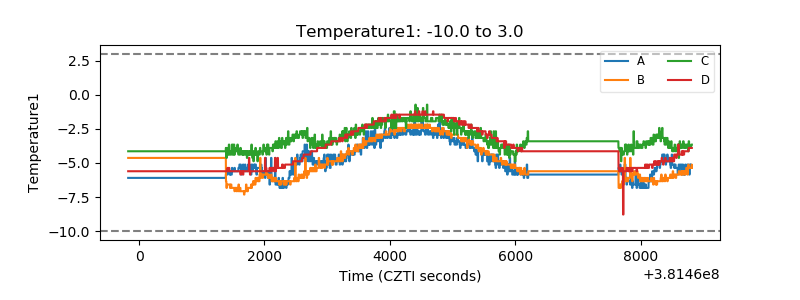 |
| Veto HV Monitor | 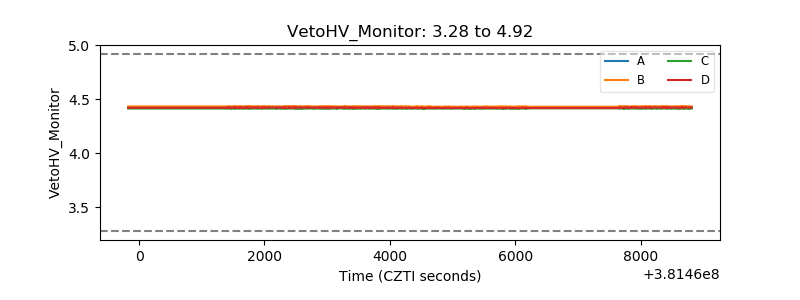 |
| Veto LLD | 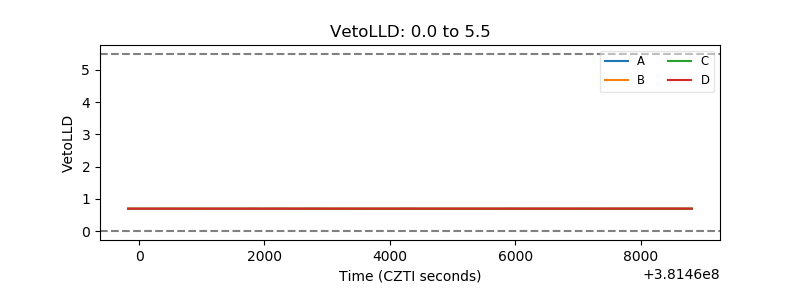 |
| Alpha Counter | 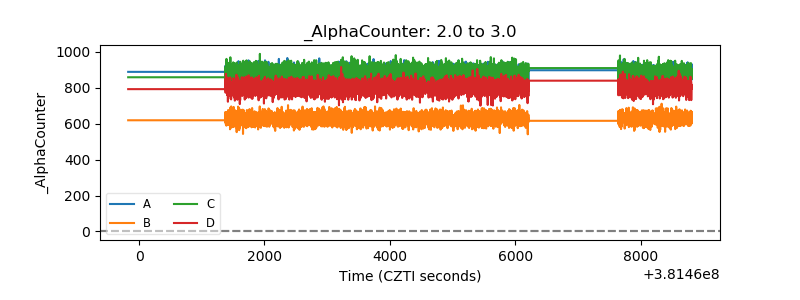 |
| _CPM_Rate | 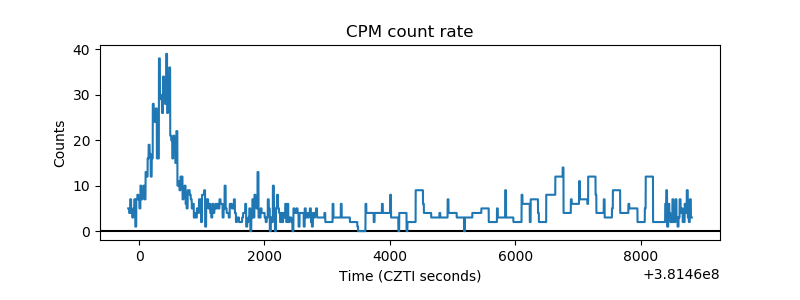 |
| CZT Counter | 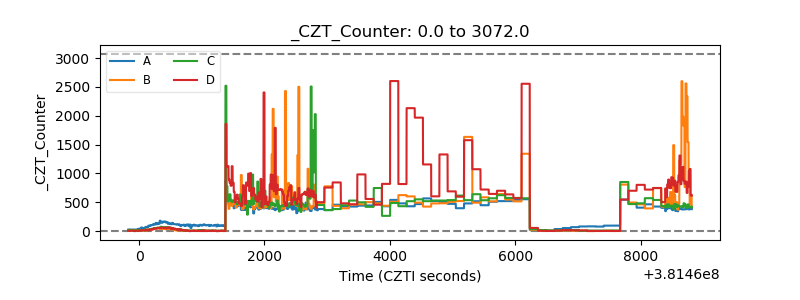 |
| +2.5 Volts monitor |  |
| +5 Volts monitor |  |
| _ROLL_ROT | 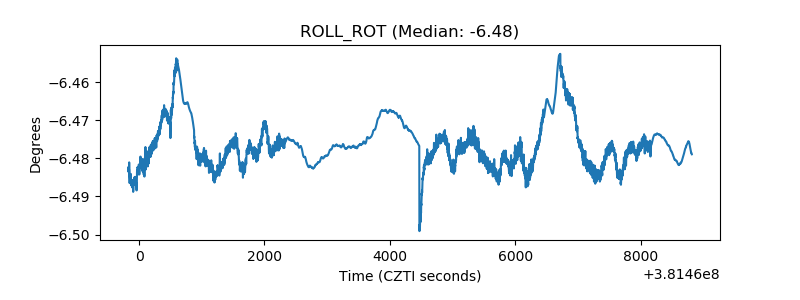 |
| _Roll_DEC | 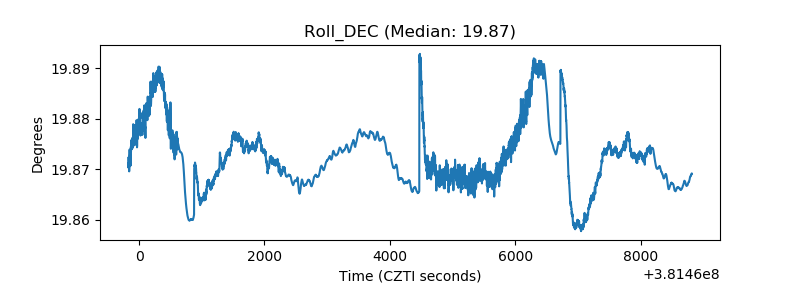 |
| _Roll_RA | 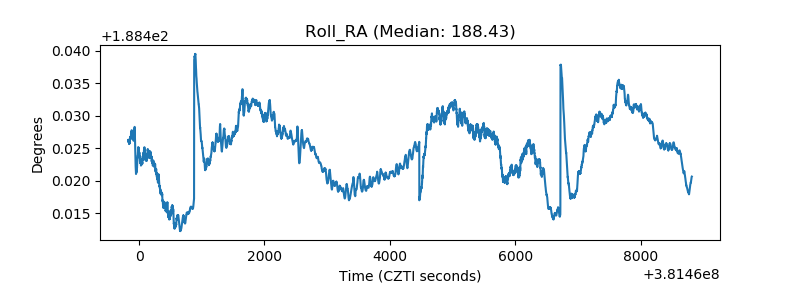 |
| Veto Counter | 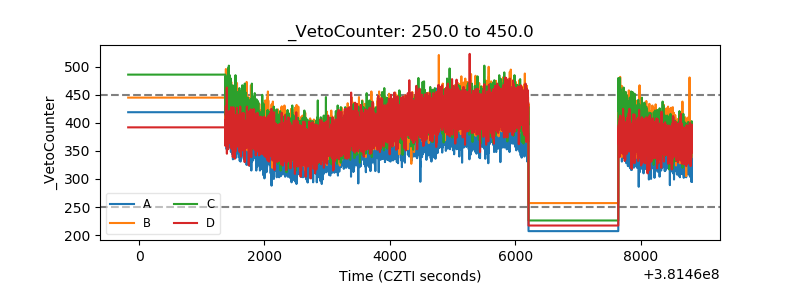 |