| Param | Original file | Final file |
|---|---|---|
| Filename | modeM0/AS1C07_001T05_9000004902cztM0_level2.fits | modeM0/AS1C07_001T05_9000004902cztM0_level2_quad_clean.evt |
| Size (bytes) | 770,952,960 | 994,104,000 |
| Size | 735.2 MB | 948.1 MB |
| Events in quadrant A | 4,756,654 | 6,514,442 |
| Events in quadrant B | 4,490,374 | 6,453,318 |
| Events in quadrant C | 4,665,078 | 6,218,693 |
| Events in quadrant D | 3,819,752 | 5,310,288 |
| Mode SS | |||
|---|---|---|---|
| Quadrant | BADHDUFLAG | Total packets | Discarded packets |
| A | 0 | 1668 | 0 |
| B | 0 | 1668 | 0 |
| C | 0 | 1668 | 0 |
| D | 0 | 1668 | 0 |
| Mode M9 | |||
|---|---|---|---|
| Quadrant | BADHDUFLAG | Total packets | Discarded packets |
| A | 0 | 288 | 0 |
| B | 0 | 288 | 0 |
| C | 0 | 288 | 0 |
| D | 0 | 289 | 0 |
| Mode M0 | |||
|---|---|---|---|
| Quadrant | BADHDUFLAG | Total packets | Discarded packets |
| A | 0 | 166081 | 0 |
| B | 0 | 192464 | 0 |
| C | 0 | 189293 | 0 |
| D | 0 | 309935 | 0 |
| Quadrant | Total seconds | Saturated seconds | Saturation percentage |
|---|---|---|---|
| A | 81881 | 97 | 0.118465% |
| B | 81881 | 1792 | 2.188542% |
| C | 81881 | 1469 | 1.794067% |
| D | 81881 | 8385 | 10.240471% |
Noise dominated data is calculated using 1-second bins in cleaned event files. If a bin has >2000 counts, and if more than 50% of those come from <1% of pixels, then it is considered to be noise-dominated and hence unusable.
| Quadrant | # 1 sec bins | Bins with >0 counts | Bins with >2000 counts | High rate bins dominated by noise | Noise dominated (total time) | Noise dominated (detector-on time) | Marked lightcurve |
|---|---|---|---|---|---|---|---|
| A | 109985 | 81880 | 0 | 0 | 0.00% | 0.00% |  |
| B | 109985 | 81864 | 0 | 0 | 0.00% | 0.00% |  |
| C | 109985 | 81866 | 0 | 0 | 0.00% | 0.00% |  |
| D | 109985 | 81847 | 0 | 0 | 0.00% | 0.00% |  |
Top three noisy pixels from each quadrant. If the there are fewer than three noisy pixels in the level2.evt file, extra rows are filled as -1
| Pixel properties | Quadrant properties | ||||||
|---|---|---|---|---|---|---|---|
| Quadrant | DetID | PixID | Counts | Sigma | Mean | Median | Sigma |
| A | 9 | 19 | 3990 | 9.3 | 1239 | 1165 | 303.9 |
| A | 0 | 29 | 3818 | 8.73 | 1239 | 1165 | 303.9 |
| A | 7 | 110 | 3817 | 8.73 | 1239 | 1165 | 303.9 |
| B | 2 | 9 | 4070 | 12.69 | 1191 | 1139 | 230.9 |
| B | 3 | 80 | 3598 | 10.65 | 1191 | 1139 | 230.9 |
| B | 2 | 8 | 3318 | 9.44 | 1191 | 1139 | 230.9 |
| C | 1 | 81 | 3920 | 8.8 | 1233 | 1164 | 313.2 |
| C | 1 | 80 | 3850 | 8.58 | 1233 | 1164 | 313.2 |
| C | 3 | 202 | 3673 | 8.01 | 1233 | 1164 | 313.2 |
| D | 10 | 189 | 2813 | 6.3 | 1093 | 1002 | 287.6 |
| D | 10 | 113 | 2777 | 6.17 | 1093 | 1002 | 287.6 |
| D | 7 | 3 | 2773 | 6.16 | 1093 | 1002 | 287.6 |
Histogram calculated using DETX and DETY for each event in the final _common_clean file
| Quadrant A | 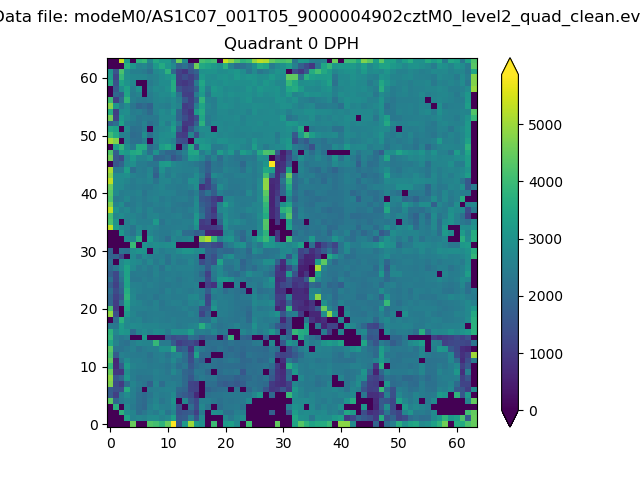 |
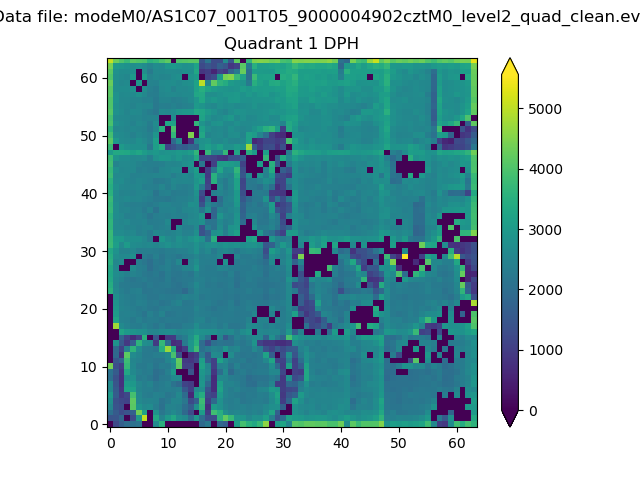 |
Quadrant B |
|---|---|---|---|
| Quadrant D | 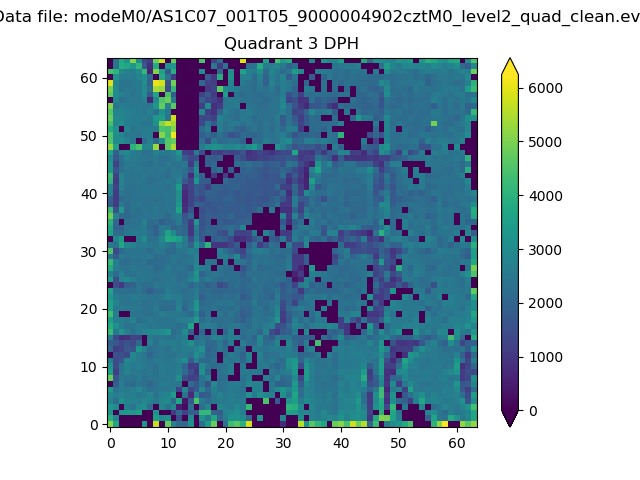 |
 |
Quadrant C |
| Plot type | Count rate plots | Images |
|---|---|---|
| Comparison with Poisson distribution Blue bars denote a histogram of data divided into 1 sec bins. Red curve is a Poisson curve with rate = median count rate of data. |
 |
 |
| Quadrant-wise count rates Data is divided into 100 sec bins |
 |
|
| Module-wise count rates for Quadrant A Data is divided into 100 sec bins |
 |
 |
| Module-wise count rates for Quadrant B Data is divided into 100 sec bins |
 |
 |
| Module-wise count rates for Quadrant C Data is divided into 100 sec bins |
 |
 |
| Module-wise count rates for Quadrant D Data is divided into 100 sec bins |
 |
 |
| Parameter | Plot |
|---|---|
| CZT HV Monitor |  |
| D_VDD | 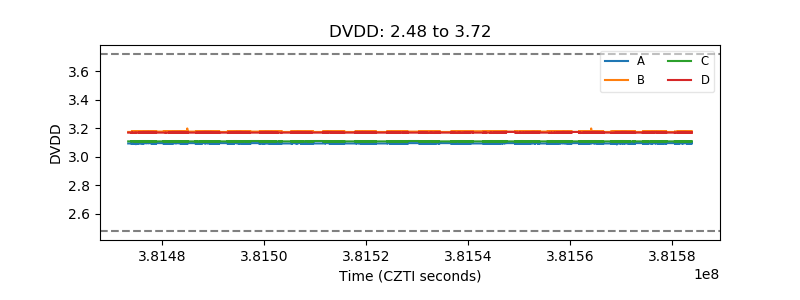 |
| Temperature 1 | 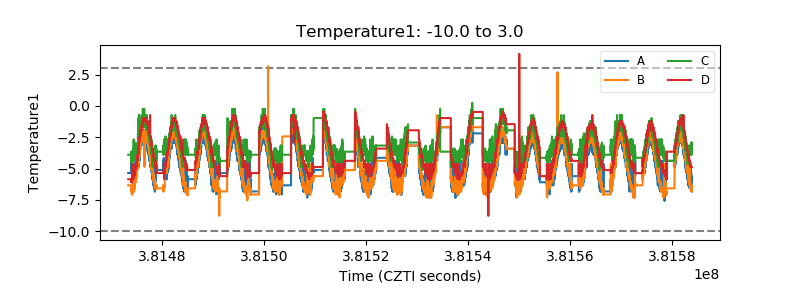 |
| Veto HV Monitor |  |
| Veto LLD |  |
| Alpha Counter |  |
| _CPM_Rate |  |
| CZT Counter |  |
| +2.5 Volts monitor |  |
| +5 Volts monitor |  |
| _ROLL_ROT |  |
| _Roll_DEC |  |
| _Roll_RA |  |
| Veto Counter |  |