| Param | Original file | Final file |
|---|---|---|
| Filename | modeM0/AS1C07_001T05_9000004902_34339cztM0_level2.evt | modeM0/AS1C07_001T05_9000004902_34339cztM0_level2_quad_clean.evt |
| Size (bytes) | 549,106,560 | 95,561,280 |
| Size | 523.7 MB | 91.1 MB |
| Events in quadrant A | 2,544,405 | 640,047 |
| Events in quadrant B | 3,139,272 | 648,898 |
| Events in quadrant C | 2,986,463 | 648,803 |
| Events in quadrant D | 7,571,074 | 555,062 |
| Mode SS | |||
|---|---|---|---|
| Quadrant | BADHDUFLAG | Total packets | Discarded packets |
| A | 0 | 116 | 0 |
| B | 0 | 116 | 0 |
| C | 0 | 116 | 0 |
| D | 0 | 116 | 0 |
| Mode M9 | |||
|---|---|---|---|
| Quadrant | BADHDUFLAG | Total packets | Discarded packets |
| A | 0 | 28 | 0 |
| B | 0 | 28 | 0 |
| C | 0 | 28 | 0 |
| D | 0 | 29 | 0 |
| Mode M0 | |||
|---|---|---|---|
| Quadrant | BADHDUFLAG | Total packets | Discarded packets |
| A | 0 | 11678 | 3 |
| B | 0 | 13281 | 2 |
| C | 0 | 12484 | 2 |
| D | 0 | 26377 | 2 |
| Quadrant | Total seconds | Saturated seconds | Saturation percentage |
|---|---|---|---|
| A | 5734 | 23 | 0.401116% |
| B | 5734 | 110 | 1.918382% |
| C | 5734 | 63 | 1.098709% |
| D | 5734 | 1517 | 26.456226% |
Noise dominated data is calculated using 1-second bins in cleaned event files. If a bin has >2000 counts, and if more than 50% of those come from <1% of pixels, then it is considered to be noise-dominated and hence unusable.
| Quadrant | # 1 sec bins | Bins with >0 counts | Bins with >2000 counts | High rate bins dominated by noise | Noise dominated (total time) | Noise dominated (detector-on time) | Marked lightcurve |
|---|---|---|---|---|---|---|---|
| A | 7317 | 5735 | 13 | 13 | 0.18% | 0.23% | 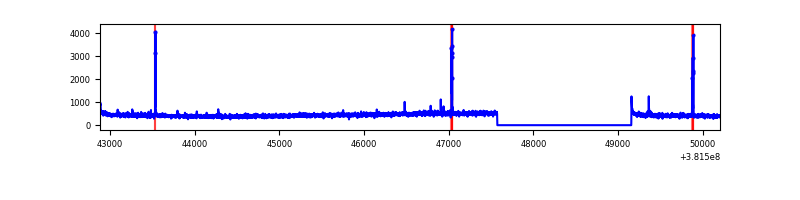 |
| B | 7317 | 5735 | 52 | 52 | 0.71% | 0.91% | 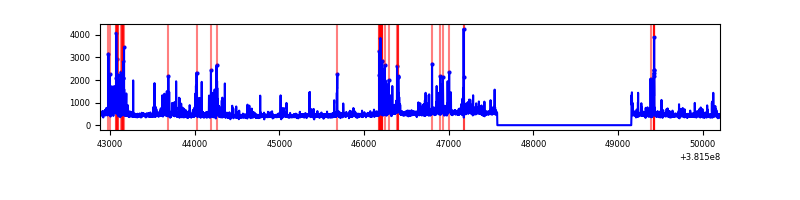 |
| C | 7317 | 5735 | 48 | 48 | 0.66% | 0.84% | 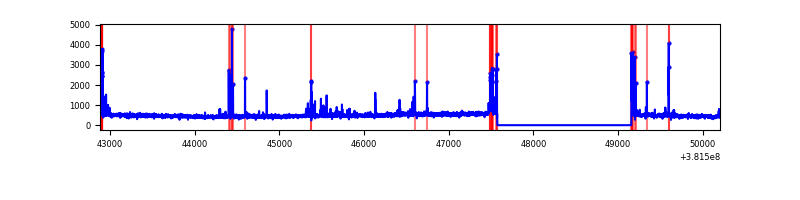 |
| D | 7317 | 5735 | 1387 | 1387 | 18.96% | 24.18% | 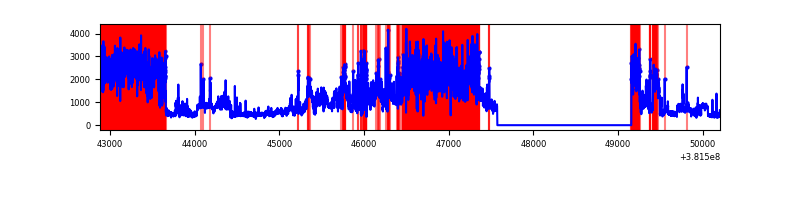 |
Top three noisy pixels from each quadrant. If the there are fewer than three noisy pixels in the level2.evt file, extra rows are filled as -1
| Pixel properties | Quadrant properties | ||||||
|---|---|---|---|---|---|---|---|
| Quadrant | DetID | PixID | Counts | Sigma | Mean | Median | Sigma |
| A | 9 | 143 | 57577 | 447.08 | 634 | 620 | 127.4 |
| A | 10 | 83 | 29942 | 230.16 | 634 | 620 | 127.4 |
| A | 13 | 254 | 8301 | 60.29 | 634 | 620 | 127.4 |
| B | 5 | 172 | 356830 | 2929.47 | 634 | 618 | 121.6 |
| B | 0 | 219 | 111584 | 912.58 | 634 | 618 | 121.6 |
| B | 4 | 171 | 95505 | 780.35 | 634 | 618 | 121.6 |
| C | 15 | 214 | 241506 | 1677.82 | 622 | 627 | 143.6 |
| C | 14 | 254 | 168551 | 1169.66 | 622 | 627 | 143.6 |
| C | 0 | 10 | 101793 | 704.66 | 622 | 627 | 143.6 |
| D | 12 | 235 | 2385502 | 17730.91 | 556 | 541 | 134.5 |
| D | 12 | 227 | 1759644 | 13077.99 | 556 | 541 | 134.5 |
| D | 8 | 195 | 879591 | 6535.27 | 556 | 541 | 134.5 |
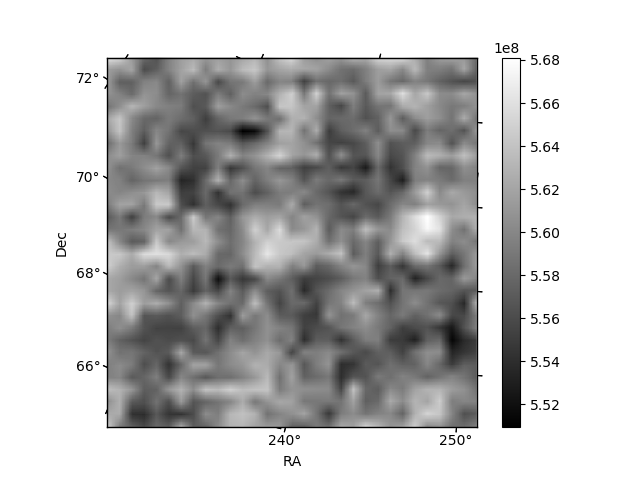
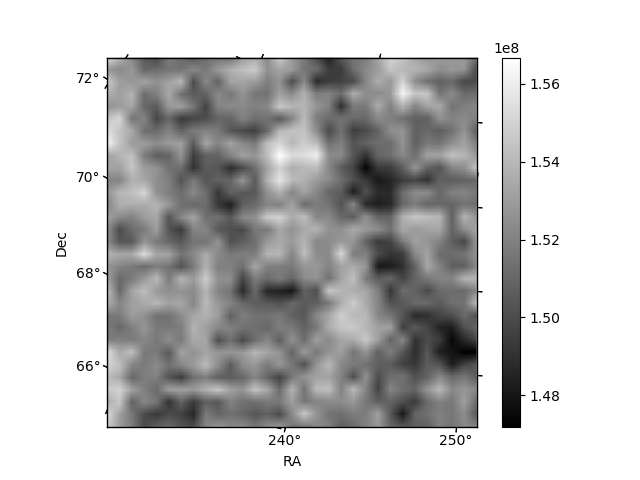
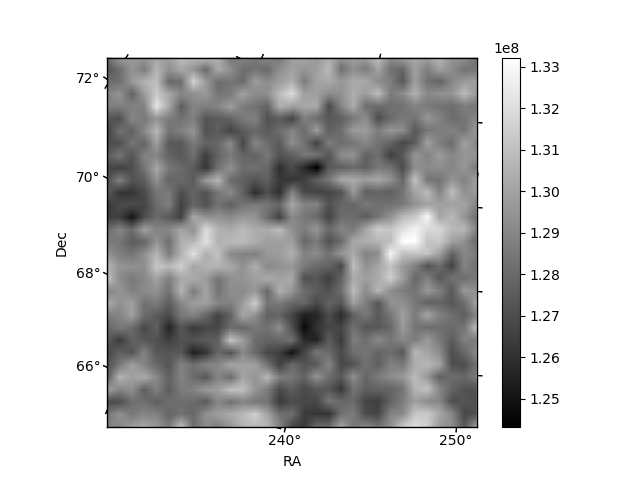
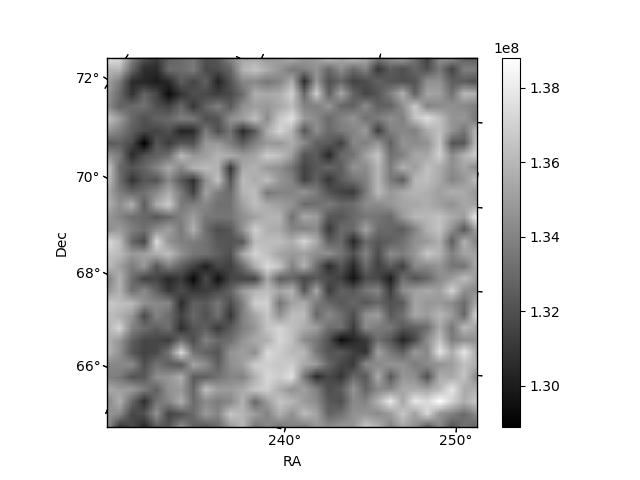
Histogram calculated using DETX and DETY for each event in the final _common_clean file
| Quadrant A | 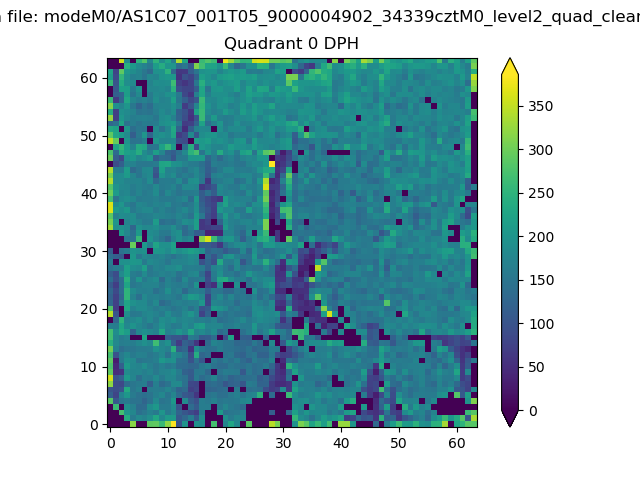 |
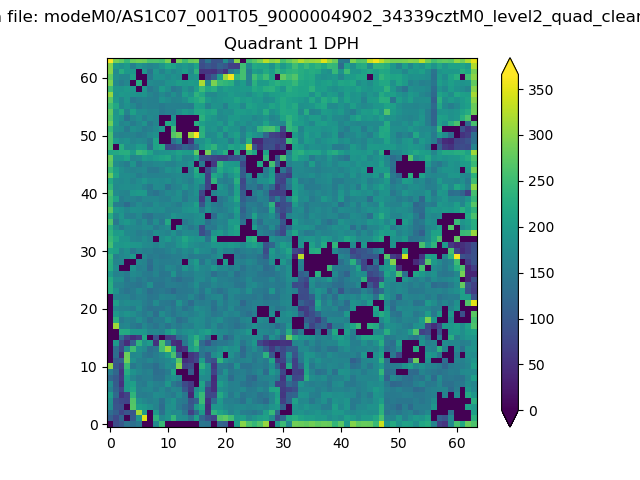 |
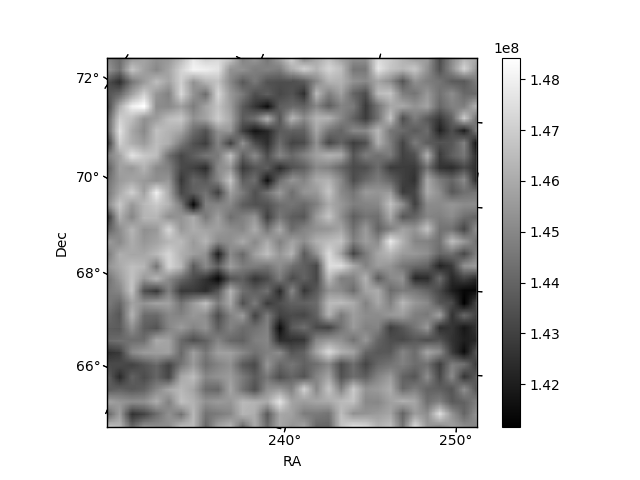
Quadrant B |
|---|---|---|---|
| Quadrant D | 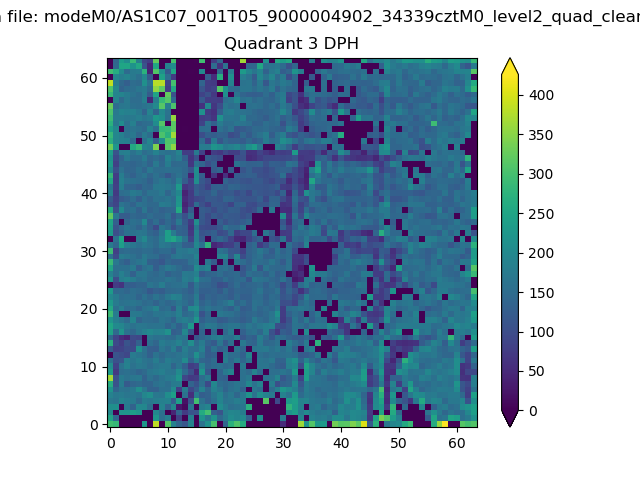 |
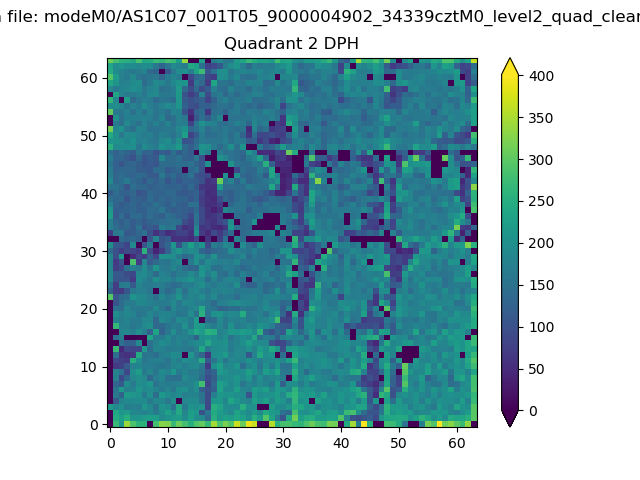 |
Quadrant C |
| Plot type | Count rate plots | Images |
|---|---|---|
| Comparison with Poisson distribution Blue bars denote a histogram of data divided into 1 sec bins. Red curve is a Poisson curve with rate = median count rate of data. |
 |
 |
| Quadrant-wise count rates Data is divided into 100 sec bins |
 |
|
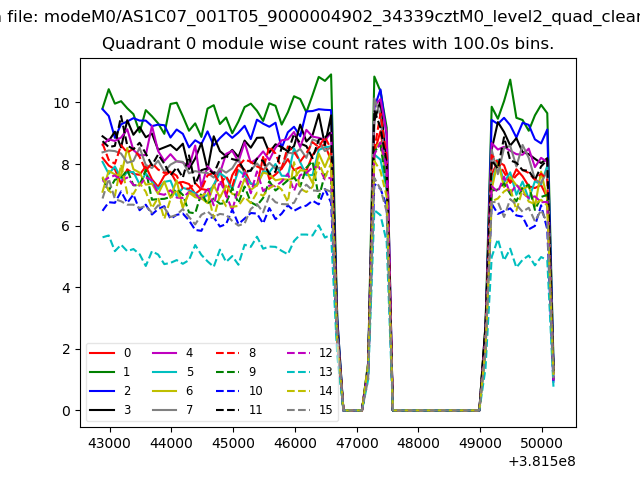
| Module-wise count rates for Quadrant A Data is divided into 100 sec bins |
 |
 |
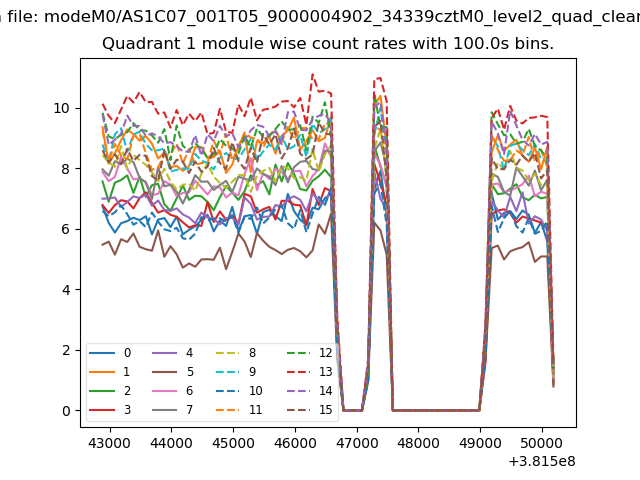
| Module-wise count rates for Quadrant B Data is divided into 100 sec bins |
 |
 |
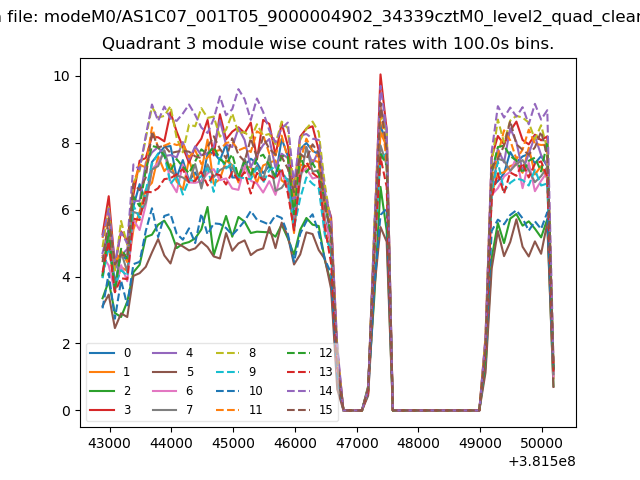
| Module-wise count rates for Quadrant C Data is divided into 100 sec bins |
 |
 |
| Module-wise count rates for Quadrant D Data is divided into 100 sec bins |
 |
 |
| Parameter | Plot |
|---|---|
| CZT HV Monitor | 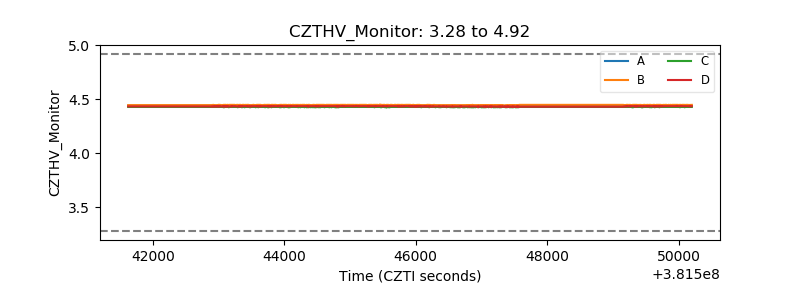 |
| D_VDD | 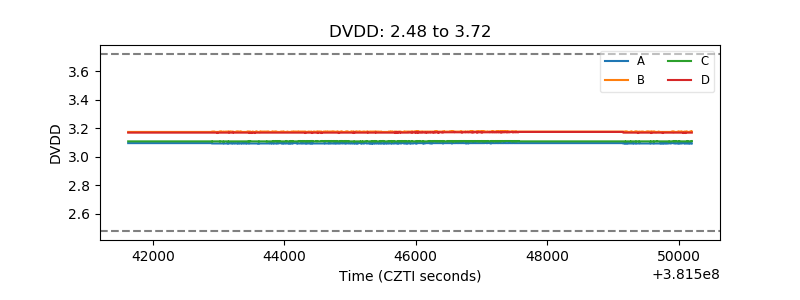 |
| Temperature 1 | 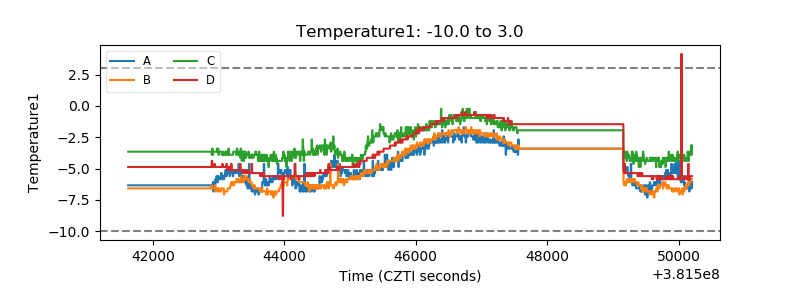 |
| Veto HV Monitor | 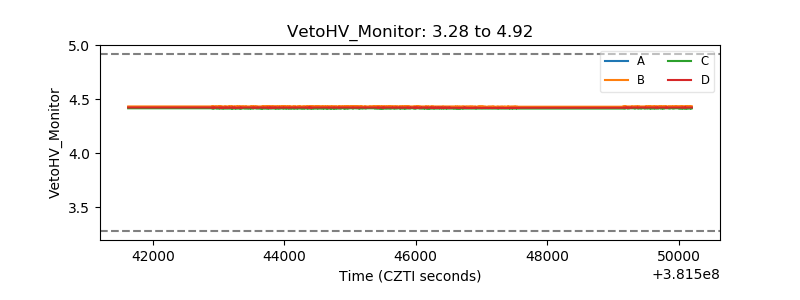 |
| Veto LLD | 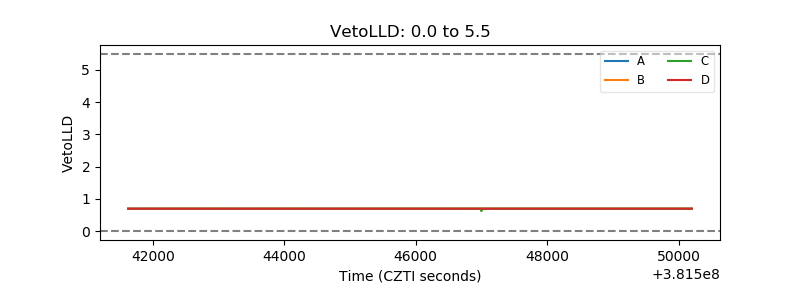 |
| Alpha Counter |  |
| _CPM_Rate | 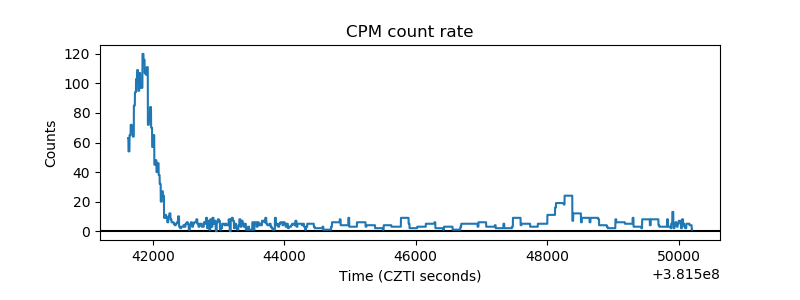 |
| CZT Counter | 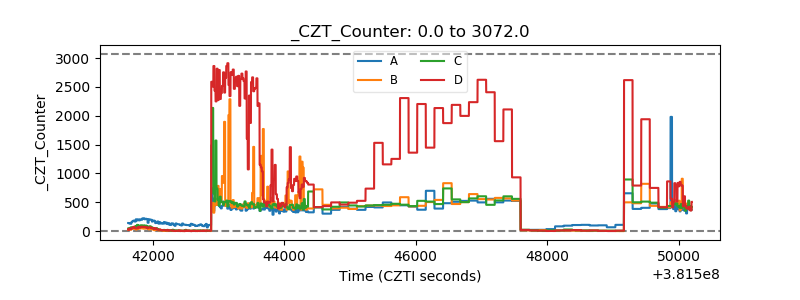 |
| +2.5 Volts monitor |  |
| +5 Volts monitor |  |
| _ROLL_ROT | 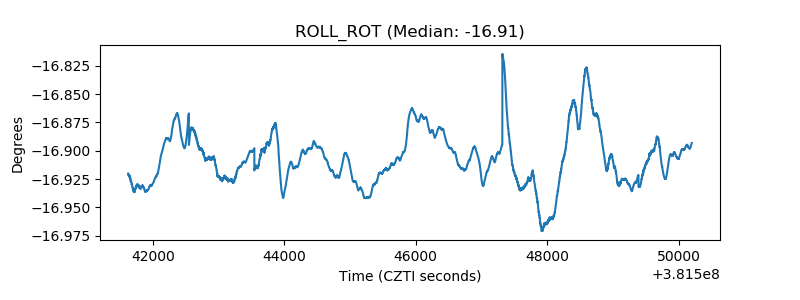 |
| _Roll_DEC | 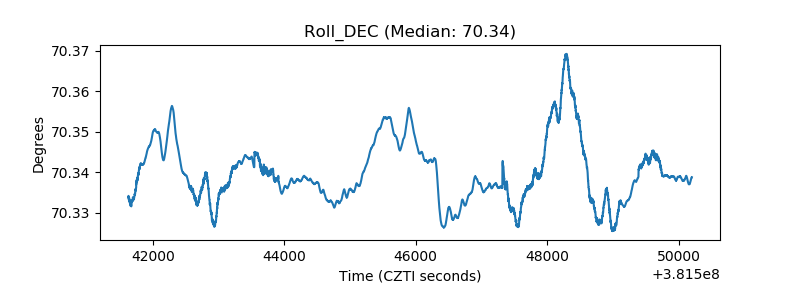 |
| _Roll_RA | 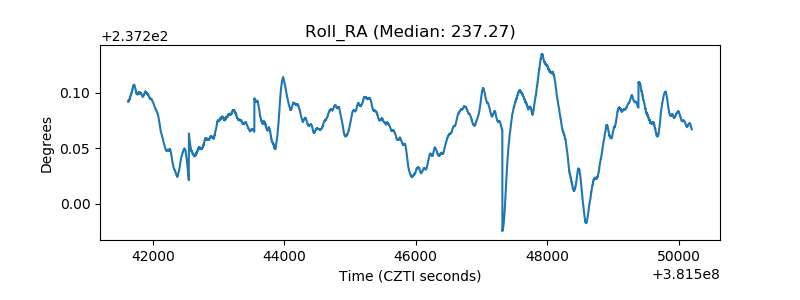 |
| Veto Counter | 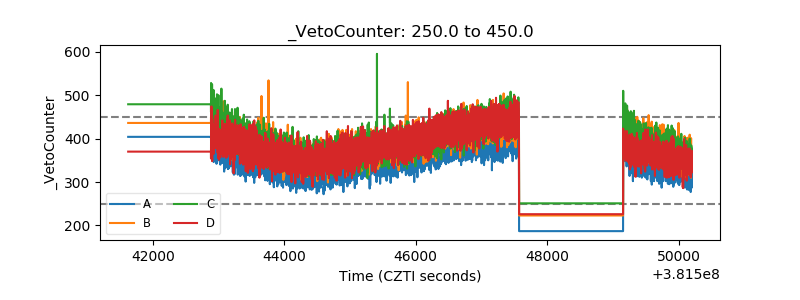 |