| Param | Original file | Final file |
|---|---|---|
| Filename | modeM0/AS1C07_001T05_9000004902_34343cztM0_level2.evt | modeM0/AS1C07_001T05_9000004902_34343cztM0_level2_quad_clean.evt |
| Size (bytes) | 840,234,240 | 177,396,480 |
| Size | 801.3 MB | 169.2 MB |
| Events in quadrant A | 4,741,746 | 1,178,235 |
| Events in quadrant B | 5,508,623 | 1,191,473 |
| Events in quadrant C | 6,326,742 | 1,163,452 |
| Events in quadrant D | 8,154,772 | 1,107,928 |
| Mode SS | |||
|---|---|---|---|
| Quadrant | BADHDUFLAG | Total packets | Discarded packets |
| A | 0 | 214 | 0 |
| B | 0 | 214 | 0 |
| C | 0 | 214 | 0 |
| D | 0 | 214 | 0 |
| Mode M9 | |||
|---|---|---|---|
| Quadrant | BADHDUFLAG | Total packets | Discarded packets |
| A | 0 | 29 | 0 |
| B | 0 | 29 | 0 |
| C | 0 | 29 | 0 |
| D | 0 | 29 | 0 |
| Mode M0 | |||
|---|---|---|---|
| Quadrant | BADHDUFLAG | Total packets | Discarded packets |
| A | 0 | 21249 | 3 |
| B | 0 | 23216 | 2 |
| C | 0 | 25279 | 2 |
| D | 0 | 31414 | 2 |
| Quadrant | Total seconds | Saturated seconds | Saturation percentage |
|---|---|---|---|
| A | 10575 | 9 | 0.085106% |
| B | 10575 | 152 | 1.437352% |
| C | 10575 | 277 | 2.619385% |
| D | 10575 | 531 | 5.021277% |
Noise dominated data is calculated using 1-second bins in cleaned event files. If a bin has >2000 counts, and if more than 50% of those come from <1% of pixels, then it is considered to be noise-dominated and hence unusable.
| Quadrant | # 1 sec bins | Bins with >0 counts | Bins with >2000 counts | High rate bins dominated by noise | Noise dominated (total time) | Noise dominated (detector-on time) | Marked lightcurve |
|---|---|---|---|---|---|---|---|
| A | 13350 | 10577 | 0 | 0 | 0.00% | 0.00% | 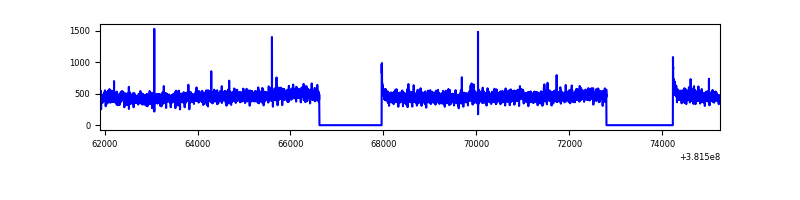 |
| B | 13350 | 10577 | 97 | 97 | 0.73% | 0.92% | 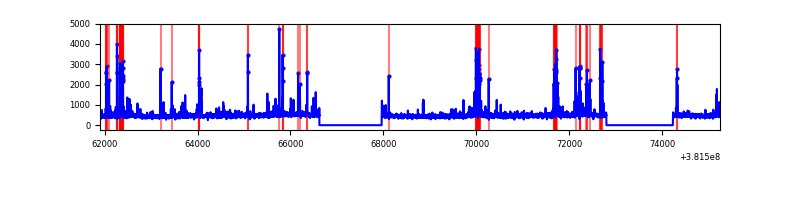 |
| C | 13350 | 10577 | 225 | 225 | 1.69% | 2.13% | 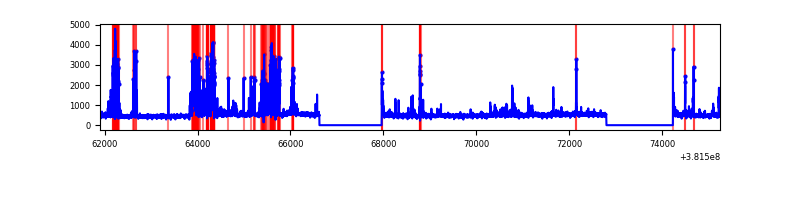 |
| D | 13350 | 10577 | 468 | 468 | 3.51% | 4.42% | 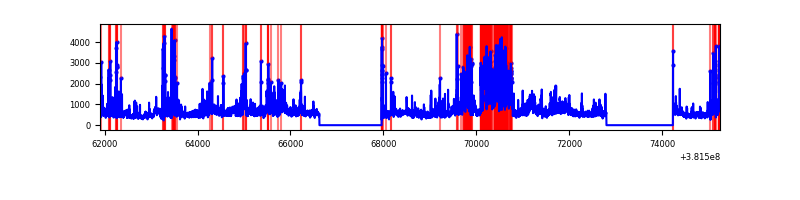 |
Top three noisy pixels from each quadrant. If the there are fewer than three noisy pixels in the level2.evt file, extra rows are filled as -1
| Pixel properties | Quadrant properties | ||||||
|---|---|---|---|---|---|---|---|
| Quadrant | DetID | PixID | Counts | Sigma | Mean | Median | Sigma |
| A | 10 | 83 | 37807 | 152.76 | 1208 | 1186 | 239.7 |
| A | 13 | 6 | 33453 | 134.6 | 1208 | 1186 | 239.7 |
| A | 13 | 254 | 16603 | 64.31 | 1208 | 1186 | 239.7 |
| B | 5 | 172 | 468784 | 2042.92 | 1194 | 1162 | 228.9 |
| B | 5 | 255 | 146889 | 636.64 | 1194 | 1162 | 228.9 |
| B | 4 | 251 | 79474 | 342.13 | 1194 | 1162 | 228.9 |
| C | 14 | 254 | 1195346 | 4477.91 | 1161 | 1168 | 266.7 |
| C | 15 | 214 | 437960 | 1637.87 | 1161 | 1168 | 266.7 |
| C | 15 | 159 | 51103 | 187.24 | 1161 | 1168 | 266.7 |
| D | 12 | 235 | 1856990 | 6583.98 | 1155 | 1122 | 281.9 |
| D | 8 | 195 | 865887 | 3067.89 | 1155 | 1122 | 281.9 |
| D | 12 | 227 | 355695 | 1257.9 | 1155 | 1122 | 281.9 |
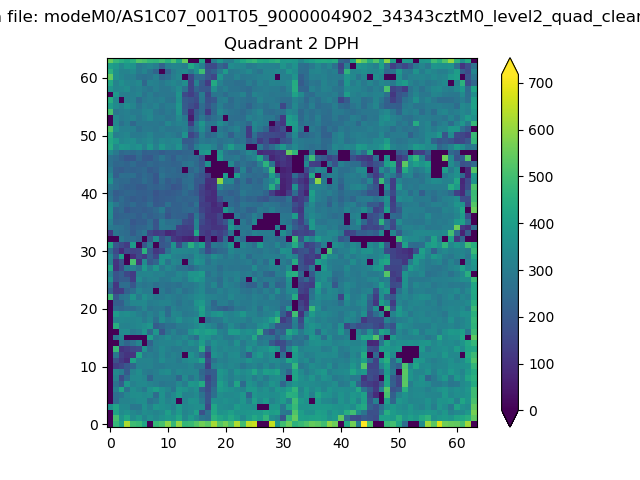
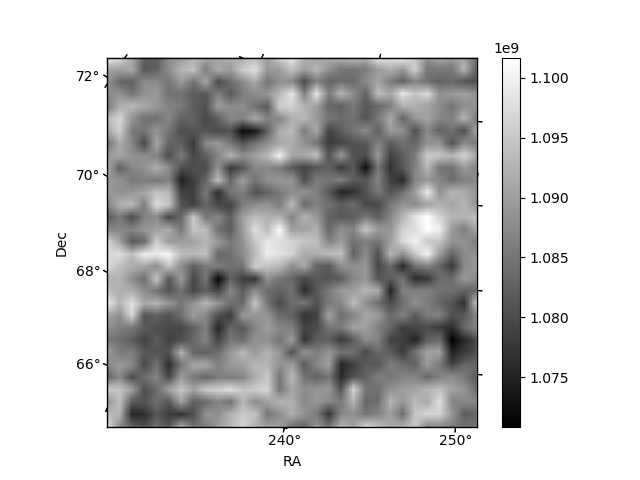
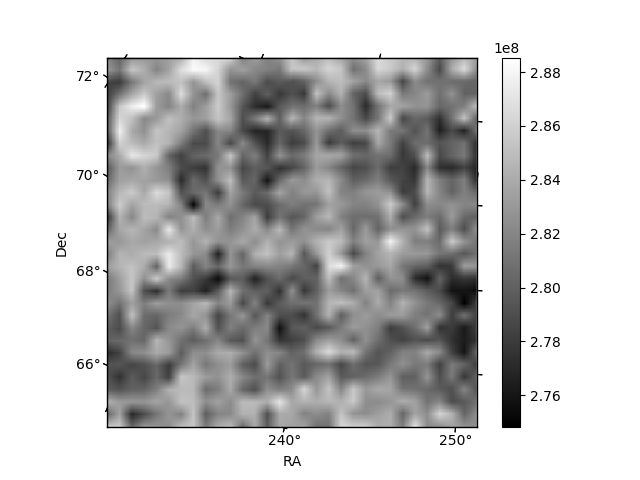
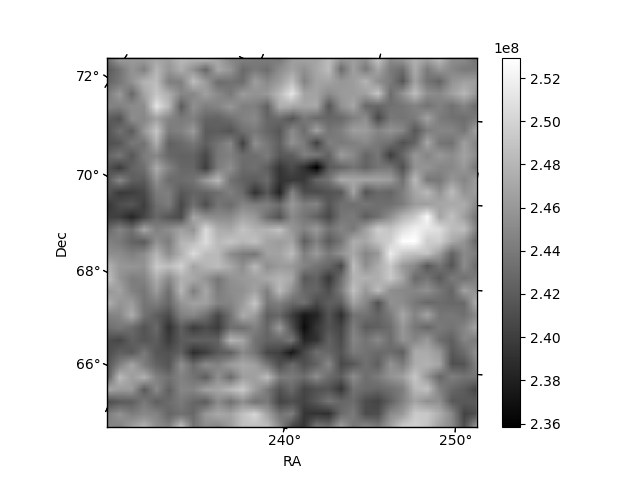
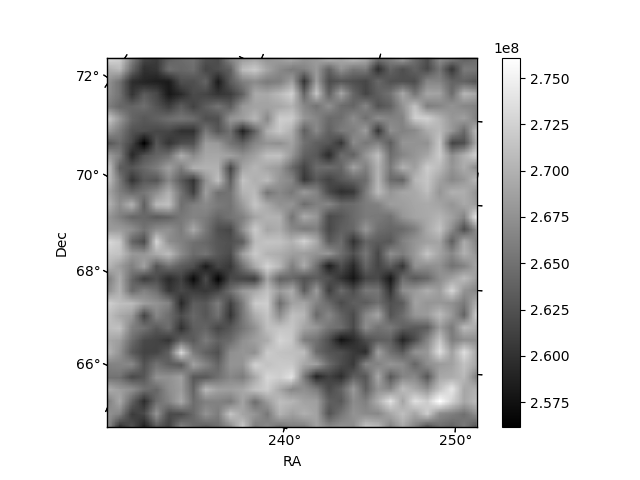
Histogram calculated using DETX and DETY for each event in the final _common_clean file
| Quadrant A | 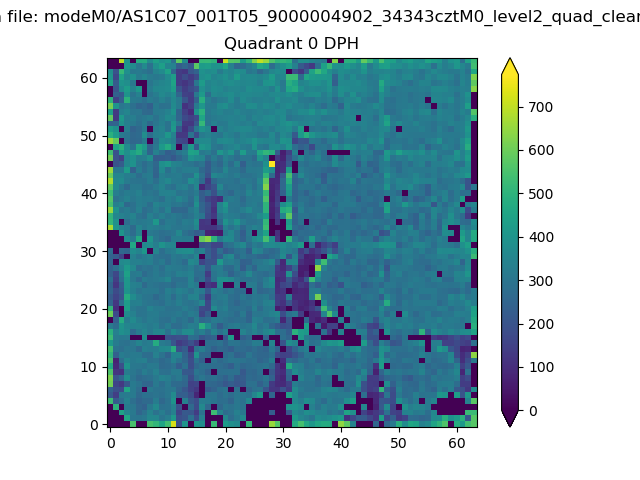 |
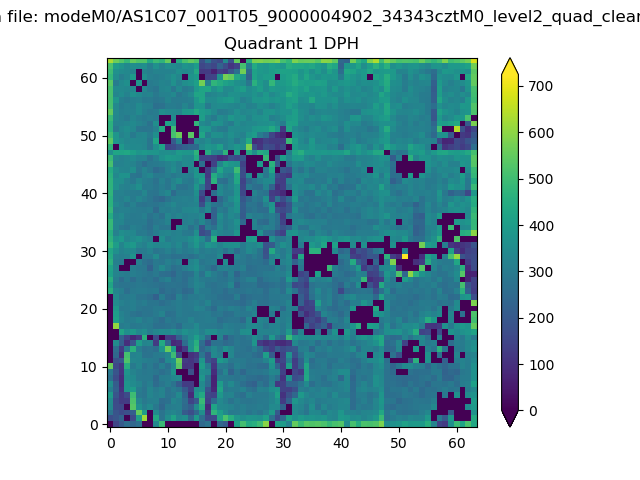 |
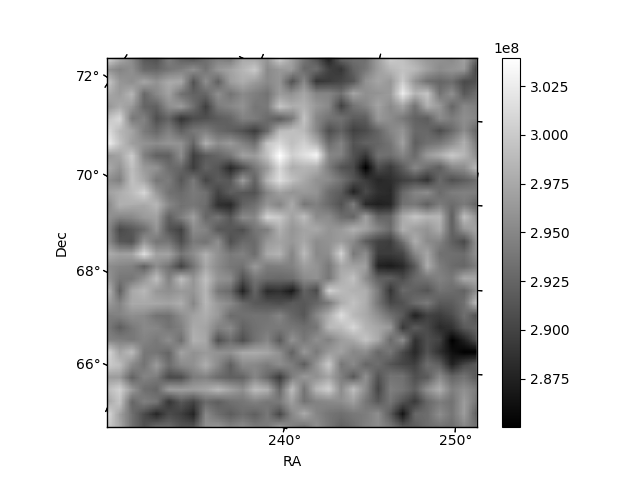
Quadrant B |
|---|---|---|---|
| Quadrant D | 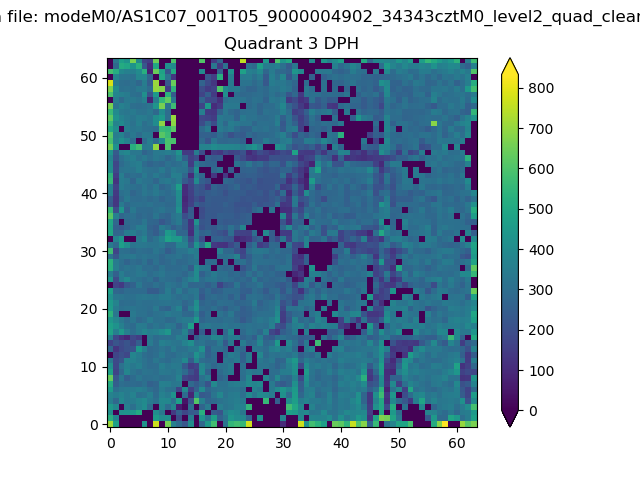 |
 |
Quadrant C |
| Plot type | Count rate plots | Images |
|---|---|---|
| Comparison with Poisson distribution Blue bars denote a histogram of data divided into 1 sec bins. Red curve is a Poisson curve with rate = median count rate of data. |
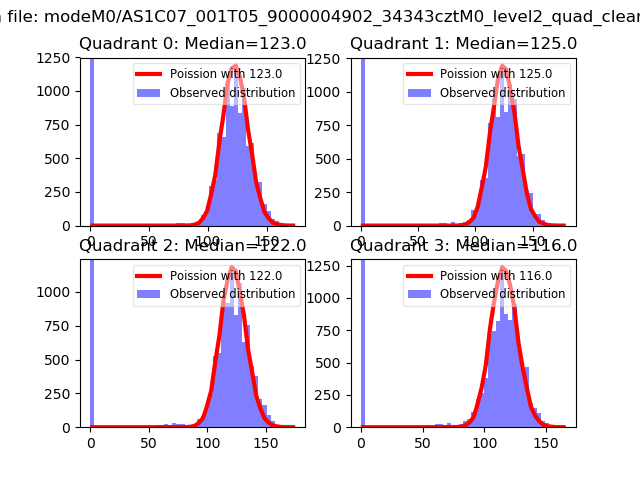 |
 |
| Quadrant-wise count rates Data is divided into 100 sec bins |
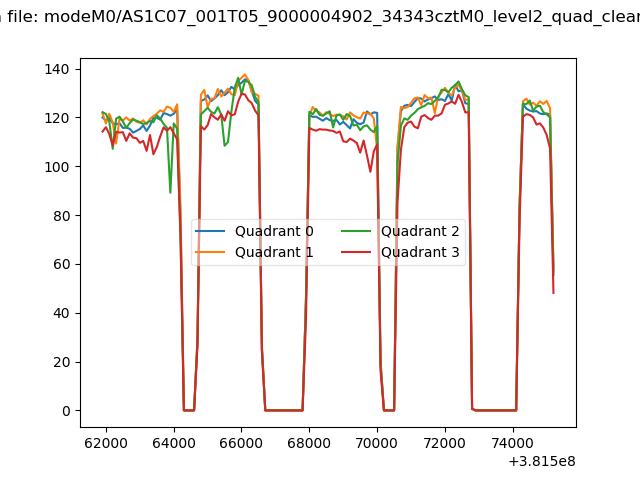 |
|
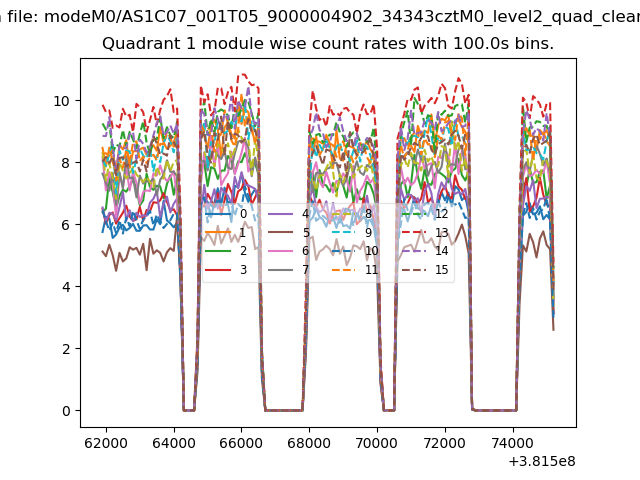
| Module-wise count rates for Quadrant A Data is divided into 100 sec bins |
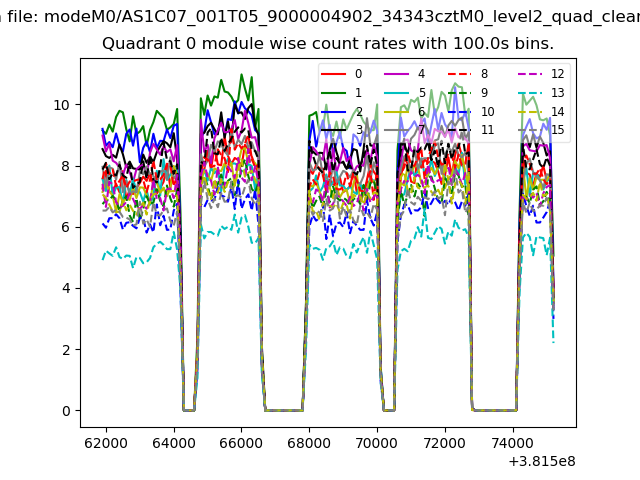 |
 |
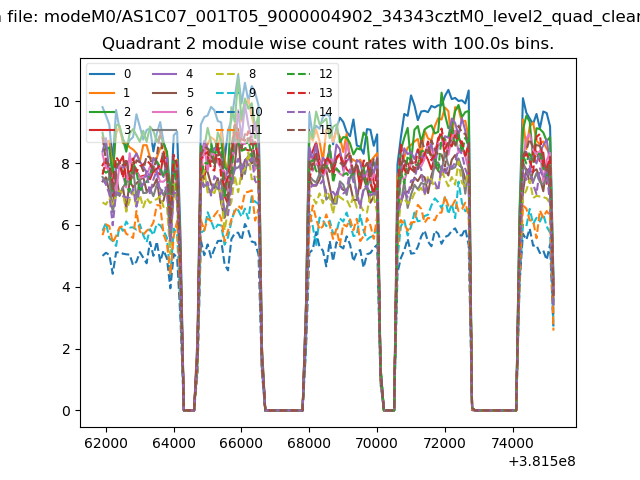
| Module-wise count rates for Quadrant B Data is divided into 100 sec bins |
 |
 |
| Module-wise count rates for Quadrant C Data is divided into 100 sec bins |
 |
 |
| Module-wise count rates for Quadrant D Data is divided into 100 sec bins |
 |
 |
| Parameter | Plot |
|---|---|
| CZT HV Monitor | 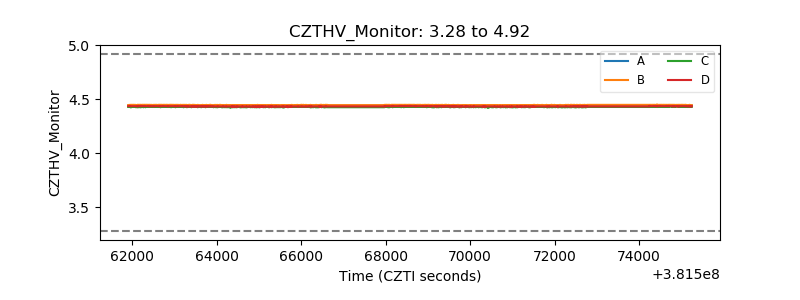 |
| D_VDD |  |
| Temperature 1 | 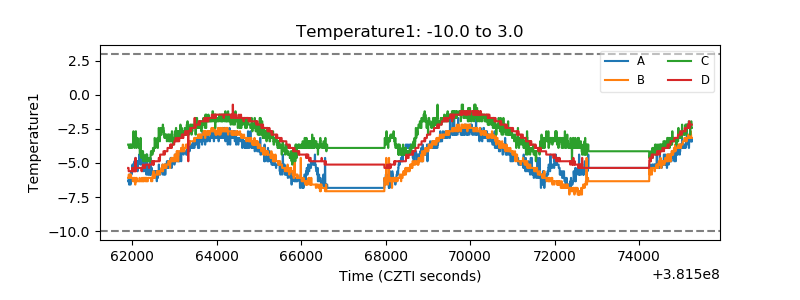 |
| Veto HV Monitor | 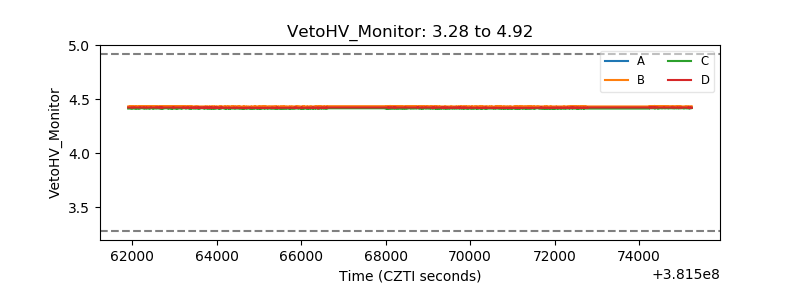 |
| Veto LLD |  |
| Alpha Counter | 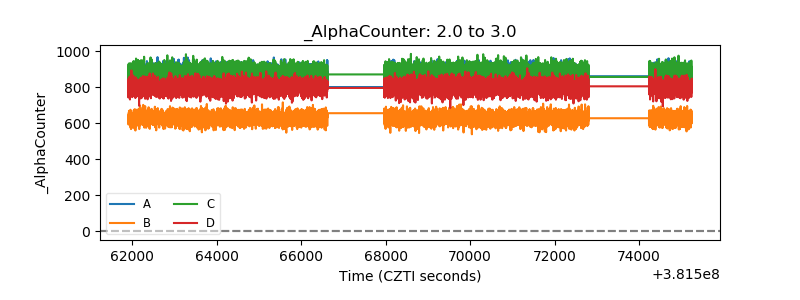 |
| _CPM_Rate | 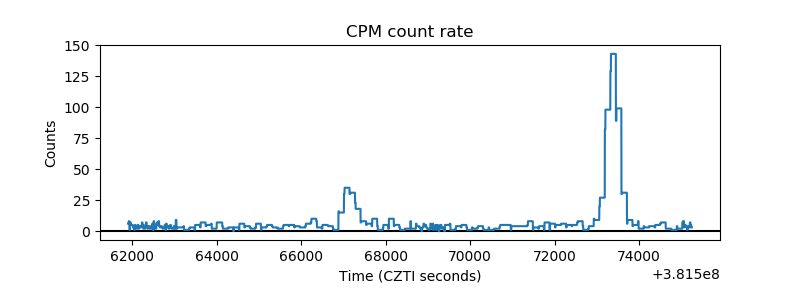 |
| CZT Counter | 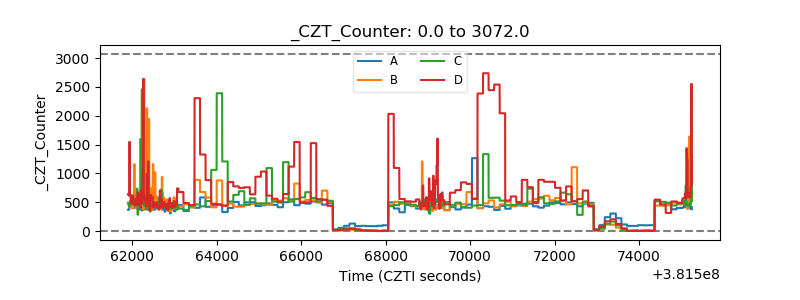 |
| +2.5 Volts monitor |  |
| +5 Volts monitor |  |
| _ROLL_ROT |  |
| _Roll_DEC | 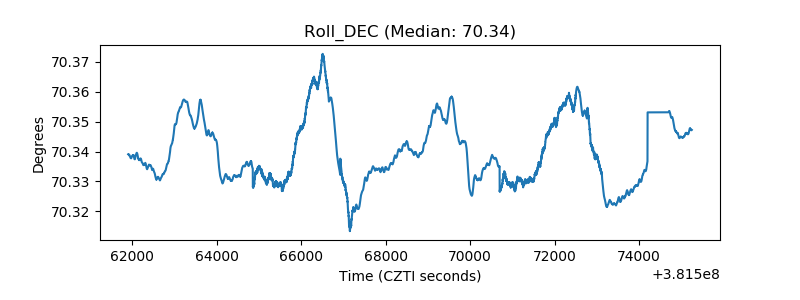 |
| _Roll_RA | 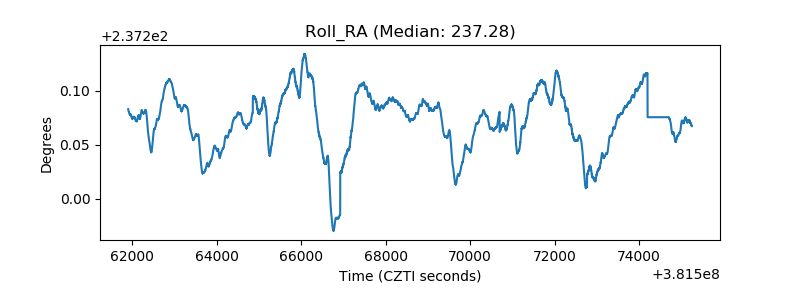 |
| Veto Counter |  |