| Param | Original file | Final file |
|---|---|---|
| Filename | modeM0/AS1A05_082T12_9000004908cztM0_level2.fits | modeM0/AS1A05_082T12_9000004908cztM0_level2_quad_clean.evt |
| Size (bytes) | 206,959,680 | 165,029,760 |
| Size | 197.4 MB | 157.4 MB |
| Events in quadrant A | 1,321,902 | 959,353 |
| Events in quadrant B | 1,246,850 | 950,038 |
| Events in quadrant C | 1,223,696 | 884,987 |
| Events in quadrant D | 887,872 | 619,582 |
| Mode SS | |||
|---|---|---|---|
| Quadrant | BADHDUFLAG | Total packets | Discarded packets |
| A | 0 | 466 | 0 |
| B | 0 | 466 | 0 |
| C | 0 | 466 | 0 |
| D | 0 | 466 | 0 |
| Mode M0 | |||
|---|---|---|---|
| Quadrant | BADHDUFLAG | Total packets | Discarded packets |
| A | 0 | 46863 | 0 |
| B | 0 | 55783 | 0 |
| C | 0 | 78551 | 0 |
| D | 0 | 128060 | 0 |
| Mode M9 | |||
|---|---|---|---|
| Quadrant | BADHDUFLAG | Total packets | Discarded packets |
| A | 0 | 64 | 0 |
| B | 0 | 64 | 0 |
| C | 0 | 64 | 0 |
| D | 0 | 64 | 0 |
| Quadrant | Total seconds | Saturated seconds | Saturation percentage |
|---|---|---|---|
| A | 23002 | 40 | 0.173898% |
| B | 23002 | 487 | 2.117207% |
| C | 23002 | 2450 | 10.651248% |
| D | 23002 | 8592 | 37.353274% |
Noise dominated data is calculated using 1-second bins in cleaned event files. If a bin has >2000 counts, and if more than 50% of those come from <1% of pixels, then it is considered to be noise-dominated and hence unusable.
| Quadrant | # 1 sec bins | Bins with >0 counts | Bins with >2000 counts | High rate bins dominated by noise | Noise dominated (total time) | Noise dominated (detector-on time) | Marked lightcurve |
|---|---|---|---|---|---|---|---|
| A | 29004 | 23001 | 0 | 0 | 0.00% | 0.00% |  |
| B | 29004 | 22999 | 0 | 0 | 0.00% | 0.00% |  |
| C | 29004 | 22996 | 0 | 0 | 0.00% | 0.00% |  |
| D | 29004 | 22959 | 0 | 0 | 0.00% | 0.00% |  |
Top three noisy pixels from each quadrant. If the there are fewer than three noisy pixels in the level2.evt file, extra rows are filled as -1
| Pixel properties | Quadrant properties | ||||||
|---|---|---|---|---|---|---|---|
| Quadrant | DetID | PixID | Counts | Sigma | Mean | Median | Sigma |
| A | 9 | 19 | 1113 | 9.09 | 344 | 322 | 87.1 |
| A | 7 | 110 | 1058 | 8.45 | 344 | 322 | 87.1 |
| A | 0 | 29 | 1028 | 8.11 | 344 | 322 | 87.1 |
| B | 2 | 9 | 1076 | 11.38 | 329 | 313 | 67.1 |
| B | 3 | 80 | 931 | 9.22 | 329 | 313 | 67.1 |
| B | 2 | 8 | 883 | 8.5 | 329 | 313 | 67.1 |
| C | 1 | 81 | 985 | 8.14 | 323 | 302 | 83.9 |
| C | 1 | 80 | 955 | 7.79 | 323 | 302 | 83.9 |
| C | 3 | 187 | 864 | 6.7 | 323 | 302 | 83.9 |
| D | 7 | 3 | 690 | 6.67 | 254 | 232 | 68.6 |
| D | 10 | 113 | 642 | 5.97 | 254 | 232 | 68.6 |
| D | 6 | 231 | 630 | 5.8 | 254 | 232 | 68.6 |
Histogram calculated using DETX and DETY for each event in the final _common_clean file
| Quadrant A | 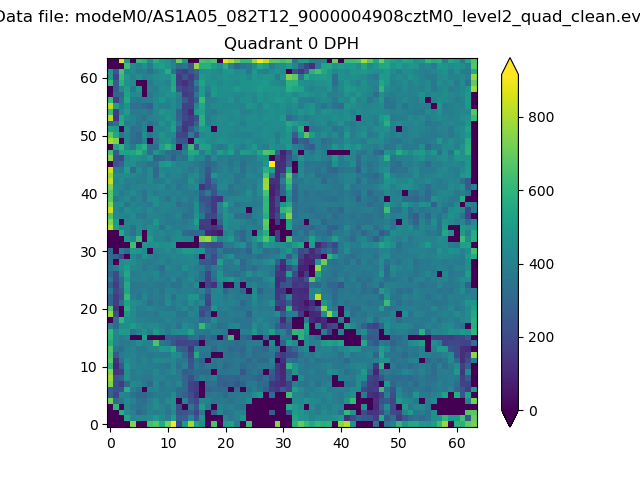 |
 |
Quadrant B |
|---|---|---|---|
| Quadrant D |  |
 |
Quadrant C |
| Plot type | Count rate plots | Images |
|---|---|---|
| Comparison with Poisson distribution Blue bars denote a histogram of data divided into 1 sec bins. Red curve is a Poisson curve with rate = median count rate of data. |
 |
 |
| Quadrant-wise count rates Data is divided into 100 sec bins |
 |
|
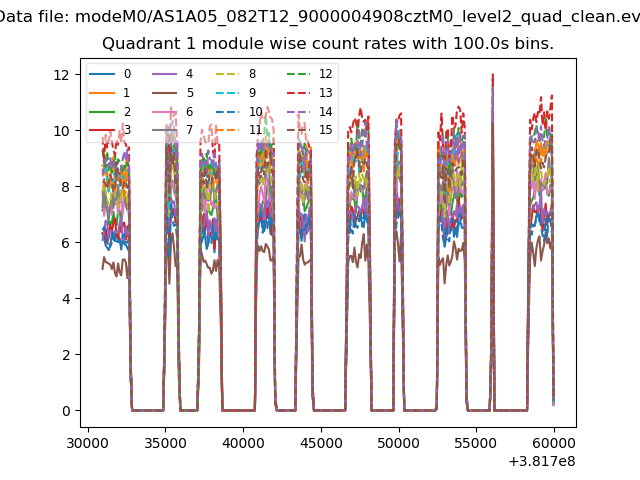
| Module-wise count rates for Quadrant A Data is divided into 100 sec bins |
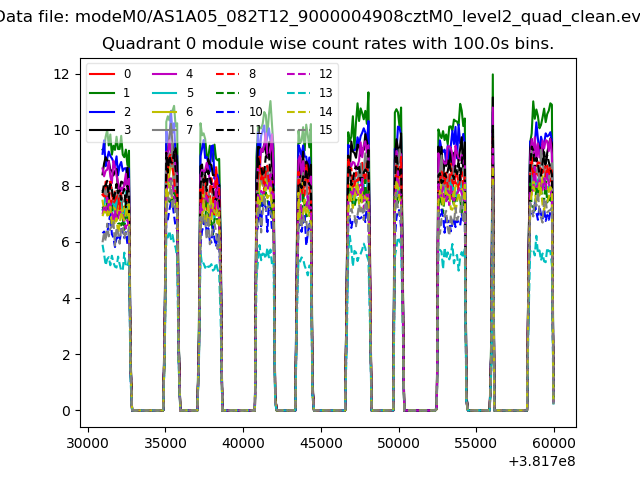 |
 |
| Module-wise count rates for Quadrant B Data is divided into 100 sec bins |
 |
 |
| Module-wise count rates for Quadrant C Data is divided into 100 sec bins |
 |
 |
| Module-wise count rates for Quadrant D Data is divided into 100 sec bins |
 |
 |
| Parameter | Plot |
|---|---|
| CZT HV Monitor |  |
| D_VDD | 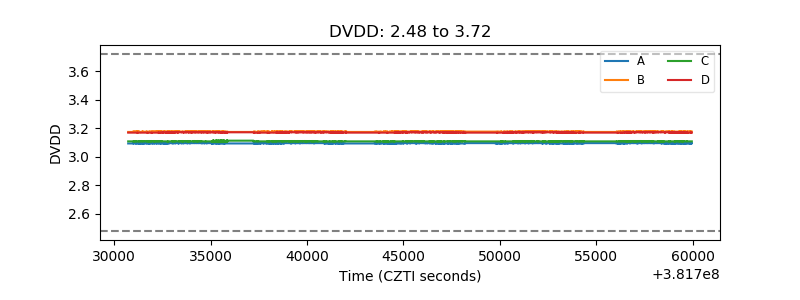 |
| Temperature 1 |  |
| Veto HV Monitor |  |
| Veto LLD |  |
| Alpha Counter |  |
| _CPM_Rate | 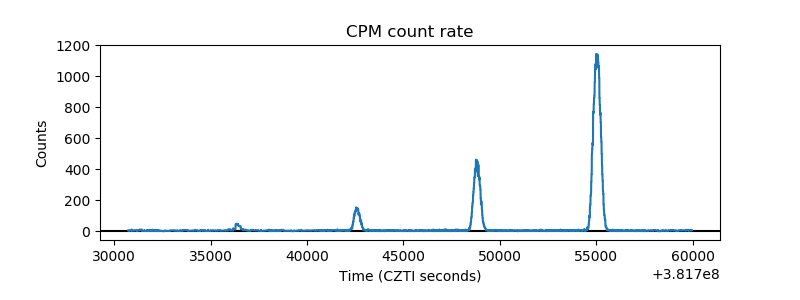 |
| CZT Counter |  |
| +2.5 Volts monitor | 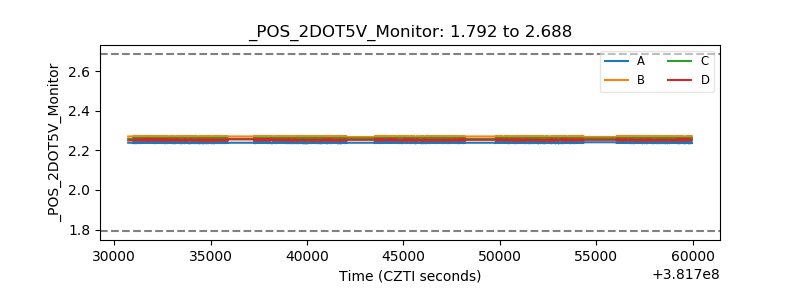 |
| +5 Volts monitor | 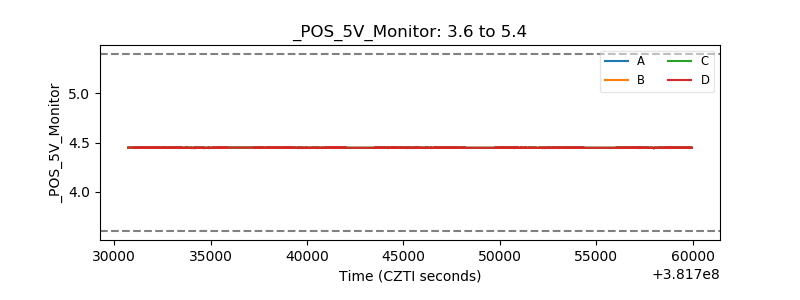 |
| _ROLL_ROT |  |
| _Roll_DEC |  |
| _Roll_RA | 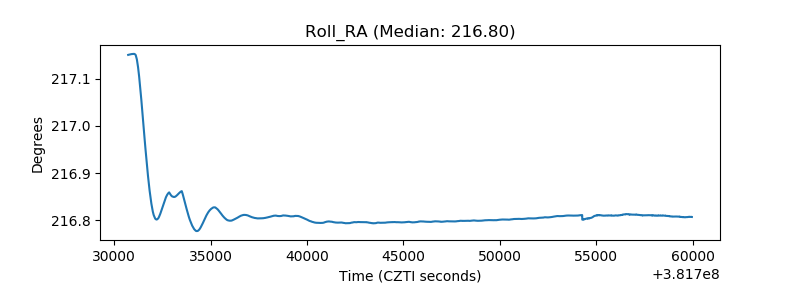 |
| Veto Counter |  |