| Param | Original file | Final file |
|---|---|---|
| Filename | modeM0/AS1A05_085T01_9000004910_34381cztM0_level2.evt | modeM0/AS1A05_085T01_9000004910_34381cztM0_level2_quad_clean.evt |
| Size (bytes) | 555,160,320 | 60,433,920 |
| Size | 529.4 MB | 57.6 MB |
| Events in quadrant A | 2,388,140 | 404,571 |
| Events in quadrant B | 3,921,335 | 377,647 |
| Events in quadrant C | 3,213,351 | 398,976 |
| Events in quadrant D | 6,947,907 | 293,605 |
| Mode SS | |||
|---|---|---|---|
| Quadrant | BADHDUFLAG | Total packets | Discarded packets |
| A | 0 | 102 | 0 |
| B | 0 | 102 | 0 |
| C | 0 | 102 | 0 |
| D | 0 | 102 | 0 |
| Mode M9 | |||
|---|---|---|---|
| Quadrant | BADHDUFLAG | Total packets | Discarded packets |
| A | 0 | 32 | 0 |
| B | 0 | 32 | 0 |
| C | 0 | 32 | 0 |
| D | 0 | 33 | 0 |
| Mode M0 | |||
|---|---|---|---|
| Quadrant | BADHDUFLAG | Total packets | Discarded packets |
| A | 0 | 10501 | 3 |
| B | 0 | 14958 | 2 |
| C | 0 | 12898 | 2 |
| D | 0 | 24178 | 2 |
| Quadrant | Total seconds | Saturated seconds | Saturation percentage |
|---|---|---|---|
| A | 5057 | 24 | 0.474590% |
| B | 5057 | 558 | 11.034210% |
| C | 5057 | 41 | 0.810757% |
| D | 5057 | 1416 | 28.000791% |
Noise dominated data is calculated using 1-second bins in cleaned event files. If a bin has >2000 counts, and if more than 50% of those come from <1% of pixels, then it is considered to be noise-dominated and hence unusable.
| Quadrant | # 1 sec bins | Bins with >0 counts | Bins with >2000 counts | High rate bins dominated by noise | Noise dominated (total time) | Noise dominated (detector-on time) | Marked lightcurve |
|---|---|---|---|---|---|---|---|
| A | 7090 | 5058 | 12 | 12 | 0.17% | 0.24% | 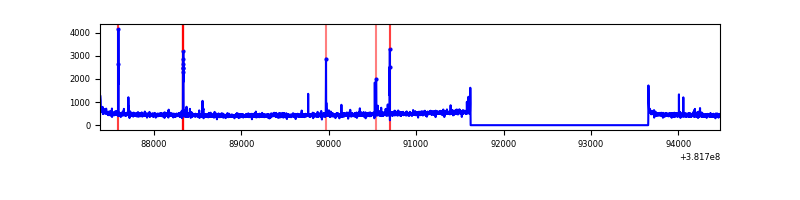 |
| B | 7090 | 5058 | 401 | 401 | 5.66% | 7.93% | 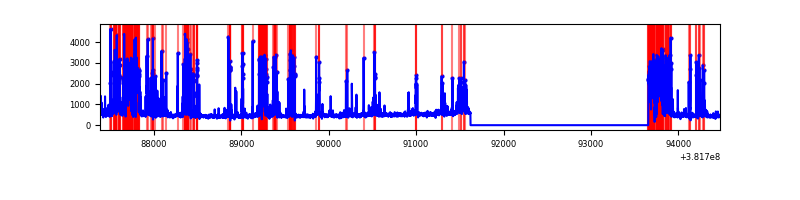 |
| C | 7090 | 5058 | 31 | 31 | 0.44% | 0.61% | 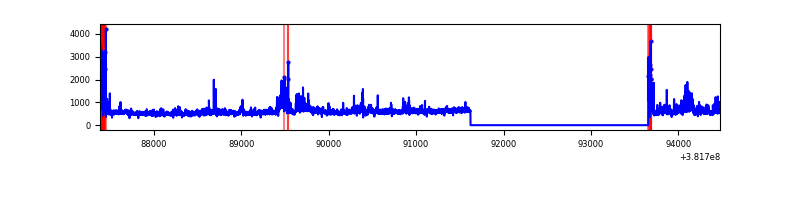 |
| D | 7090 | 5058 | 1332 | 1332 | 18.79% | 26.33% | 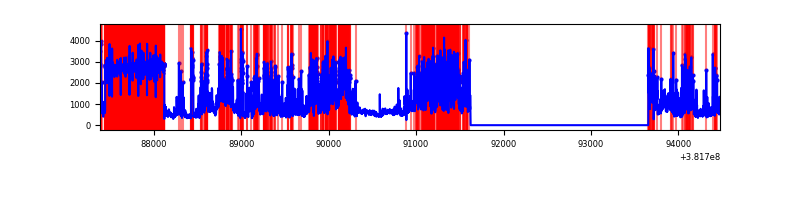 |
Top three noisy pixels from each quadrant. If the there are fewer than three noisy pixels in the level2.evt file, extra rows are filled as -1
| Pixel properties | Quadrant properties | ||||||
|---|---|---|---|---|---|---|---|
| Quadrant | DetID | PixID | Counts | Sigma | Mean | Median | Sigma |
| A | 9 | 143 | 66750 | 563.82 | 585 | 574 | 117.4 |
| A | 10 | 83 | 32321 | 270.48 | 585 | 574 | 117.4 |
| A | 13 | 6 | 12093 | 98.14 | 585 | 574 | 117.4 |
| B | 5 | 172 | 1589737 | 14855.55 | 561 | 548 | 107.0 |
| B | 0 | 229 | 31356 | 287.99 | 561 | 548 | 107.0 |
| B | 5 | 255 | 30787 | 282.67 | 561 | 548 | 107.0 |
| C | 4 | 254 | 550393 | 4121.85 | 571 | 577 | 133.4 |
| C | 15 | 214 | 213486 | 1596.13 | 571 | 577 | 133.4 |
| C | 0 | 10 | 137834 | 1028.98 | 571 | 577 | 133.4 |
| D | 2 | 249 | 1961556 | 16436.03 | 491 | 478 | 119.3 |
| D | 7 | 223 | 1692491 | 14180.96 | 491 | 478 | 119.3 |
| D | 8 | 195 | 504551 | 4224.7 | 491 | 478 | 119.3 |
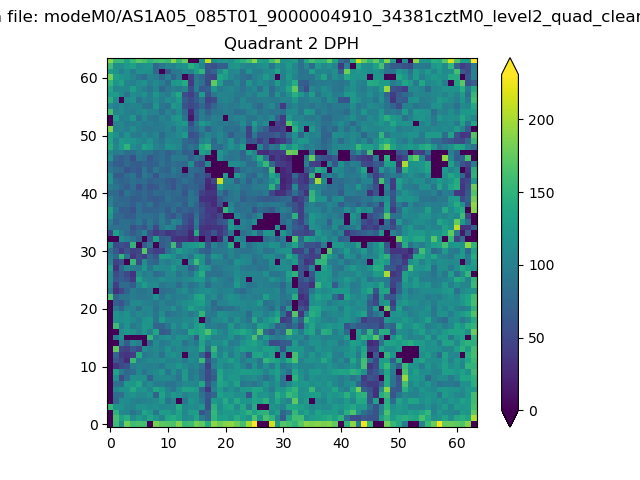
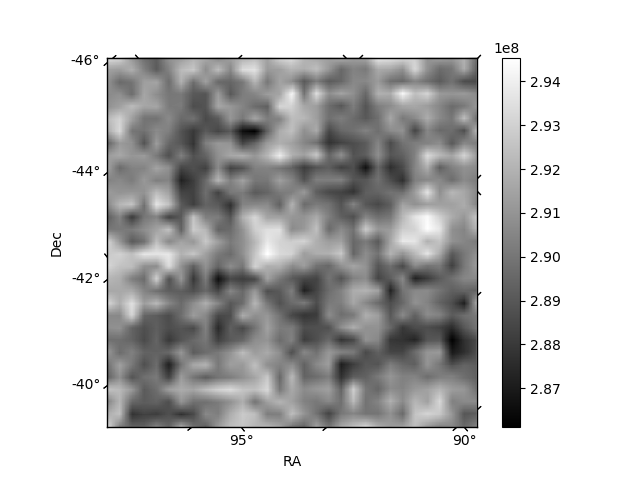
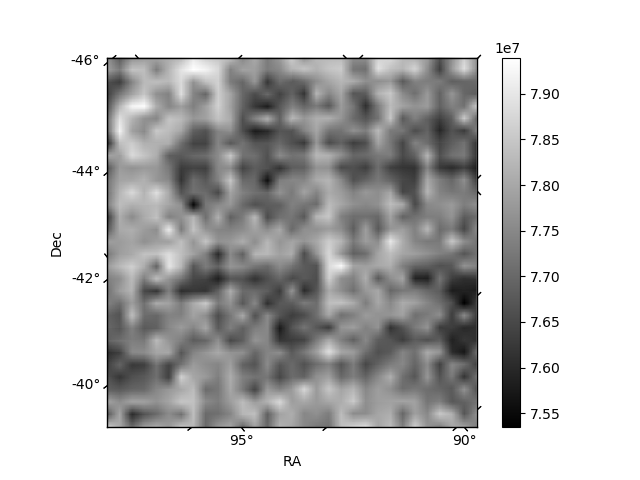
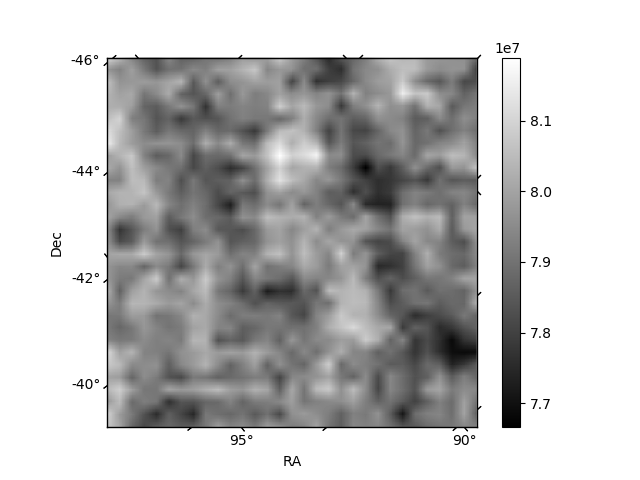
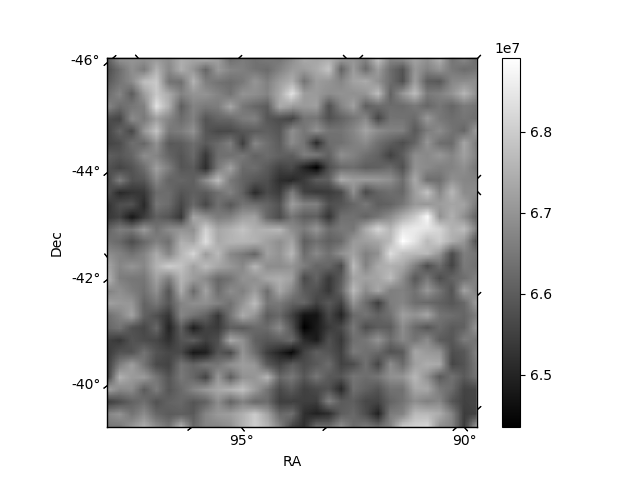
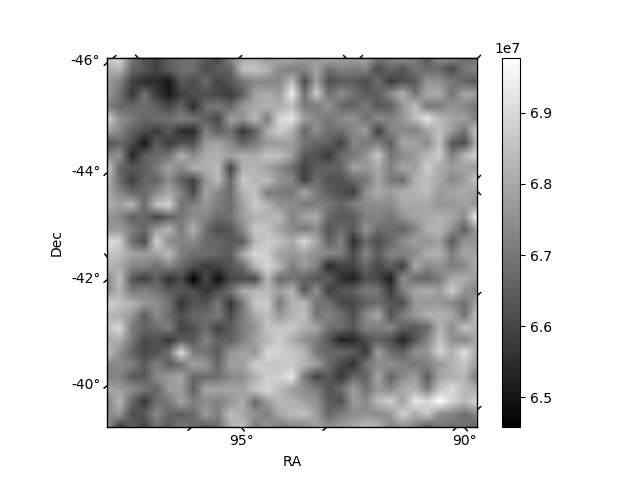
Histogram calculated using DETX and DETY for each event in the final _common_clean file
| Quadrant A | 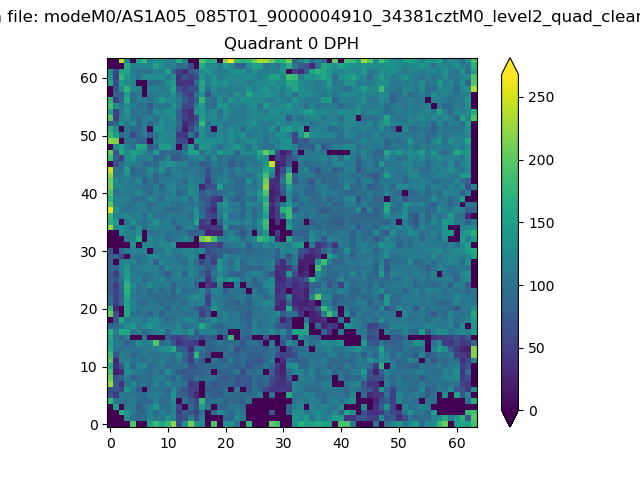 |
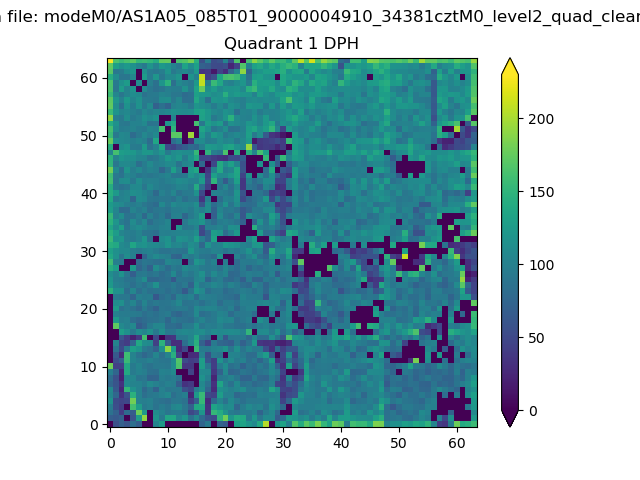 |
Quadrant B |
|---|---|---|---|
| Quadrant D | 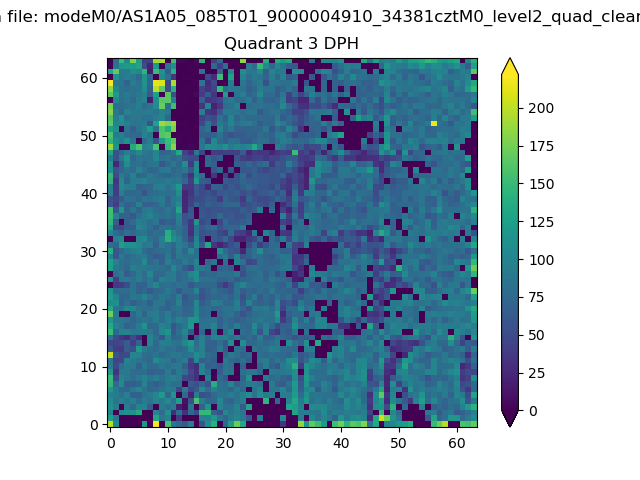 |
 |
Quadrant C |
| Plot type | Count rate plots | Images |
|---|---|---|
| Comparison with Poisson distribution Blue bars denote a histogram of data divided into 1 sec bins. Red curve is a Poisson curve with rate = median count rate of data. |
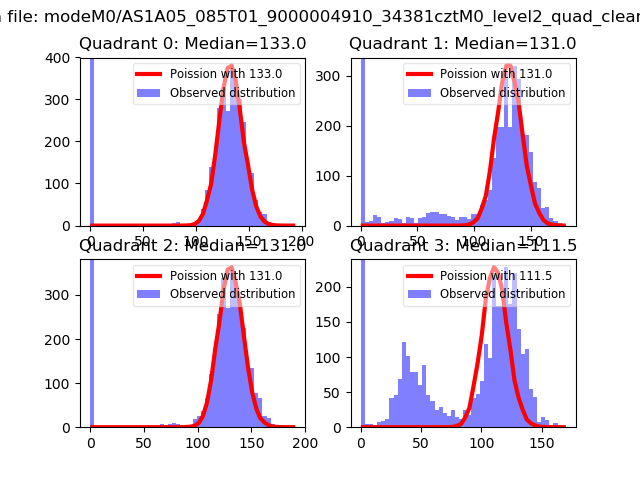 |
 |
| Quadrant-wise count rates Data is divided into 100 sec bins |
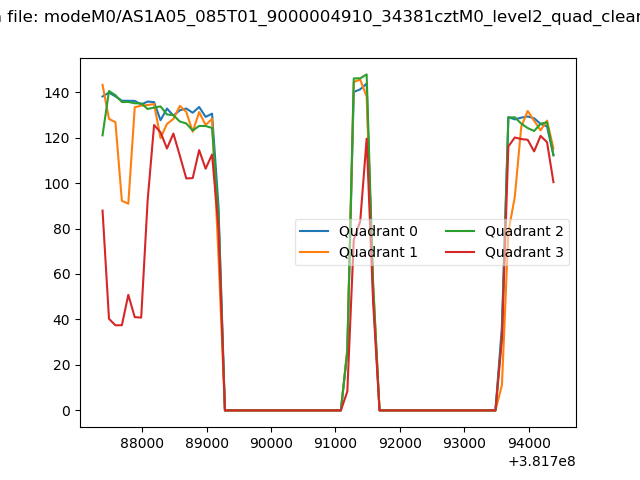 |
|
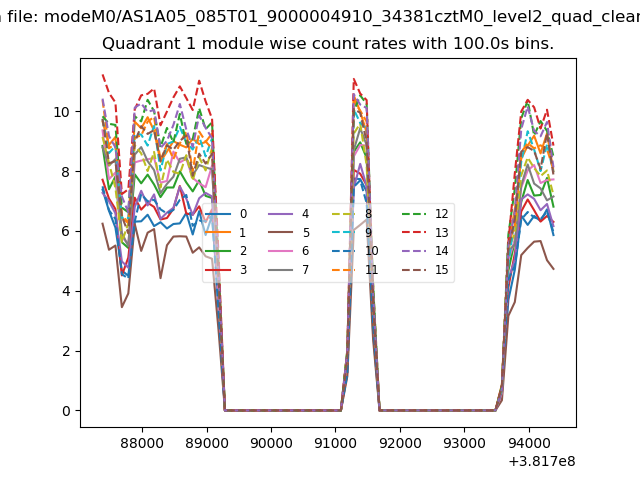
| Module-wise count rates for Quadrant A Data is divided into 100 sec bins |
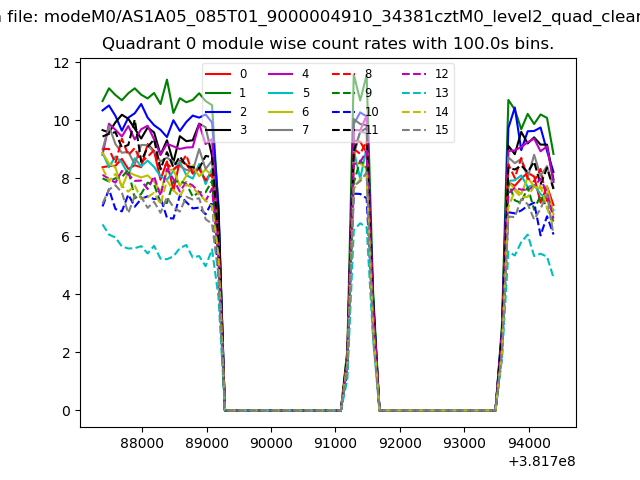 |
 |
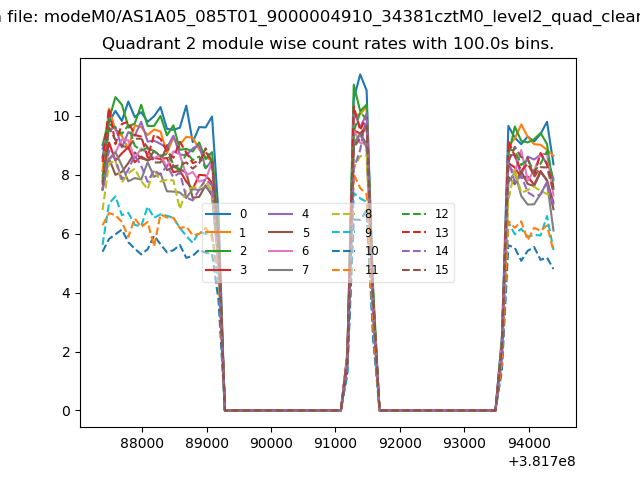
| Module-wise count rates for Quadrant B Data is divided into 100 sec bins |
 |
 |
| Module-wise count rates for Quadrant C Data is divided into 100 sec bins |
 |
 |
| Module-wise count rates for Quadrant D Data is divided into 100 sec bins |
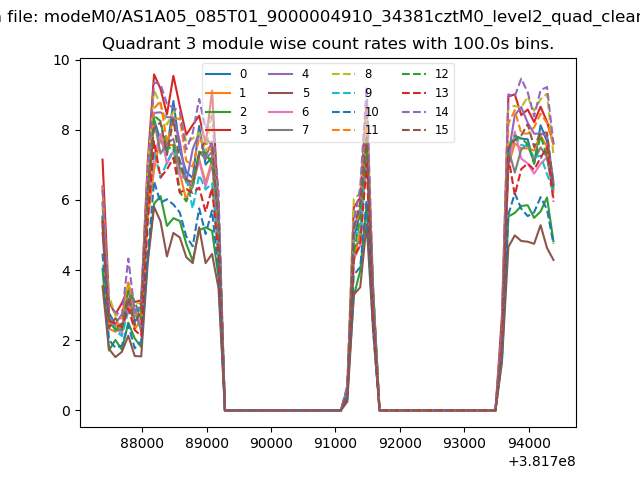 |
 |
| Parameter | Plot |
|---|---|
| CZT HV Monitor | 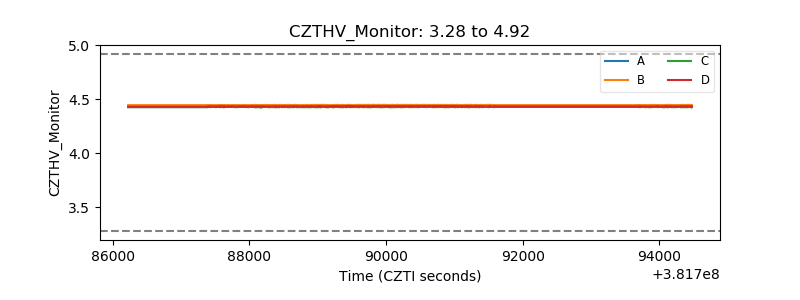 |
| D_VDD | 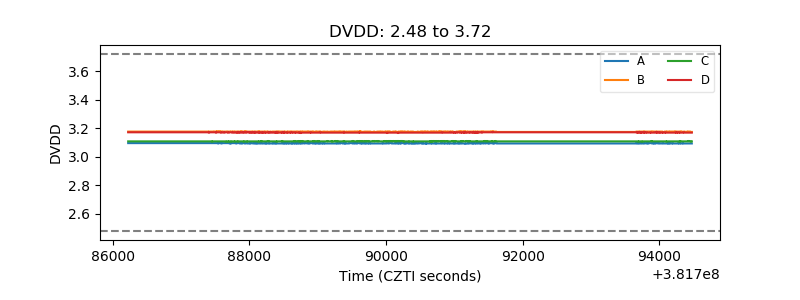 |
| Temperature 1 | 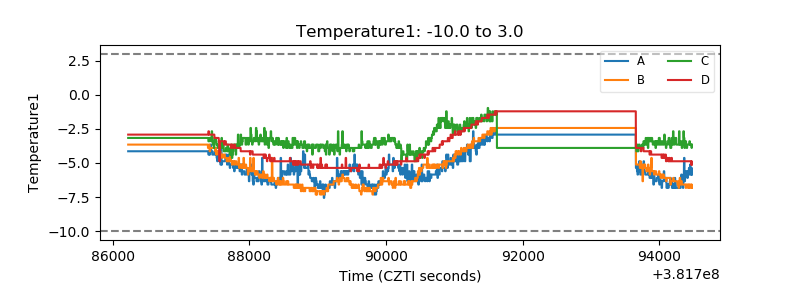 |
| Veto HV Monitor | 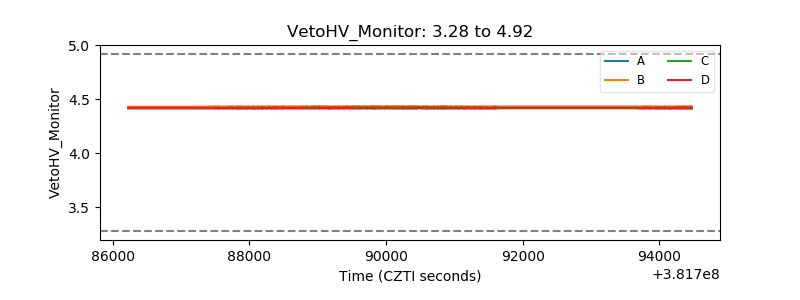 |
| Veto LLD | 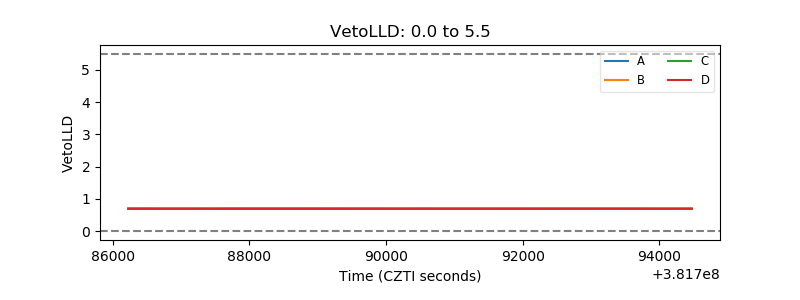 |
| Alpha Counter | 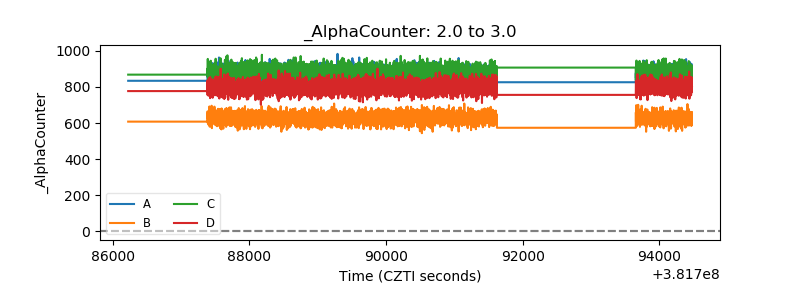 |
| _CPM_Rate | 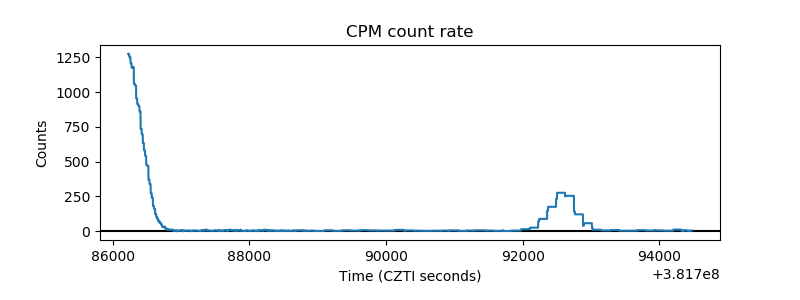 |
| CZT Counter | 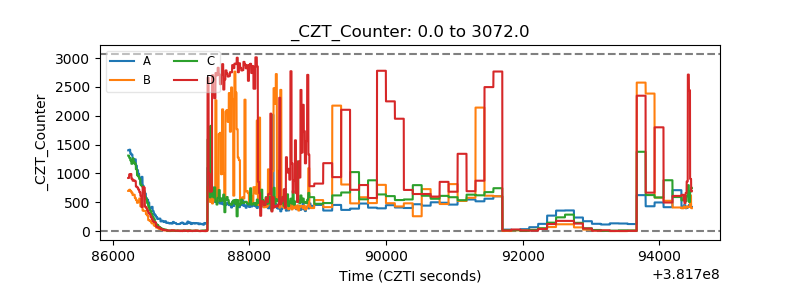 |
| +2.5 Volts monitor |  |
| +5 Volts monitor |  |
| _ROLL_ROT |  |
| _Roll_DEC | 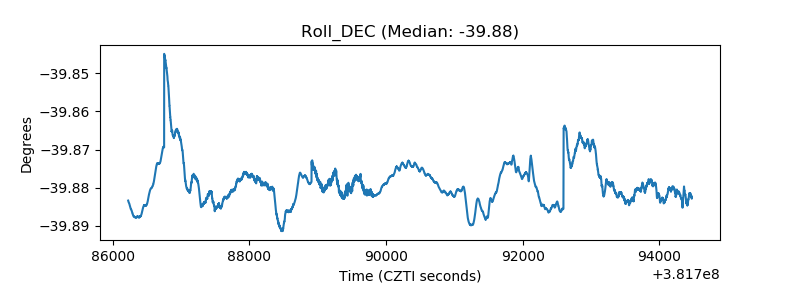 |
| _Roll_RA | 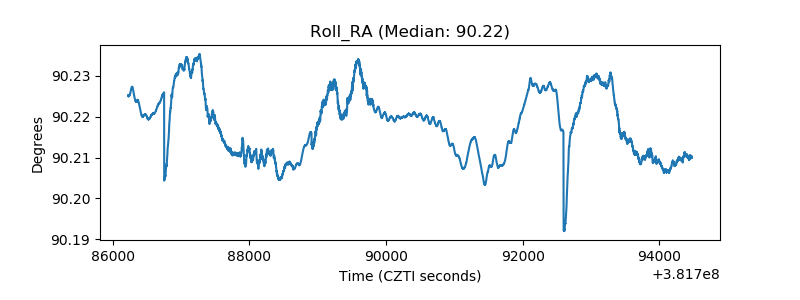 |
| Veto Counter | 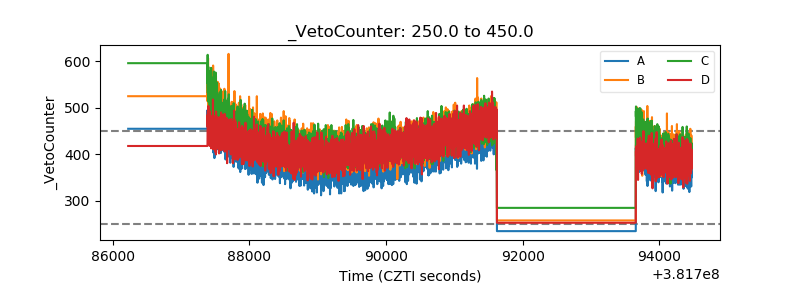 |