| Param | Original file | Final file |
|---|---|---|
| Filename | modeM0/AS1A05_103T01_9000004912cztM0_level2.fits | modeM0/AS1A05_103T01_9000004912cztM0_level2_quad_clean.evt |
| Size (bytes) | 118,903,680 | 64,880,640 |
| Size | 113.4 MB | 61.9 MB |
| Events in quadrant A | 765,668 | 315,956 |
| Events in quadrant B | 721,658 | 314,347 |
| Events in quadrant C | 758,560 | 308,626 |
| Events in quadrant D | 600,878 | 270,380 |
| Mode M9 | |||
|---|---|---|---|
| Quadrant | BADHDUFLAG | Total packets | Discarded packets |
| A | 0 | 56 | 0 |
| B | 0 | 56 | 0 |
| C | 0 | 56 | 0 |
| D | 0 | 56 | 0 |
| Mode M0 | |||
|---|---|---|---|
| Quadrant | BADHDUFLAG | Total packets | Discarded packets |
| A | 0 | 23317 | 0 |
| B | 0 | 27581 | 0 |
| C | 0 | 25154 | 0 |
| D | 0 | 43460 | 0 |
| Mode SS | |||
|---|---|---|---|
| Quadrant | BADHDUFLAG | Total packets | Discarded packets |
| A | 0 | 222 | 0 |
| B | 0 | 222 | 0 |
| C | 0 | 222 | 0 |
| D | 0 | 222 | 0 |
| Quadrant | Total seconds | Saturated seconds | Saturation percentage |
|---|---|---|---|
| A | 10889 | 17 | 0.156121% |
| B | 10889 | 468 | 4.297915% |
| C | 10889 | 112 | 1.028561% |
| D | 10888 | 1567 | 14.391991% |
Noise dominated data is calculated using 1-second bins in cleaned event files. If a bin has >2000 counts, and if more than 50% of those come from <1% of pixels, then it is considered to be noise-dominated and hence unusable.
| Quadrant | # 1 sec bins | Bins with >0 counts | Bins with >2000 counts | High rate bins dominated by noise | Noise dominated (total time) | Noise dominated (detector-on time) | Marked lightcurve |
|---|---|---|---|---|---|---|---|
| A | 15043 | 10889 | 0 | 0 | 0.00% | 0.00% | 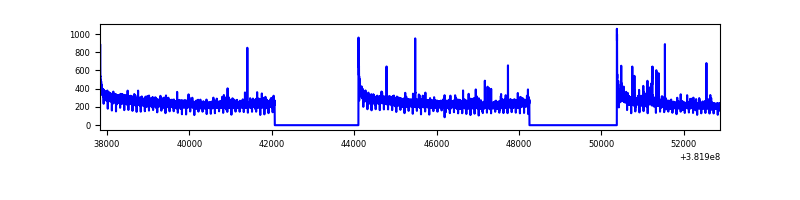 |
| B | 15042 | 10886 | 0 | 0 | 0.00% | 0.00% |  |
| C | 15042 | 10888 | 0 | 0 | 0.00% | 0.00% |  |
| D | 15042 | 10864 | 0 | 0 | 0.00% | 0.00% |  |
Top three noisy pixels from each quadrant. If the there are fewer than three noisy pixels in the level2.evt file, extra rows are filled as -1
| Pixel properties | Quadrant properties | ||||||
|---|---|---|---|---|---|---|---|
| Quadrant | DetID | PixID | Counts | Sigma | Mean | Median | Sigma |
| A | 9 | 19 | 607 | 8.54 | 199 | 190 | 48.8 |
| A | 14 | 95 | 599 | 8.38 | 199 | 190 | 48.8 |
| A | 7 | 110 | 594 | 8.27 | 199 | 190 | 48.8 |
| B | 2 | 9 | 587 | 10.4 | 191 | 183 | 38.8 |
| B | 3 | 17 | 508 | 8.36 | 191 | 183 | 38.8 |
| B | 3 | 80 | 495 | 8.03 | 191 | 183 | 38.8 |
| C | 1 | 81 | 597 | 7.83 | 201 | 192 | 51.7 |
| C | 1 | 80 | 593 | 7.75 | 201 | 192 | 51.7 |
| C | 3 | 203 | 563 | 7.17 | 201 | 192 | 51.7 |
| D | 10 | 189 | 469 | 6.77 | 172 | 159 | 45.8 |
| D | 7 | 3 | 452 | 6.4 | 172 | 159 | 45.8 |
| D | 6 | 83 | 444 | 6.23 | 172 | 159 | 45.8 |
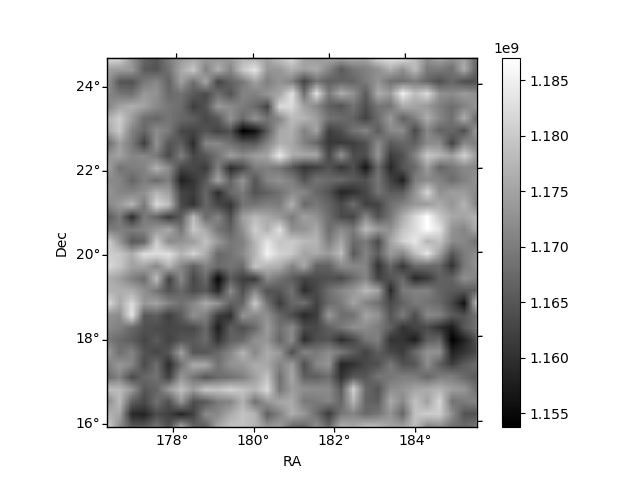
Histogram calculated using DETX and DETY for each event in the final _common_clean file
| Quadrant A | 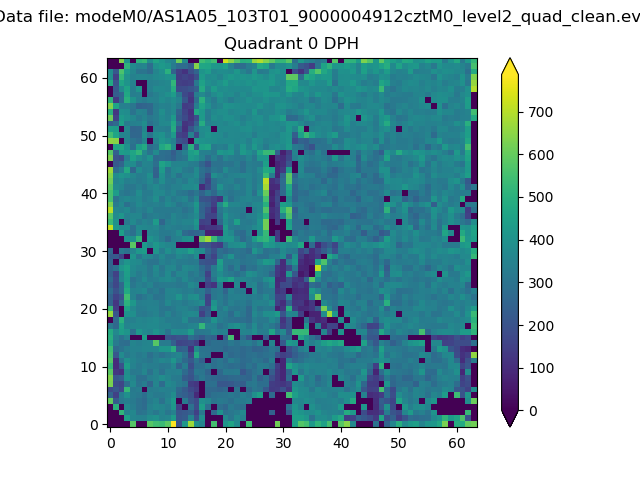 |
 |
Quadrant B |
|---|---|---|---|
| Quadrant D | 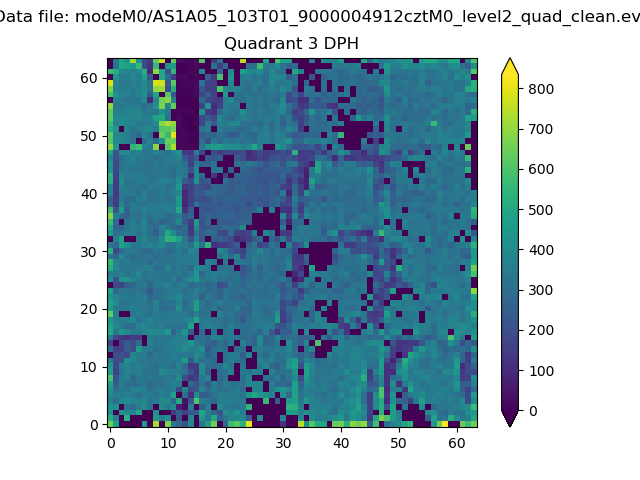 |
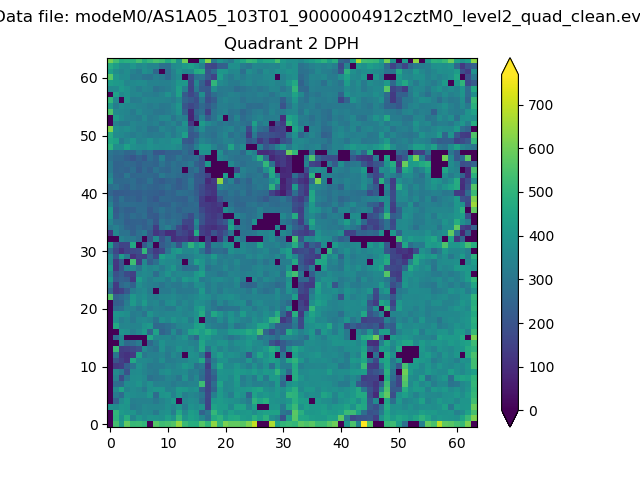 |
Quadrant C |
| Plot type | Count rate plots | Images |
|---|---|---|
| Comparison with Poisson distribution Blue bars denote a histogram of data divided into 1 sec bins. Red curve is a Poisson curve with rate = median count rate of data. |
 |
 |
| Quadrant-wise count rates Data is divided into 100 sec bins |
 |
|
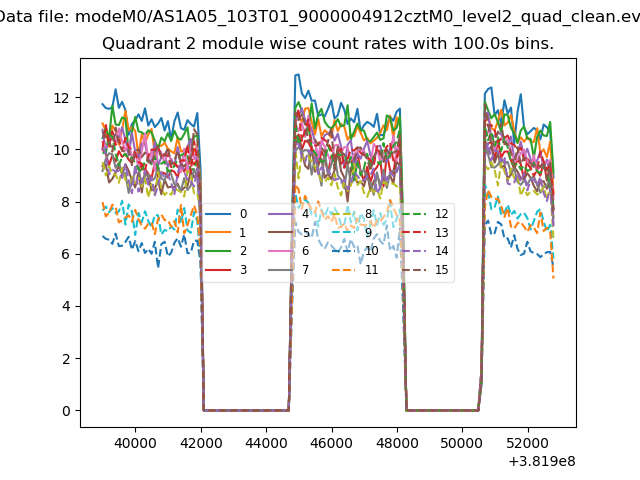
| Module-wise count rates for Quadrant A Data is divided into 100 sec bins |
 |
 |
| Module-wise count rates for Quadrant B Data is divided into 100 sec bins |
 |
 |
| Module-wise count rates for Quadrant C Data is divided into 100 sec bins |
 |
 |
| Module-wise count rates for Quadrant D Data is divided into 100 sec bins |
 |
 |
| Parameter | Plot |
|---|---|
| CZT HV Monitor |  |
| D_VDD |  |
| Temperature 1 |  |
| Veto HV Monitor |  |
| Veto LLD |  |
| Alpha Counter | 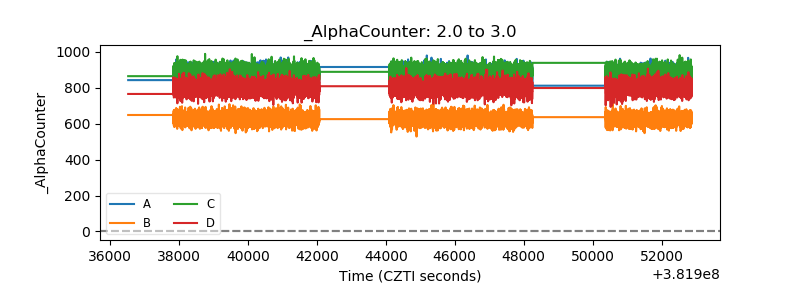 |
| _CPM_Rate | 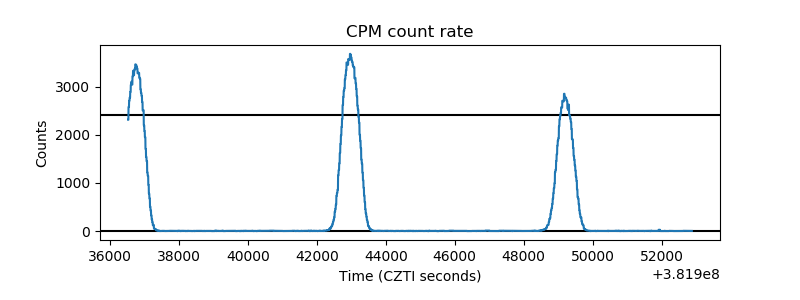 |
| CZT Counter |  |
| +2.5 Volts monitor |  |
| +5 Volts monitor |  |
| _ROLL_ROT | 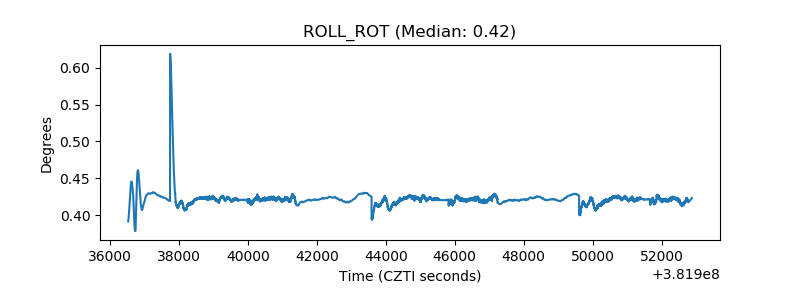 |
| _Roll_DEC | 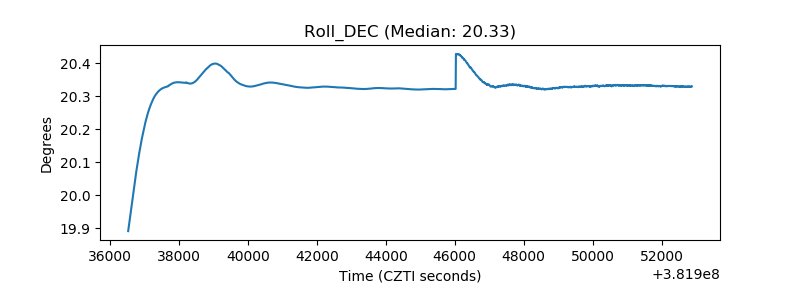 |
| _Roll_RA |  |
| Veto Counter |  |