| Param | Original file | Final file |
|---|---|---|
| Filename | modeM0/AS1A05_082T10_9000004916_34425cztM0_level2.evt | modeM0/AS1A05_082T10_9000004916_34425cztM0_level2_quad_clean.evt |
| Size (bytes) | 212,636,160 | 39,147,840 |
| Size | 202.8 MB | 37.3 MB |
| Events in quadrant A | 1,290,509 | 253,414 |
| Events in quadrant B | 1,540,804 | 259,639 |
| Events in quadrant C | 1,430,110 | 252,647 |
| Events in quadrant D | 2,001,144 | 234,374 |
| Mode M9 | |||
|---|---|---|---|
| Quadrant | BADHDUFLAG | Total packets | Discarded packets |
| A | 0 | 19 | 0 |
| B | 0 | 19 | 0 |
| C | 0 | 19 | 0 |
| D | 0 | 19 | 0 |
| Mode SS | |||
|---|---|---|---|
| Quadrant | BADHDUFLAG | Total packets | Discarded packets |
| A | 0 | 54 | 0 |
| B | 0 | 54 | 0 |
| C | 0 | 54 | 0 |
| D | 0 | 54 | 0 |
| Mode M0 | |||
|---|---|---|---|
| Quadrant | BADHDUFLAG | Total packets | Discarded packets |
| A | 0 | 5381 | 2 |
| B | 0 | 6211 | 1 |
| C | 0 | 5681 | 1 |
| D | 0 | 7689 | 1 |
| Quadrant | Total seconds | Saturated seconds | Saturation percentage |
|---|---|---|---|
| A | 2578 | 3 | 0.116369% |
| B | 2578 | 62 | 2.404965% |
| C | 2578 | 20 | 0.775795% |
| D | 2578 | 95 | 3.685027% |
Noise dominated data is calculated using 1-second bins in cleaned event files. If a bin has >2000 counts, and if more than 50% of those come from <1% of pixels, then it is considered to be noise-dominated and hence unusable.
| Quadrant | # 1 sec bins | Bins with >0 counts | Bins with >2000 counts | High rate bins dominated by noise | Noise dominated (total time) | Noise dominated (detector-on time) | Marked lightcurve |
|---|---|---|---|---|---|---|---|
| A | 4461 | 2579 | 1 | 1 | 0.02% | 0.04% | 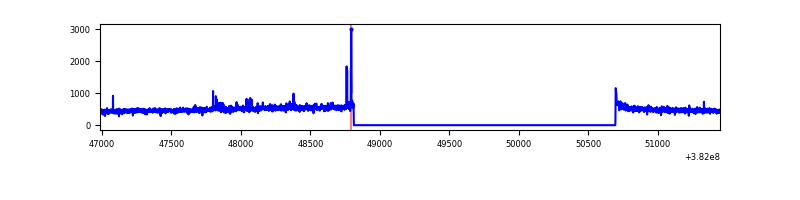 |
| B | 4461 | 2579 | 32 | 32 | 0.72% | 1.24% | 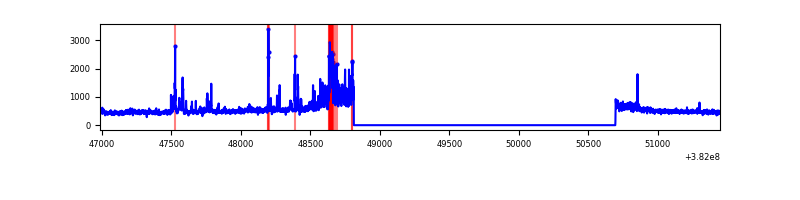 |
| C | 4461 | 2579 | 12 | 12 | 0.27% | 0.47% |  |
| D | 4461 | 2579 | 82 | 82 | 1.84% | 3.18% | 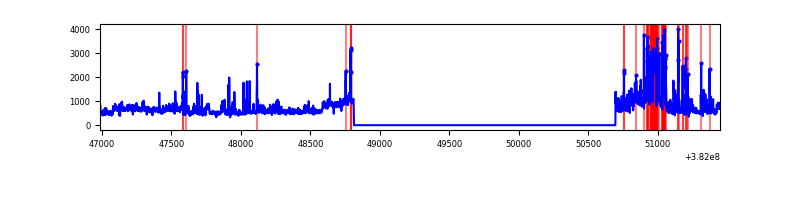 |
Top three noisy pixels from each quadrant. If the there are fewer than three noisy pixels in the level2.evt file, extra rows are filled as -1
| Pixel properties | Quadrant properties | ||||||
|---|---|---|---|---|---|---|---|
| Quadrant | DetID | PixID | Counts | Sigma | Mean | Median | Sigma |
| A | 7 | 16 | 17416 | 256.35 | 321 | 315 | 66.7 |
| A | 10 | 83 | 17193 | 253.01 | 321 | 315 | 66.7 |
| A | 9 | 143 | 11824 | 172.52 | 321 | 315 | 66.7 |
| B | 5 | 172 | 163729 | 2637.53 | 314 | 306 | 62.0 |
| B | 0 | 190 | 101311 | 1630.15 | 314 | 306 | 62.0 |
| B | 0 | 229 | 26215 | 418.15 | 314 | 306 | 62.0 |
| C | 15 | 214 | 108032 | 1478.9 | 308 | 311 | 72.8 |
| C | 0 | 10 | 68857 | 941.07 | 308 | 311 | 72.8 |
| C | 14 | 67 | 30605 | 415.91 | 308 | 311 | 72.8 |
| D | 8 | 195 | 355443 | 4681.22 | 305 | 296 | 75.9 |
| D | 7 | 80 | 317890 | 4186.23 | 305 | 296 | 75.9 |
| D | 2 | 250 | 50656 | 663.8 | 305 | 296 | 75.9 |
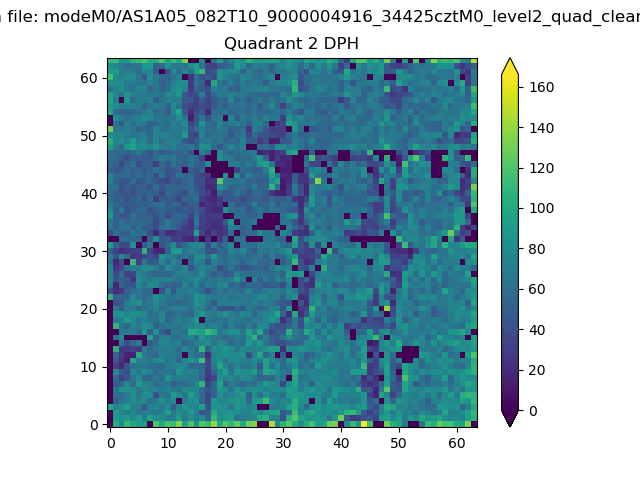
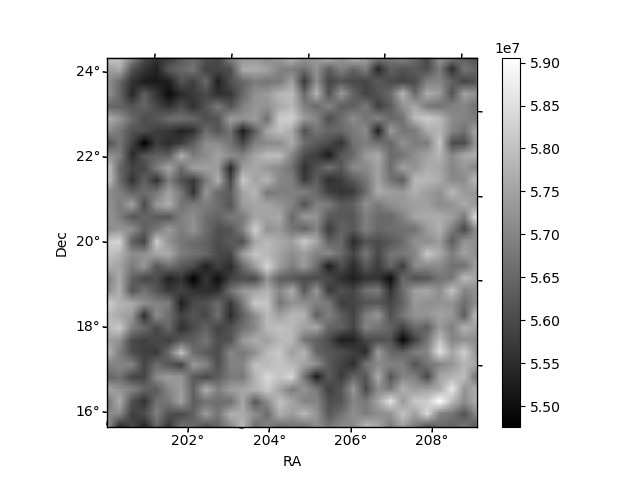
Histogram calculated using DETX and DETY for each event in the final _common_clean file
| Quadrant A | 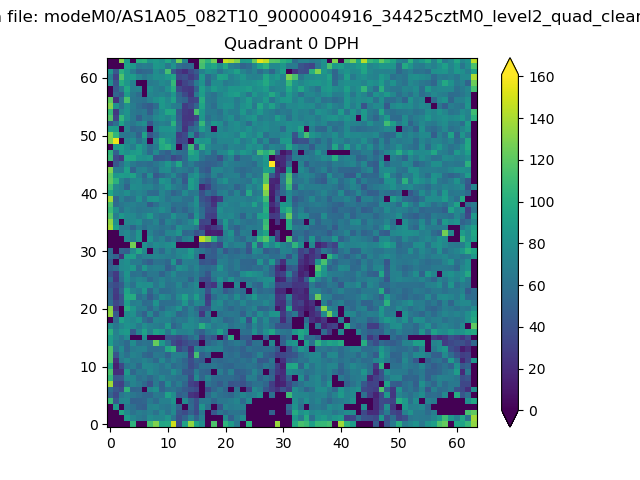 |
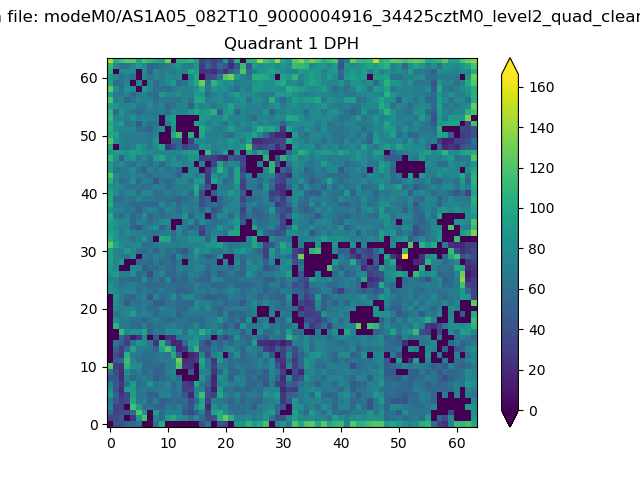 |
Quadrant B |
|---|---|---|---|
| Quadrant D | 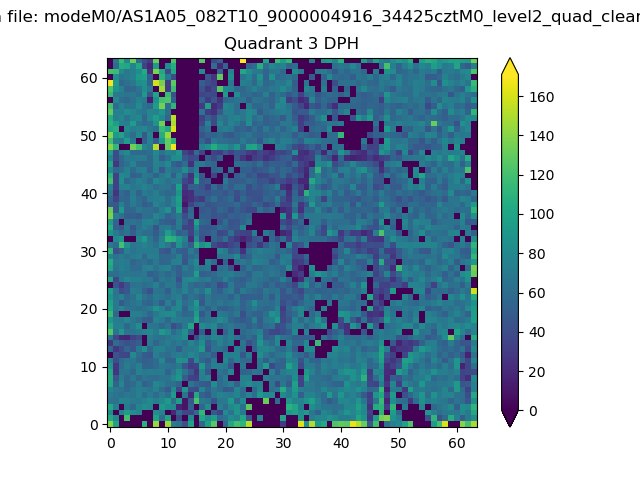 |
 |
Quadrant C |
| Plot type | Count rate plots | Images |
|---|---|---|
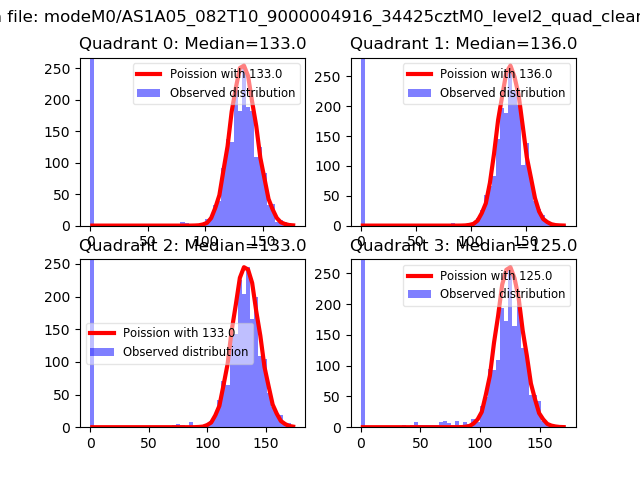
| Comparison with Poisson distribution Blue bars denote a histogram of data divided into 1 sec bins. Red curve is a Poisson curve with rate = median count rate of data. |
 |
 |
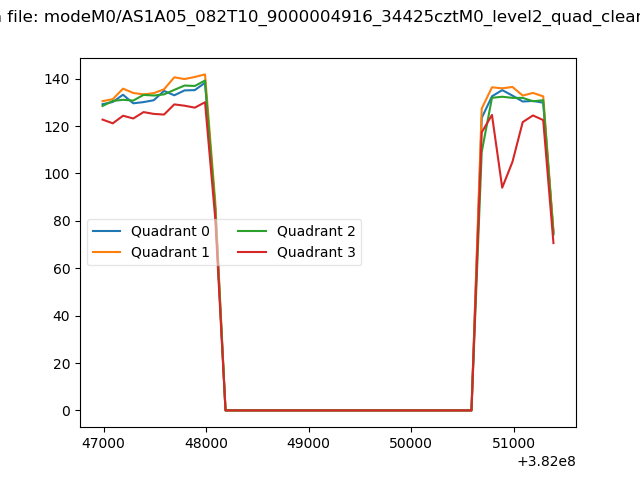
| Quadrant-wise count rates Data is divided into 100 sec bins |
 |
|
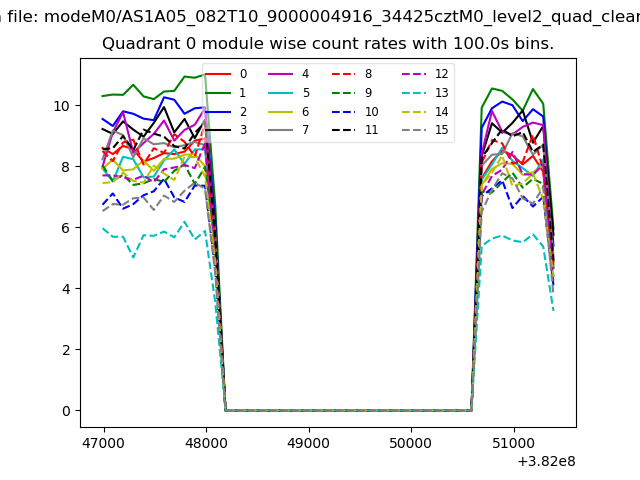
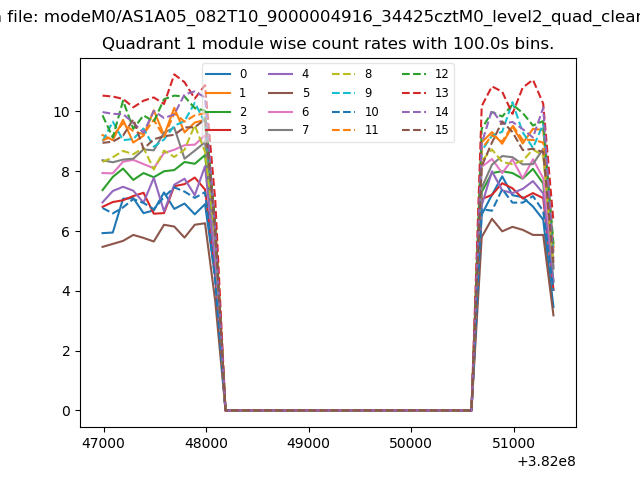
| Module-wise count rates for Quadrant A Data is divided into 100 sec bins |
 |
 |
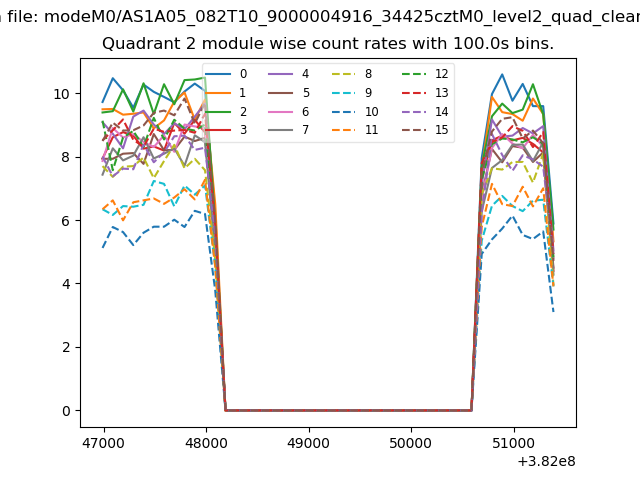
| Module-wise count rates for Quadrant B Data is divided into 100 sec bins |
 |
 |
| Module-wise count rates for Quadrant C Data is divided into 100 sec bins |
 |
 |
| Module-wise count rates for Quadrant D Data is divided into 100 sec bins |
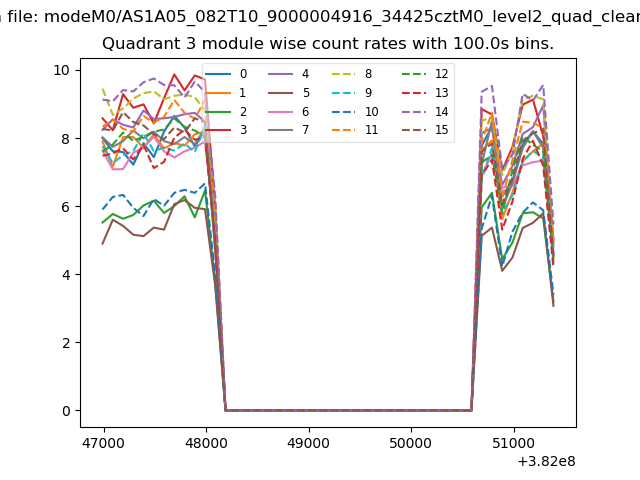 |
 |
| Parameter | Plot |
|---|---|
| CZT HV Monitor | 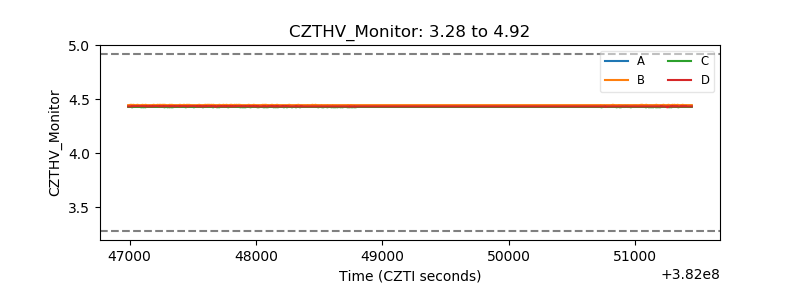 |
| D_VDD | 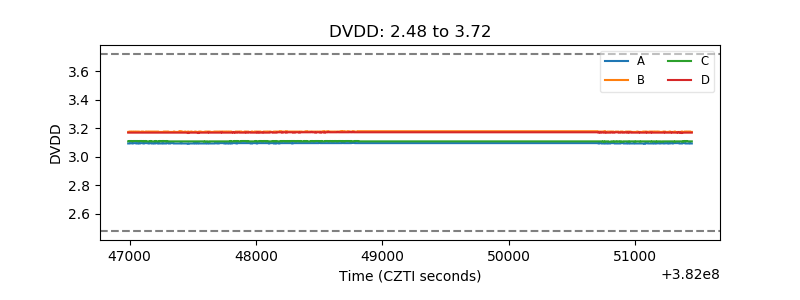 |
| Temperature 1 | 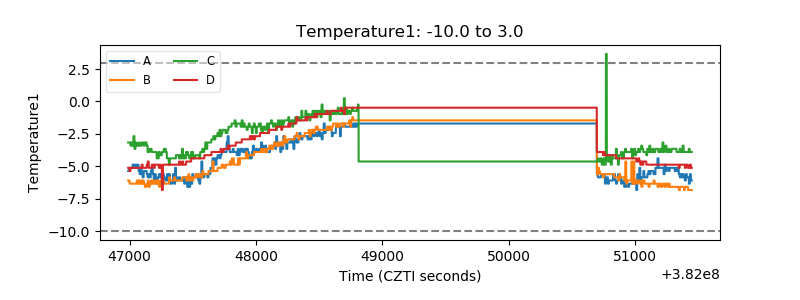 |
| Veto HV Monitor |  |
| Veto LLD | 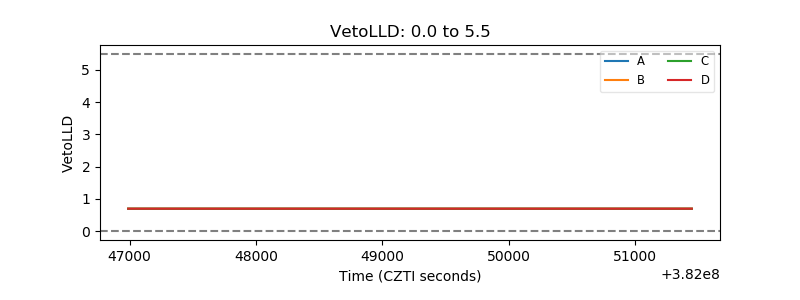 |
| Alpha Counter | 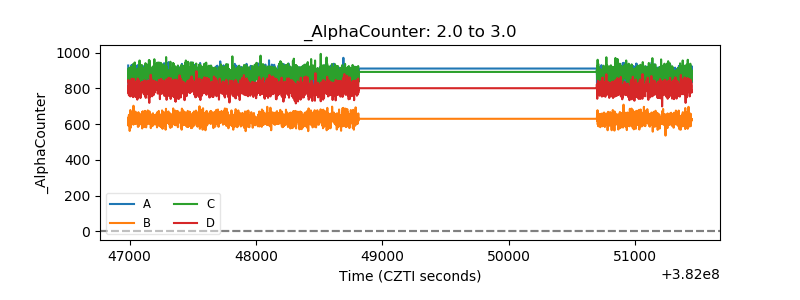 |
| _CPM_Rate | 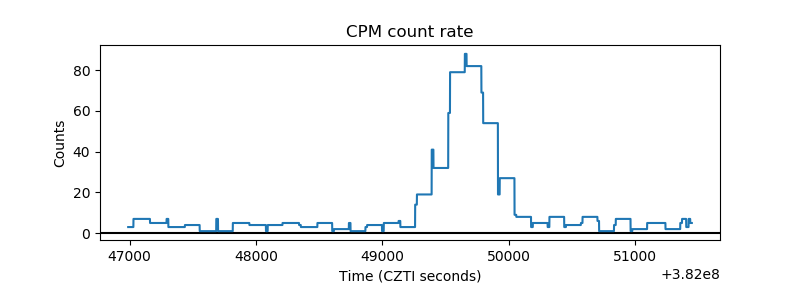 |
| CZT Counter | 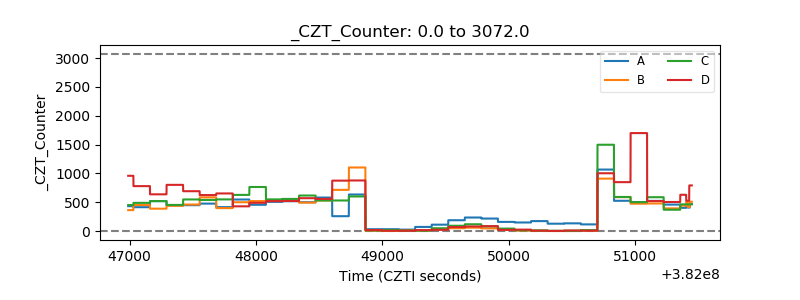 |
| +2.5 Volts monitor |  |
| +5 Volts monitor |  |
| _ROLL_ROT | 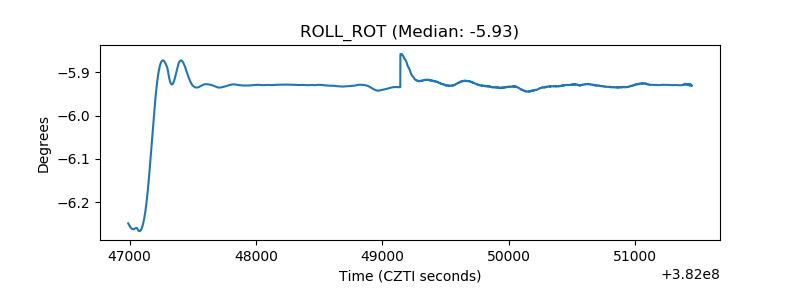 |
| _Roll_DEC | 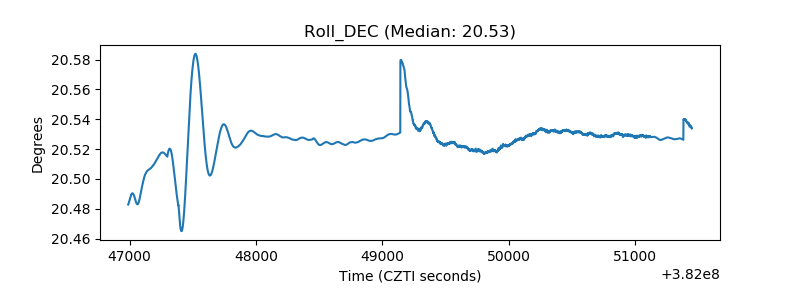 |
| _Roll_RA | 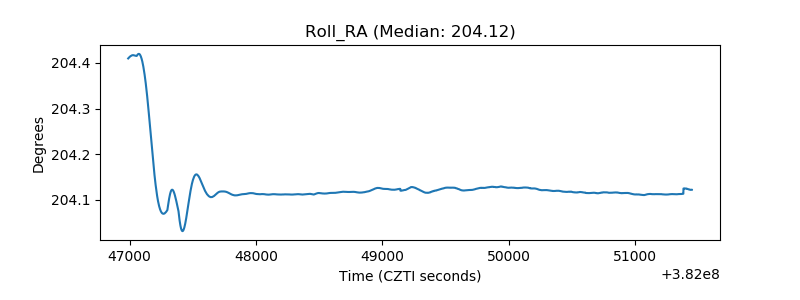 |
| Veto Counter | 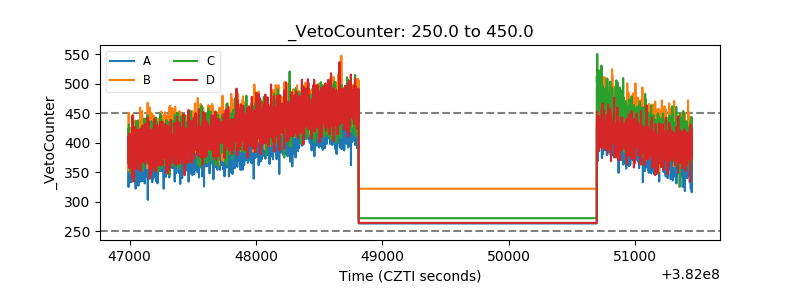 |