| Param | Original file | Final file |
|---|---|---|
| Filename | modeM0/AS1A05_082T10_9000004916_34427cztM0_level2.evt | modeM0/AS1A05_082T10_9000004916_34427cztM0_level2_quad_clean.evt |
| Size (bytes) | 491,817,600 | 74,640,960 |
| Size | 469.0 MB | 71.2 MB |
| Events in quadrant A | 2,734,537 | 468,785 |
| Events in quadrant B | 3,770,264 | 474,735 |
| Events in quadrant C | 3,085,155 | 469,398 |
| Events in quadrant D | 4,907,644 | 438,066 |
| Mode M9 | |||
|---|---|---|---|
| Quadrant | BADHDUFLAG | Total packets | Discarded packets |
| A | 0 | 25 | 0 |
| B | 0 | 25 | 0 |
| C | 0 | 25 | 0 |
| D | 0 | 26 | 0 |
| Mode SS | |||
|---|---|---|---|
| Quadrant | BADHDUFLAG | Total packets | Discarded packets |
| A | 0 | 118 | 0 |
| B | 0 | 118 | 0 |
| C | 0 | 118 | 0 |
| D | 0 | 118 | 0 |
| Mode M0 | |||
|---|---|---|---|
| Quadrant | BADHDUFLAG | Total packets | Discarded packets |
| A | 0 | 12035 | 3 |
| B | 0 | 15201 | 2 |
| C | 0 | 12595 | 2 |
| D | 0 | 18777 | 2 |
| Quadrant | Total seconds | Saturated seconds | Saturation percentage |
|---|---|---|---|
| A | 5858 | 10 | 0.170707% |
| B | 5858 | 279 | 4.762718% |
| C | 5858 | 18 | 0.307272% |
| D | 5858 | 340 | 5.804029% |
Noise dominated data is calculated using 1-second bins in cleaned event files. If a bin has >2000 counts, and if more than 50% of those come from <1% of pixels, then it is considered to be noise-dominated and hence unusable.
| Quadrant | # 1 sec bins | Bins with >0 counts | Bins with >2000 counts | High rate bins dominated by noise | Noise dominated (total time) | Noise dominated (detector-on time) | Marked lightcurve |
|---|---|---|---|---|---|---|---|
| A | 7200 | 5859 | 0 | 0 | 0.00% | 0.00% |  |
| B | 7200 | 5859 | 187 | 187 | 2.60% | 3.19% |  |
| C | 7200 | 5859 | 8 | 8 | 0.11% | 0.14% |  |
| D | 7200 | 5859 | 263 | 263 | 3.65% | 4.49% |  |
Top three noisy pixels from each quadrant. If the there are fewer than three noisy pixels in the level2.evt file, extra rows are filled as -1
| Pixel properties | Quadrant properties | ||||||
|---|---|---|---|---|---|---|---|
| Quadrant | DetID | PixID | Counts | Sigma | Mean | Median | Sigma |
| A | 10 | 83 | 35706 | 254.58 | 684 | 670 | 137.6 |
| A | 7 | 16 | 26538 | 187.97 | 684 | 670 | 137.6 |
| A | 9 | 143 | 20532 | 144.32 | 684 | 670 | 137.6 |
| B | 5 | 172 | 782635 | 6011.23 | 668 | 649 | 130.1 |
| B | 0 | 190 | 237296 | 1819.14 | 668 | 649 | 130.1 |
| B | 3 | 112 | 34788 | 262.43 | 668 | 649 | 130.1 |
| C | 15 | 214 | 245892 | 1583.19 | 663 | 669 | 154.9 |
| C | 14 | 67 | 157624 | 1013.32 | 663 | 669 | 154.9 |
| C | 0 | 10 | 63043 | 402.69 | 663 | 669 | 154.9 |
| D | 8 | 195 | 934693 | 5883.41 | 647 | 630 | 158.8 |
| D | 7 | 80 | 382702 | 2406.57 | 647 | 630 | 158.8 |
| D | 2 | 250 | 276316 | 1736.47 | 647 | 630 | 158.8 |
Histogram calculated using DETX and DETY for each event in the final _common_clean file
| Quadrant A |  |
 |
Quadrant B |
|---|---|---|---|
| Quadrant D |  |
 |
Quadrant C |
| Plot type | Count rate plots | Images |
|---|---|---|
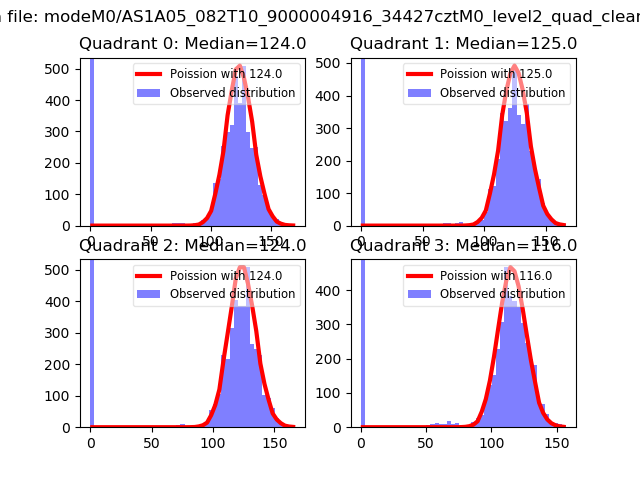
| Comparison with Poisson distribution Blue bars denote a histogram of data divided into 1 sec bins. Red curve is a Poisson curve with rate = median count rate of data. |
 |
 |
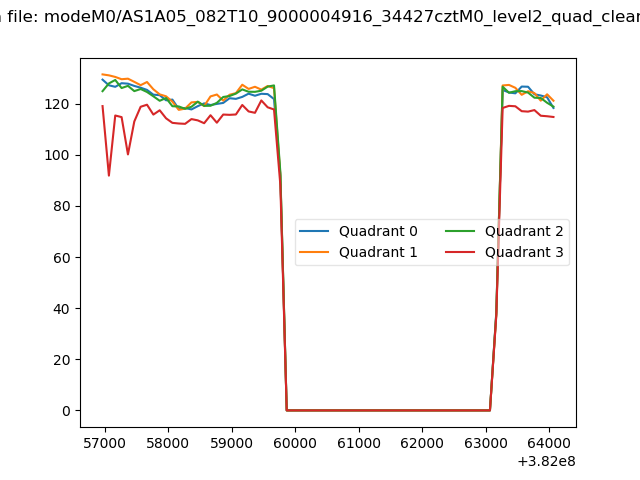
| Quadrant-wise count rates Data is divided into 100 sec bins |
 |
|
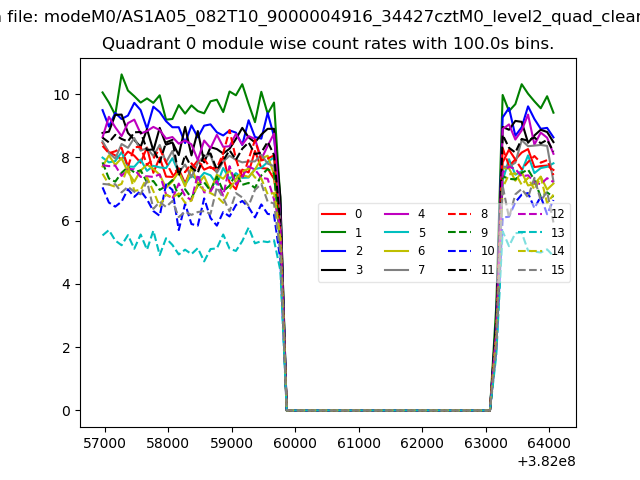
| Module-wise count rates for Quadrant A Data is divided into 100 sec bins |
 |
 |
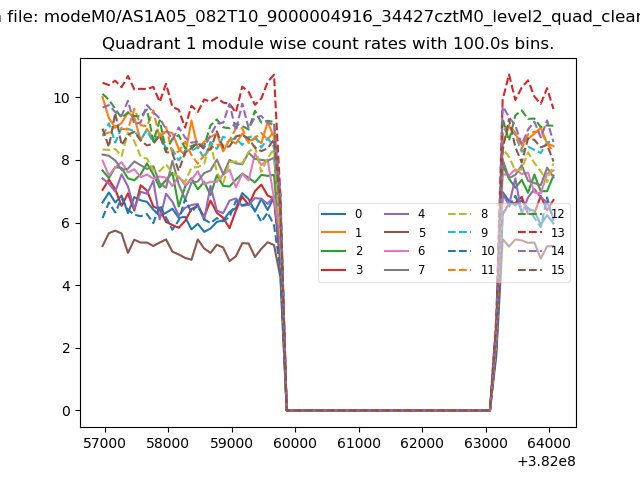
| Module-wise count rates for Quadrant B Data is divided into 100 sec bins |
 |
 |
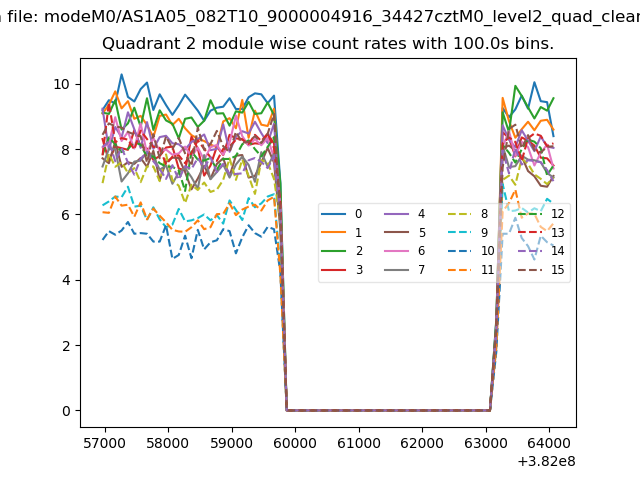
| Module-wise count rates for Quadrant C Data is divided into 100 sec bins |
 |
 |
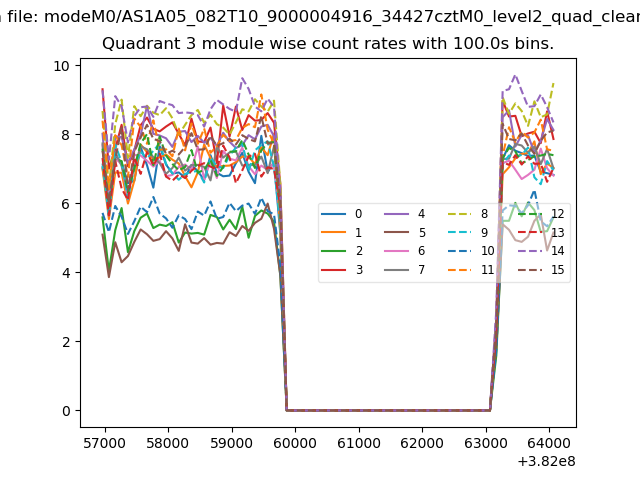
| Module-wise count rates for Quadrant D Data is divided into 100 sec bins |
 |
 |
| Parameter | Plot |
|---|---|
| CZT HV Monitor | 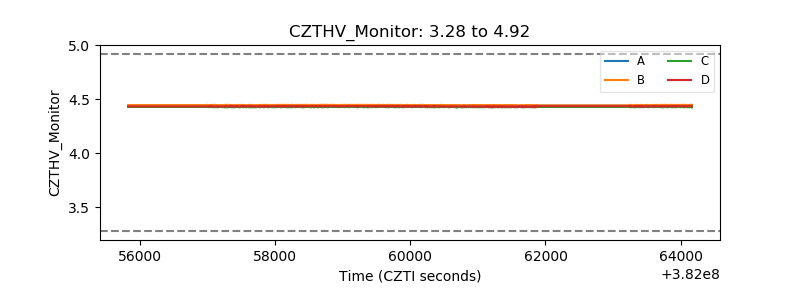 |
| D_VDD |  |
| Temperature 1 |  |
| Veto HV Monitor |  |
| Veto LLD |  |
| Alpha Counter | 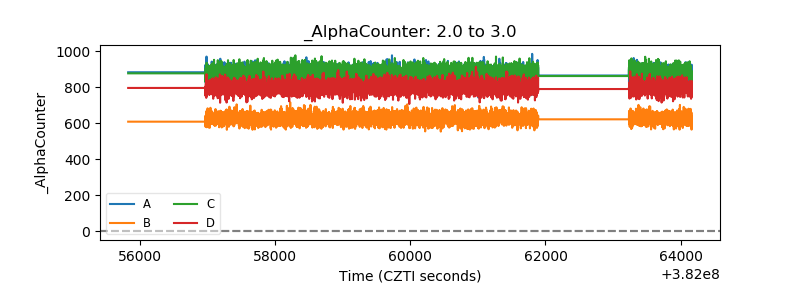 |
| _CPM_Rate | 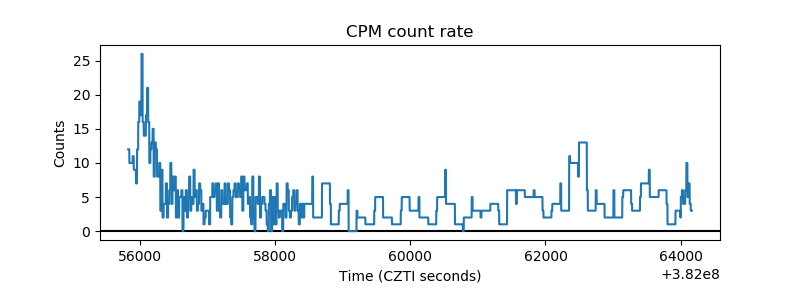 |
| CZT Counter |  |
| +2.5 Volts monitor |  |
| +5 Volts monitor |  |
| _ROLL_ROT | 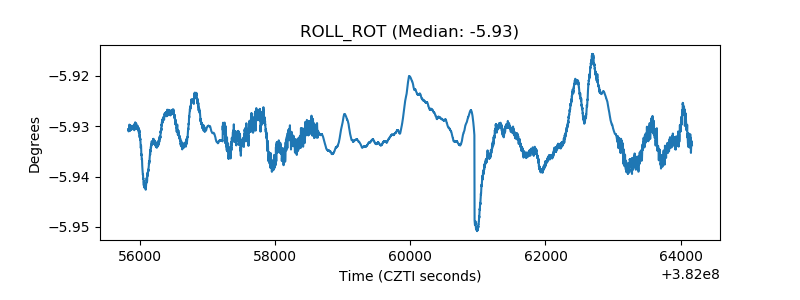 |
| _Roll_DEC | 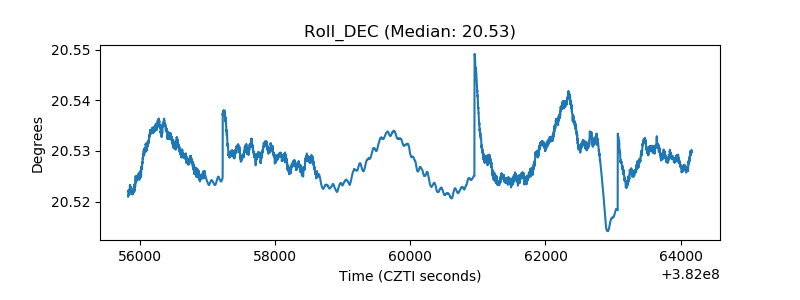 |
| _Roll_RA |  |
| Veto Counter | 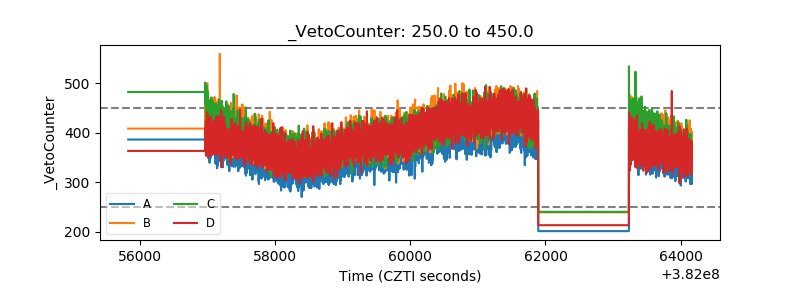 |