| Param | Original file | Final file |
|---|---|---|
| Filename | modeM0/AS1A10_058T06_9000004920cztM0_level2.fits | modeM0/AS1A10_058T06_9000004920cztM0_level2_quad_clean.evt |
| Size (bytes) | 736,361,280 | 645,166,080 |
| Size | 702.2 MB | 615.3 MB |
| Events in quadrant A | 4,724,026 | 3,950,704 |
| Events in quadrant B | 4,457,794 | 3,925,109 |
| Events in quadrant C | 4,500,898 | 3,648,596 |
| Events in quadrant D | 3,518,904 | 2,918,480 |
| Mode SS | |||
|---|---|---|---|
| Quadrant | BADHDUFLAG | Total packets | Discarded packets |
| A | 0 | 828 | 0 |
| B | 0 | 1528 | 0 |
| C | 0 | 1528 | 0 |
| D | 0 | 1528 | 0 |
| Mode M0 | |||
|---|---|---|---|
| Quadrant | BADHDUFLAG | Total packets | Discarded packets |
| A | 0 | 172608 | 0 |
| B | 0 | 180160 | 0 |
| C | 0 | 191082 | 0 |
| D | 0 | 301501 | 0 |
| Mode M9 | |||
|---|---|---|---|
| Quadrant | BADHDUFLAG | Total packets | Discarded packets |
| A | 0 | 305 | 0 |
| B | 0 | 305 | 0 |
| C | 0 | 305 | 0 |
| D | 0 | 305 | 0 |
| Quadrant | Total seconds | Saturated seconds | Saturation percentage |
|---|---|---|---|
| A | 74851 | 1258 | 1.680672% |
| B | 74851 | 2129 | 2.844317% |
| C | 74851 | 2133 | 2.849661% |
| D | 74851 | 11315 | 15.116699% |
Noise dominated data is calculated using 1-second bins in cleaned event files. If a bin has >2000 counts, and if more than 50% of those come from <1% of pixels, then it is considered to be noise-dominated and hence unusable.
| Quadrant | # 1 sec bins | Bins with >0 counts | Bins with >2000 counts | High rate bins dominated by noise | Noise dominated (total time) | Noise dominated (detector-on time) | Marked lightcurve |
|---|---|---|---|---|---|---|---|
| A | 105240 | 74831 | 0 | 0 | 0.00% | 0.00% |  |
| B | 105240 | 74843 | 0 | 0 | 0.00% | 0.00% |  |
| C | 105240 | 74788 | 0 | 0 | 0.00% | 0.00% |  |
| D | 105240 | 71912 | 0 | 0 | 0.00% | 0.00% |  |
Top three noisy pixels from each quadrant. If the there are fewer than three noisy pixels in the level2.evt file, extra rows are filled as -1
| Pixel properties | Quadrant properties | ||||||
|---|---|---|---|---|---|---|---|
| Quadrant | DetID | PixID | Counts | Sigma | Mean | Median | Sigma |
| A | 9 | 19 | 3825 | 9.0 | 1234 | 1167 | 295.3 |
| A | 7 | 110 | 3747 | 8.74 | 1234 | 1167 | 295.3 |
| A | 0 | 29 | 3666 | 8.46 | 1234 | 1167 | 295.3 |
| B | 2 | 9 | 3815 | 11.75 | 1183 | 1136 | 228.0 |
| B | 3 | 80 | 3294 | 9.46 | 1183 | 1136 | 228.0 |
| B | 5 | 128 | 3182 | 8.97 | 1183 | 1136 | 228.0 |
| C | 1 | 81 | 3722 | 8.76 | 1188 | 1122 | 296.6 |
| C | 1 | 80 | 3687 | 8.65 | 1188 | 1122 | 296.6 |
| C | 3 | 202 | 3420 | 7.75 | 1188 | 1122 | 296.6 |
| D | 7 | 3 | 2647 | 6.51 | 1010 | 926 | 264.4 |
| D | 10 | 113 | 2638 | 6.47 | 1010 | 926 | 264.4 |
| D | 6 | 67 | 2573 | 6.23 | 1010 | 926 | 264.4 |
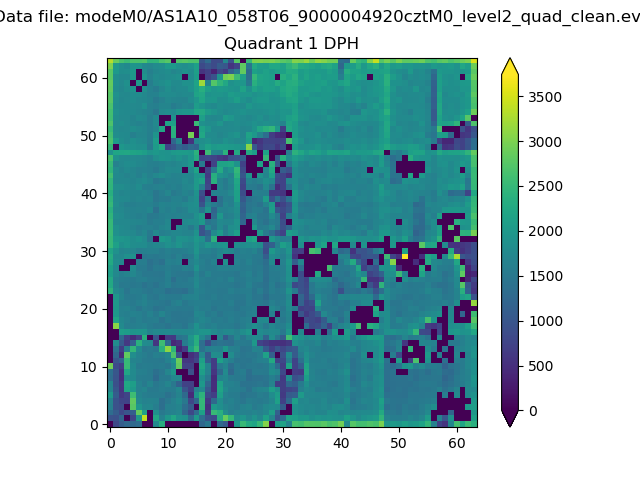
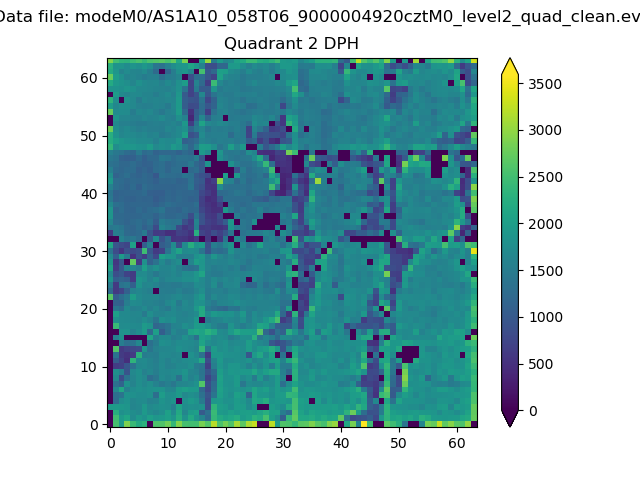
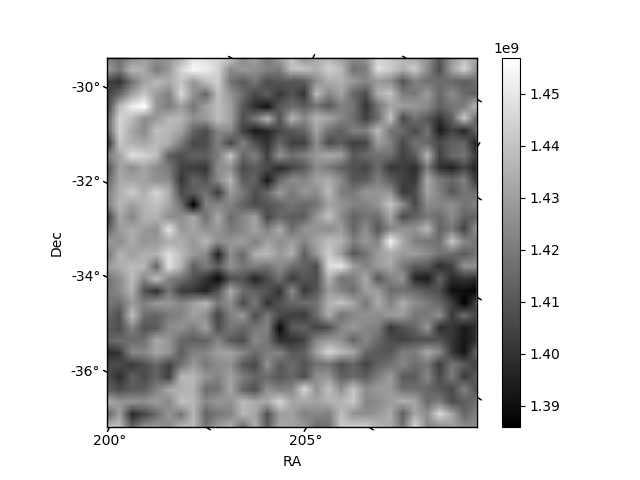
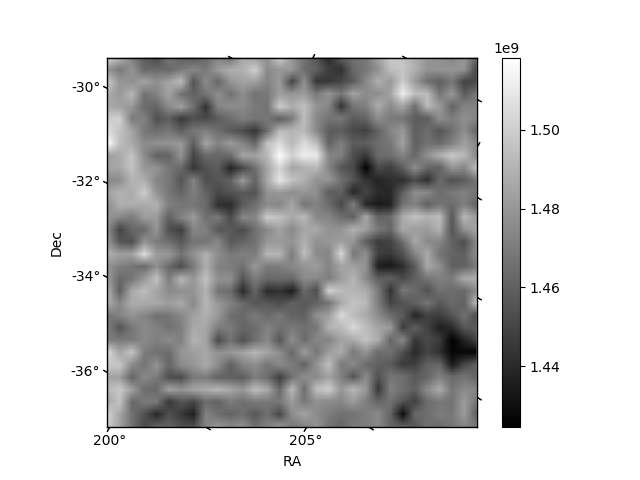
Histogram calculated using DETX and DETY for each event in the final _common_clean file
| Quadrant A |  |
 |
Quadrant B |
|---|---|---|---|
| Quadrant D |  |
 |
Quadrant C |
| Plot type | Count rate plots | Images |
|---|---|---|
| Comparison with Poisson distribution Blue bars denote a histogram of data divided into 1 sec bins. Red curve is a Poisson curve with rate = median count rate of data. |
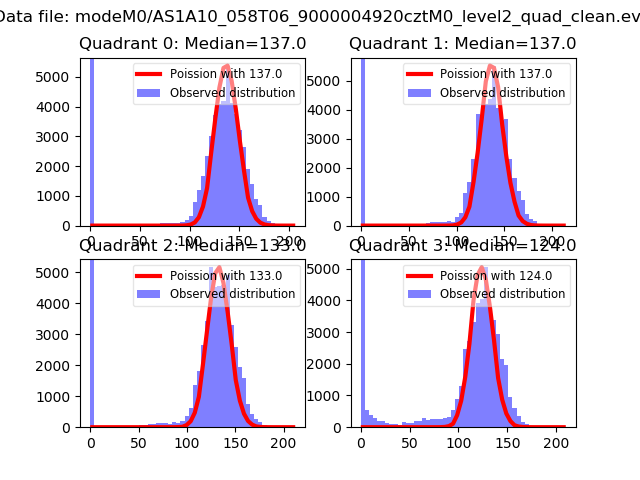 |
 |
| Quadrant-wise count rates Data is divided into 100 sec bins |
 |
|
| Module-wise count rates for Quadrant A Data is divided into 100 sec bins |
 |
 |
| Module-wise count rates for Quadrant B Data is divided into 100 sec bins |
 |
 |
| Module-wise count rates for Quadrant C Data is divided into 100 sec bins |
 |
 |
| Module-wise count rates for Quadrant D Data is divided into 100 sec bins |
 |
 |
| Parameter | Plot |
|---|---|
| CZT HV Monitor |  |
| D_VDD |  |
| Temperature 1 | 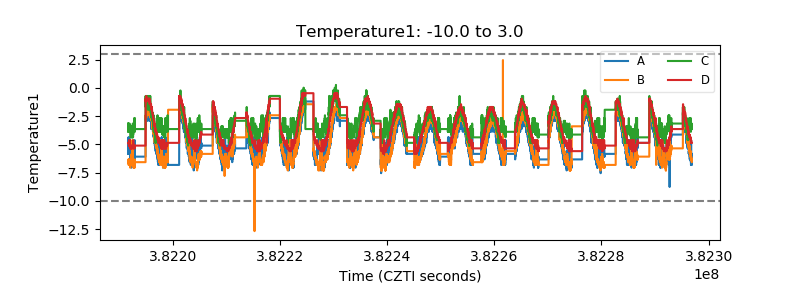 |
| Veto HV Monitor |  |
| Veto LLD |  |
| Alpha Counter |  |
| _CPM_Rate |  |
| CZT Counter | 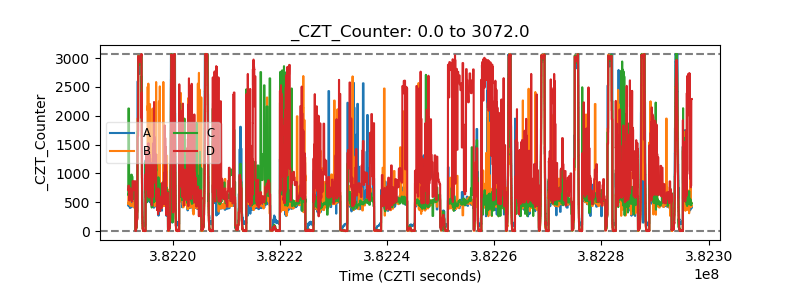 |
| +2.5 Volts monitor |  |
| +5 Volts monitor |  |
| _ROLL_ROT |  |
| _Roll_DEC | 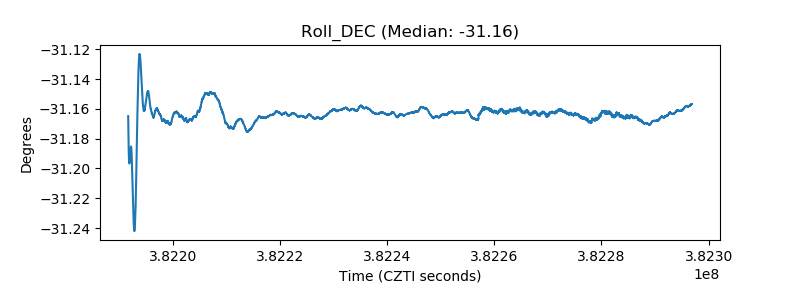 |
| _Roll_RA | 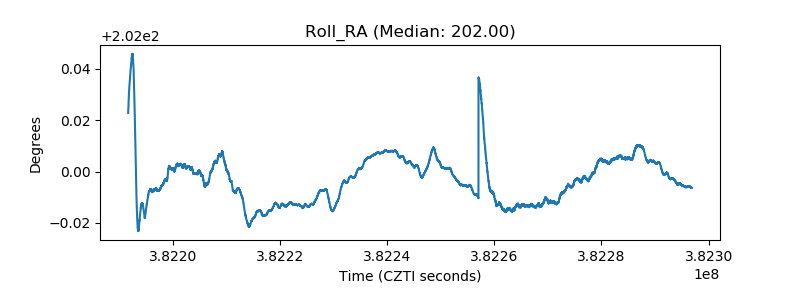 |
| Veto Counter |  |