| Param | Original file | Final file |
|---|---|---|
| Filename | modeM0/AS1A10_058T06_9000004920_34467cztM0_level2.evt | modeM0/AS1A10_058T06_9000004920_34467cztM0_level2_quad_clean.evt |
| Size (bytes) | 429,569,280 | 71,801,280 |
| Size | 409.7 MB | 68.5 MB |
| Events in quadrant A | 2,636,585 | 470,934 |
| Events in quadrant B | 2,752,570 | 473,996 |
| Events in quadrant C | 2,855,116 | 457,058 |
| Events in quadrant D | 4,435,695 | 431,182 |
| Mode SS | |||
|---|---|---|---|
| Quadrant | BADHDUFLAG | Total packets | Discarded packets |
| A | 0 | 100 | 0 |
| B | 0 | 100 | 0 |
| C | 0 | 100 | 0 |
| D | 0 | 100 | 0 |
| Mode M0 | |||
|---|---|---|---|
| Quadrant | BADHDUFLAG | Total packets | Discarded packets |
| A | 0 | 10751 | 2 |
| B | 0 | 11049 | 1 |
| C | 0 | 11374 | 1 |
| D | 0 | 16599 | 1 |
| Mode M9 | |||
|---|---|---|---|
| Quadrant | BADHDUFLAG | Total packets | Discarded packets |
| A | 0 | 21 | 0 |
| B | 0 | 21 | 0 |
| C | 0 | 21 | 0 |
| D | 0 | 21 | 0 |
| Quadrant | Total seconds | Saturated seconds | Saturation percentage |
|---|---|---|---|
| A | 4856 | 42 | 0.864909% |
| B | 4856 | 88 | 1.812191% |
| C | 4856 | 30 | 0.617792% |
| D | 4856 | 167 | 3.439044% |
Noise dominated data is calculated using 1-second bins in cleaned event files. If a bin has >2000 counts, and if more than 50% of those come from <1% of pixels, then it is considered to be noise-dominated and hence unusable.
| Quadrant | # 1 sec bins | Bins with >0 counts | Bins with >2000 counts | High rate bins dominated by noise | Noise dominated (total time) | Noise dominated (detector-on time) | Marked lightcurve |
|---|---|---|---|---|---|---|---|
| A | 6979 | 4857 | 27 | 27 | 0.39% | 0.56% | 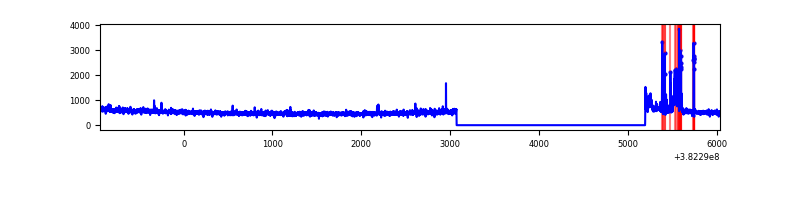 |
| B | 6979 | 4857 | 57 | 57 | 0.82% | 1.17% | 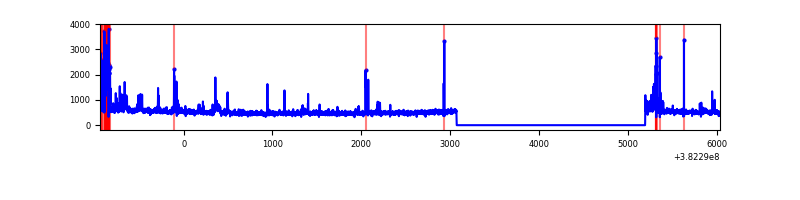 |
| C | 6979 | 4857 | 26 | 26 | 0.37% | 0.54% | 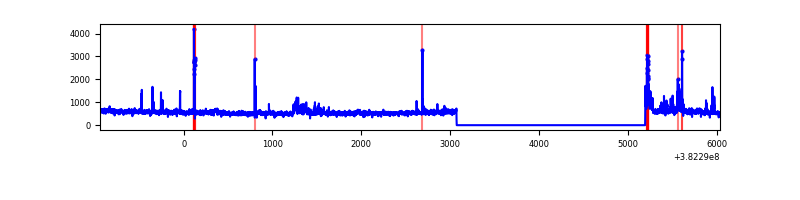 |
| D | 6978 | 4856 | 131 | 131 | 1.88% | 2.70% | 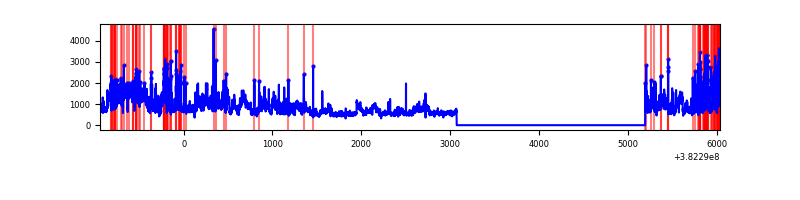 |
Top three noisy pixels from each quadrant. If the there are fewer than three noisy pixels in the level2.evt file, extra rows are filled as -1
| Pixel properties | Quadrant properties | ||||||
|---|---|---|---|---|---|---|---|
| Quadrant | DetID | PixID | Counts | Sigma | Mean | Median | Sigma |
| A | 15 | 169 | 176531 | 1417.32 | 624 | 614 | 124.1 |
| A | 10 | 83 | 25205 | 198.12 | 624 | 614 | 124.1 |
| A | 13 | 6 | 20349 | 159.0 | 624 | 614 | 124.1 |
| B | 5 | 172 | 279439 | 2380.17 | 616 | 602 | 117.2 |
| B | 0 | 190 | 20698 | 171.54 | 616 | 602 | 117.2 |
| B | 0 | 229 | 17331 | 142.8 | 616 | 602 | 117.2 |
| C | 15 | 214 | 203495 | 1475.27 | 598 | 604 | 137.5 |
| C | 15 | 208 | 108995 | 788.14 | 598 | 604 | 137.5 |
| C | 14 | 67 | 91356 | 659.88 | 598 | 604 | 137.5 |
| D | 8 | 195 | 1198624 | 7731.18 | 586 | 575 | 155.0 |
| D | 7 | 223 | 209055 | 1345.35 | 586 | 575 | 155.0 |
| D | 1 | 52 | 173113 | 1113.41 | 586 | 575 | 155.0 |
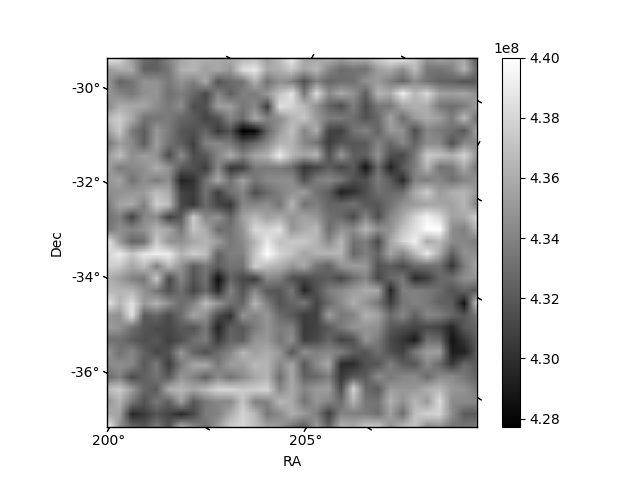
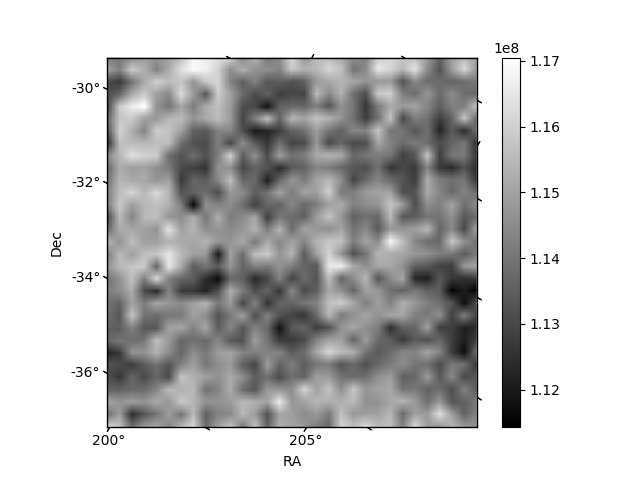
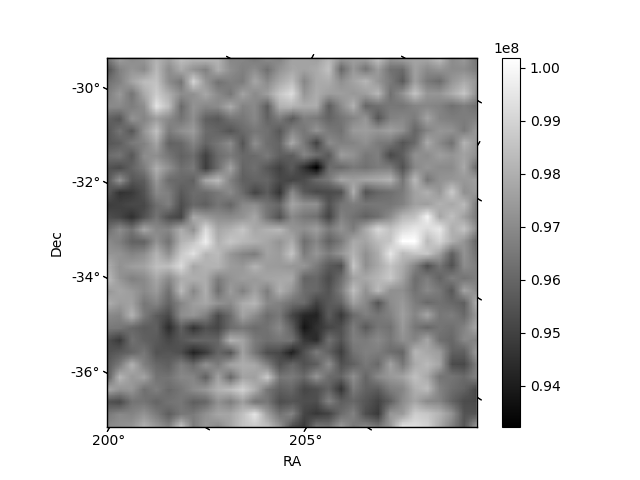
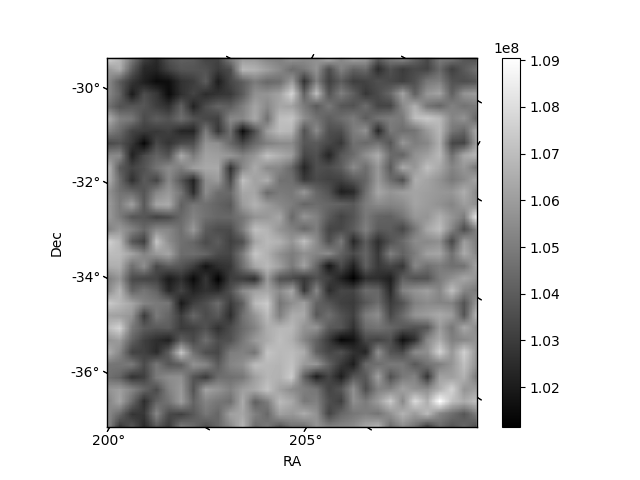
Histogram calculated using DETX and DETY for each event in the final _common_clean file
| Quadrant A | 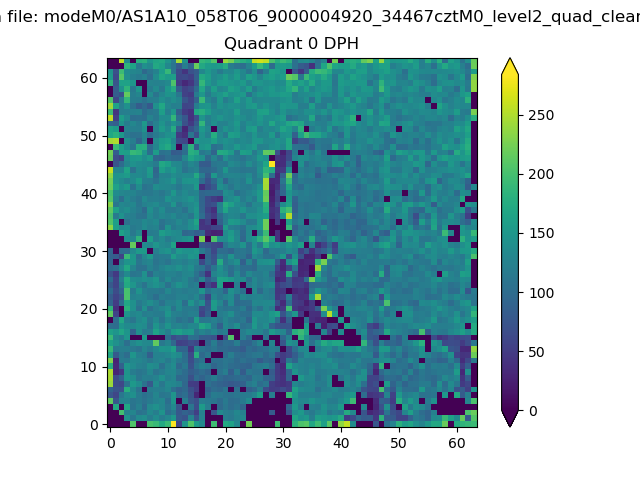 |
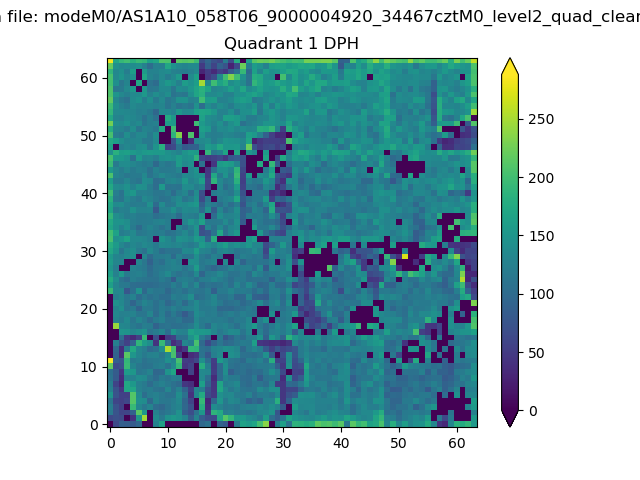 |
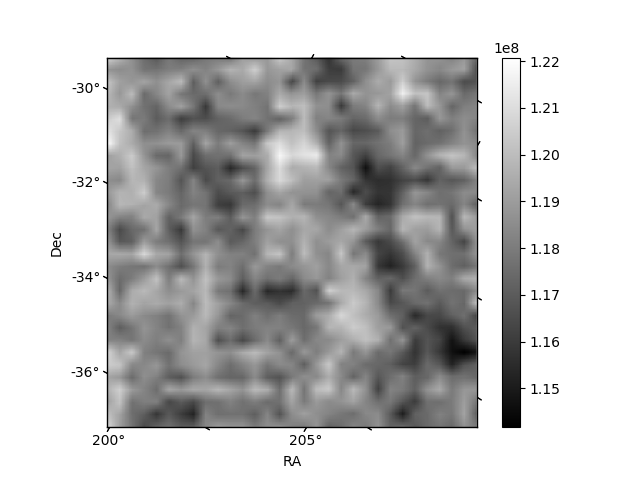
Quadrant B |
|---|---|---|---|
| Quadrant D | 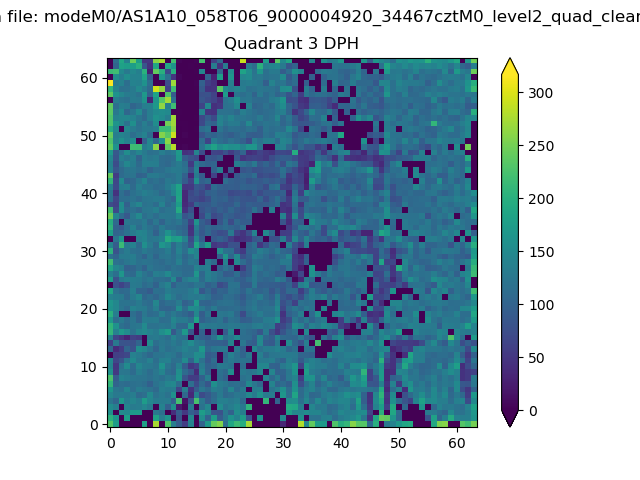 |
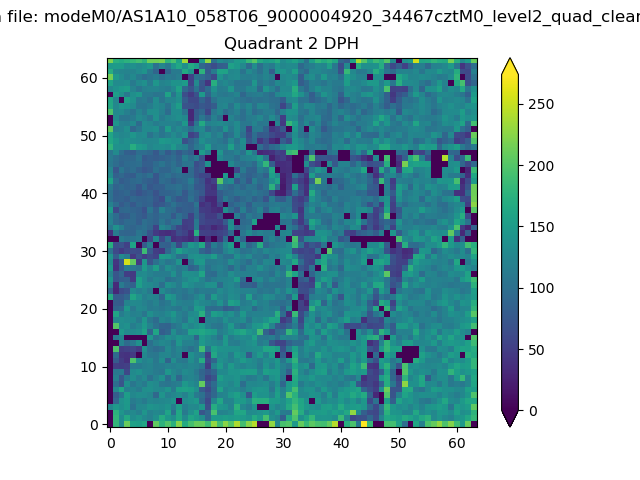 |
Quadrant C |
| Plot type | Count rate plots | Images |
|---|---|---|
| Comparison with Poisson distribution Blue bars denote a histogram of data divided into 1 sec bins. Red curve is a Poisson curve with rate = median count rate of data. |
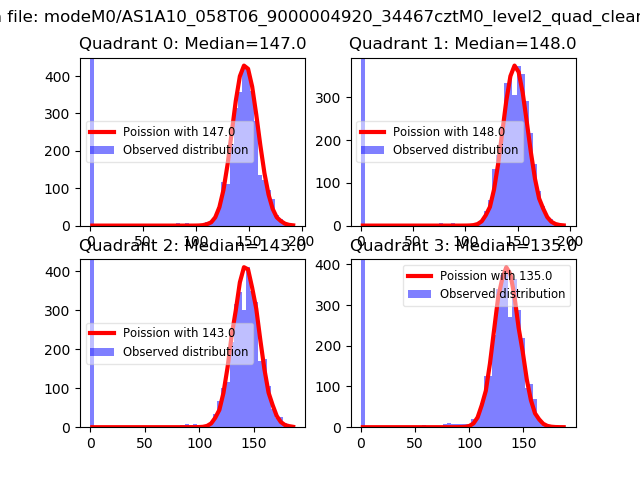 |
 |
| Quadrant-wise count rates Data is divided into 100 sec bins |
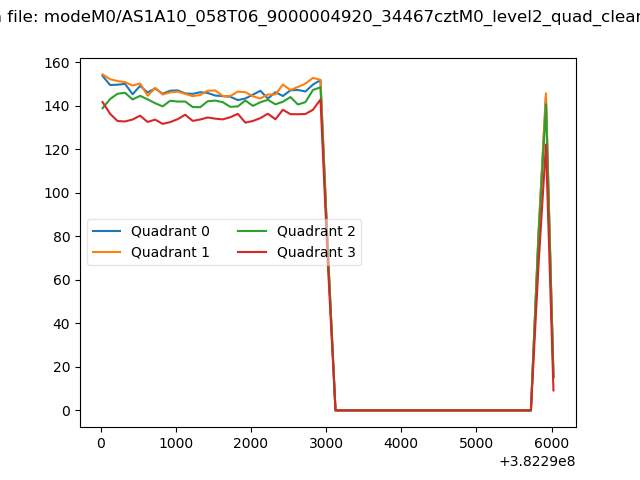 |
|
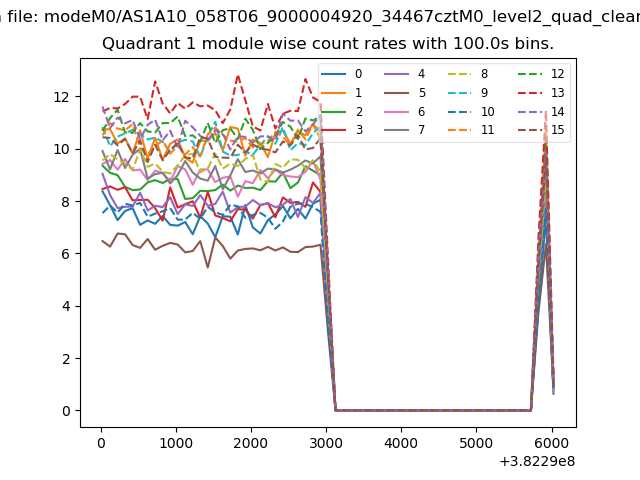
| Module-wise count rates for Quadrant A Data is divided into 100 sec bins |
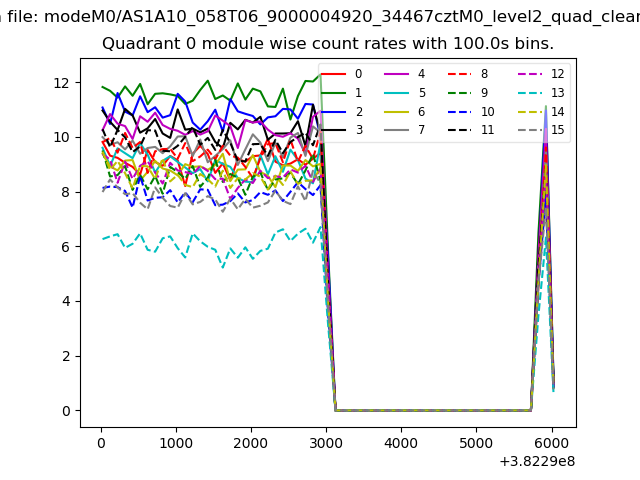 |
 |
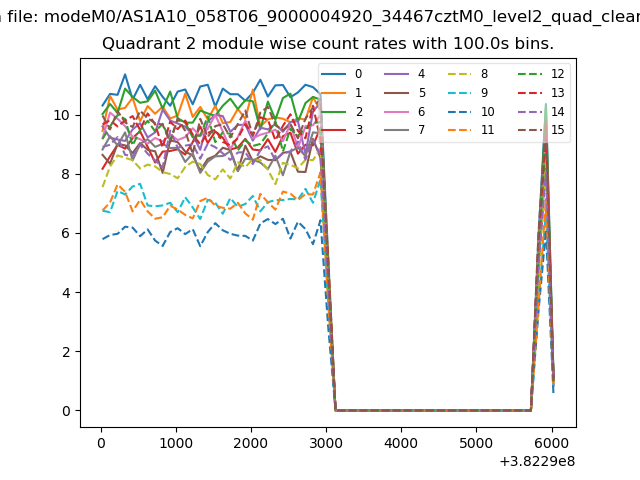
| Module-wise count rates for Quadrant B Data is divided into 100 sec bins |
 |
 |
| Module-wise count rates for Quadrant C Data is divided into 100 sec bins |
 |
 |
| Module-wise count rates for Quadrant D Data is divided into 100 sec bins |
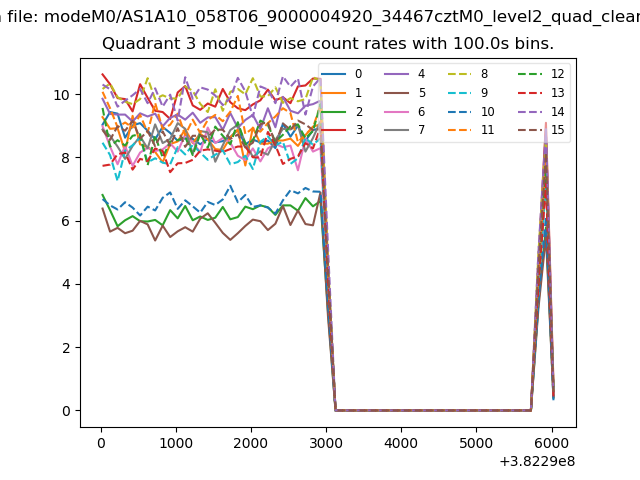 |
 |
| Parameter | Plot |
|---|---|
| CZT HV Monitor | 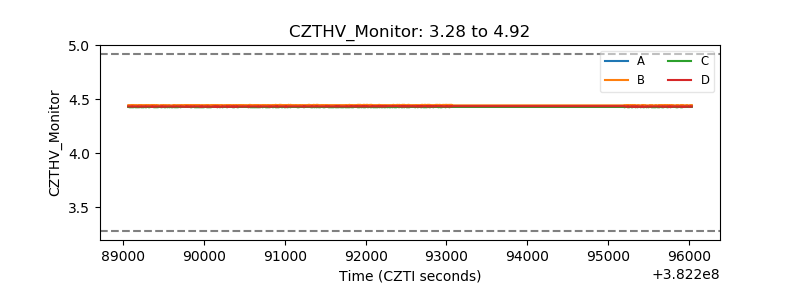 |
| D_VDD | 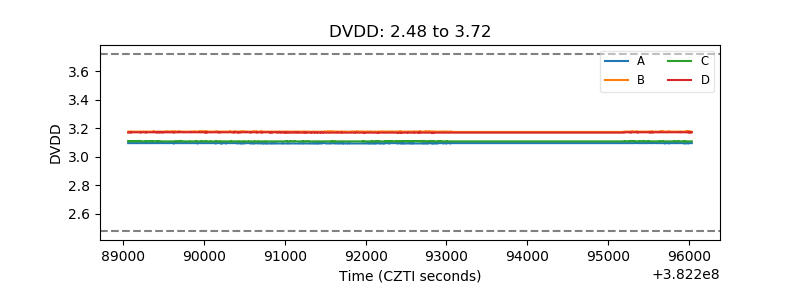 |
| Temperature 1 | 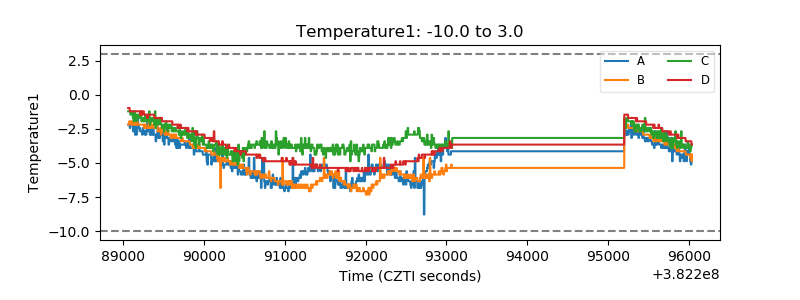 |
| Veto HV Monitor | 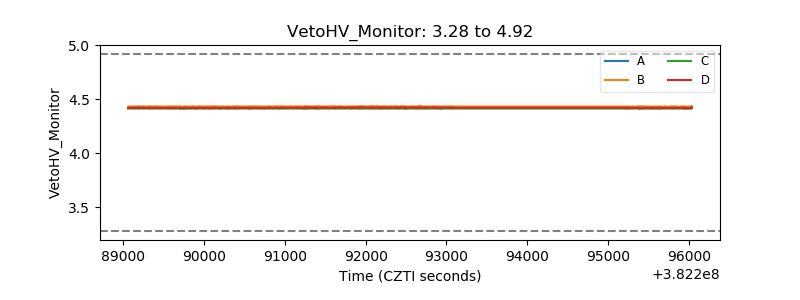 |
| Veto LLD | 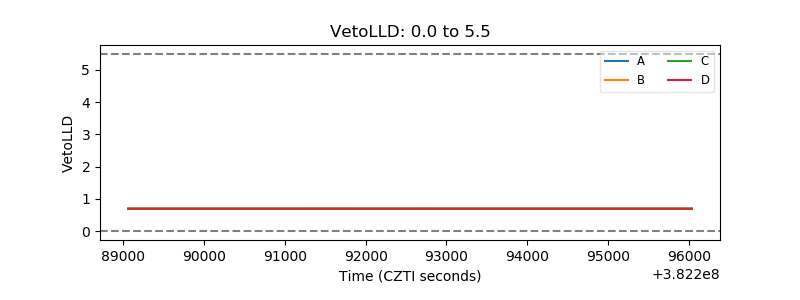 |
| Alpha Counter | 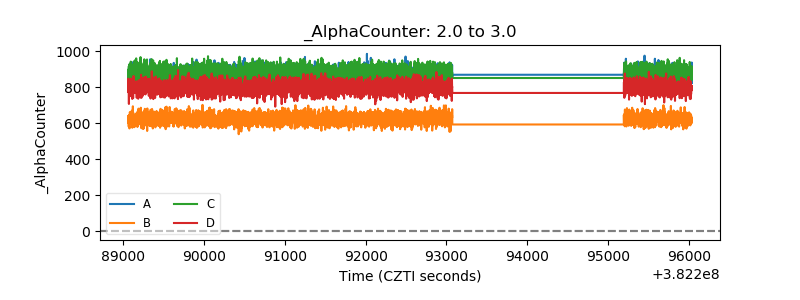 |
| _CPM_Rate | 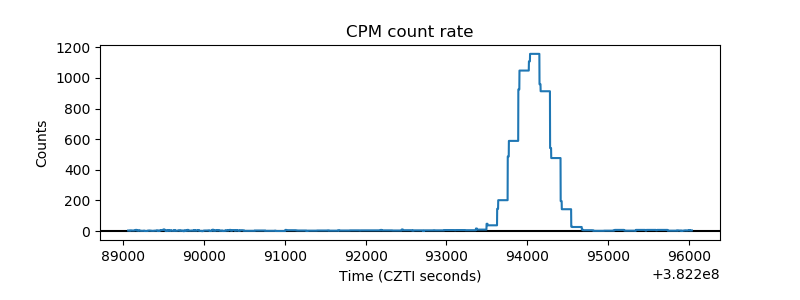 |
| CZT Counter | 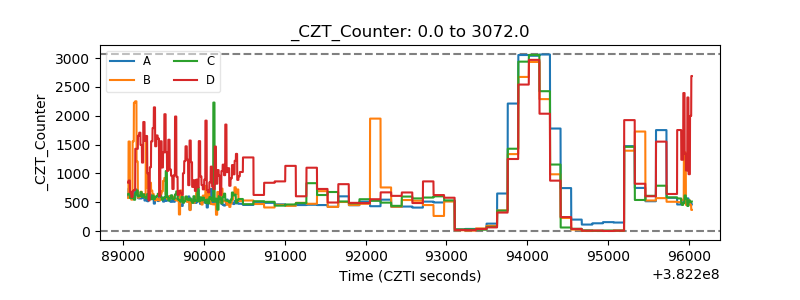 |
| +2.5 Volts monitor |  |
| +5 Volts monitor |  |
| _ROLL_ROT | 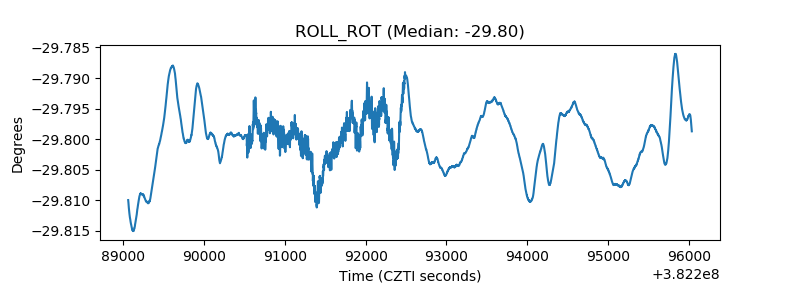 |
| _Roll_DEC | 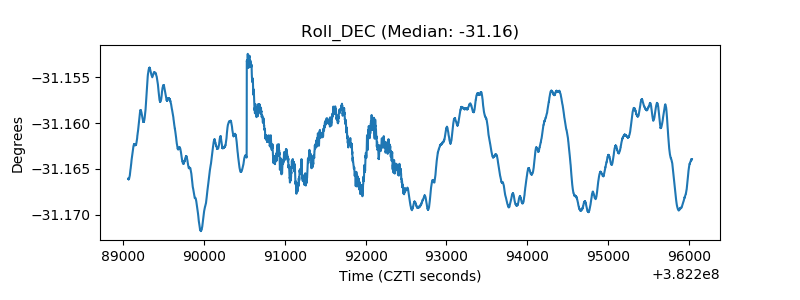 |
| _Roll_RA | 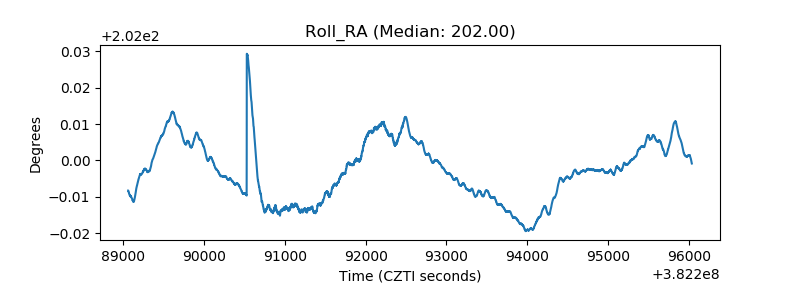 |
| Veto Counter | 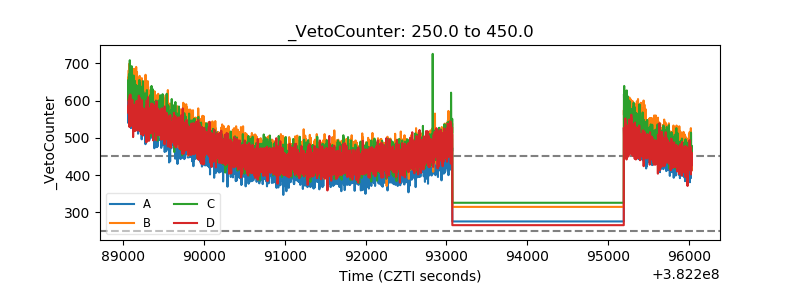 |