| Param | Original file | Final file |
|---|---|---|
| Filename | modeM0/AS1A10_071T13_9000004922cztM0_level2.fits | modeM0/AS1A10_071T13_9000004922cztM0_level2_quad_clean.evt |
| Size (bytes) | 373,913,280 | 344,211,840 |
| Size | 356.6 MB | 328.3 MB |
| Events in quadrant A | 2,346,232 | 2,071,384 |
| Events in quadrant B | 2,195,212 | 2,066,060 |
| Events in quadrant C | 2,263,050 | 1,985,775 |
| Events in quadrant D | 1,844,528 | 1,627,324 |
| Mode M9 | |||
|---|---|---|---|
| Quadrant | BADHDUFLAG | Total packets | Discarded packets |
| A | 0 | 142 | 0 |
| B | 0 | 142 | 0 |
| C | 0 | 142 | 0 |
| D | 0 | 142 | 0 |
| Mode SS | |||
|---|---|---|---|
| Quadrant | BADHDUFLAG | Total packets | Discarded packets |
| A | 0 | 794 | 0 |
| B | 0 | 794 | 0 |
| C | 0 | 794 | 0 |
| D | 0 | 794 | 0 |
| Mode M0 | |||
|---|---|---|---|
| Quadrant | BADHDUFLAG | Total packets | Discarded packets |
| A | 0 | 84538 | 0 |
| B | 0 | 93984 | 0 |
| C | 0 | 86170 | 0 |
| D | 0 | 151702 | 0 |
| Quadrant | Total seconds | Saturated seconds | Saturation percentage |
|---|---|---|---|
| A | 38928 | 201 | 0.516338% |
| B | 38928 | 1334 | 3.426839% |
| C | 38928 | 249 | 0.639642% |
| D | 38928 | 4688 | 12.042746% |
Noise dominated data is calculated using 1-second bins in cleaned event files. If a bin has >2000 counts, and if more than 50% of those come from <1% of pixels, then it is considered to be noise-dominated and hence unusable.
| Quadrant | # 1 sec bins | Bins with >0 counts | Bins with >2000 counts | High rate bins dominated by noise | Noise dominated (total time) | Noise dominated (detector-on time) | Marked lightcurve |
|---|---|---|---|---|---|---|---|
| A | 63245 | 38928 | 0 | 0 | 0.00% | 0.00% |  |
| B | 63245 | 38920 | 0 | 0 | 0.00% | 0.00% | 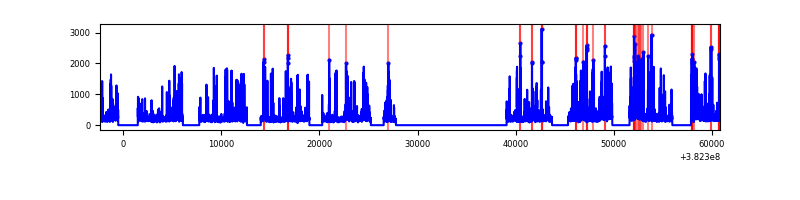 |
| C | 63245 | 38927 | 0 | 0 | 0.00% | 0.00% | 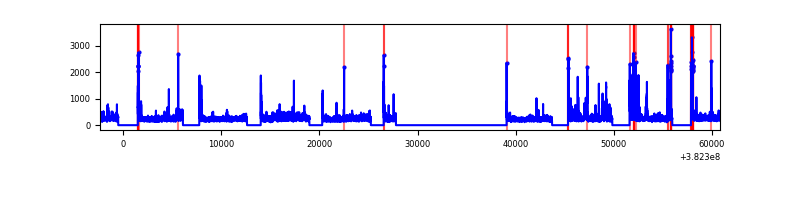 |
| D | 63245 | 38915 | 0 | 0 | 0.00% | 0.00% |  |
Top three noisy pixels from each quadrant. If the there are fewer than three noisy pixels in the level2.evt file, extra rows are filled as -1
| Pixel properties | Quadrant properties | ||||||
|---|---|---|---|---|---|---|---|
| Quadrant | DetID | PixID | Counts | Sigma | Mean | Median | Sigma |
| A | 0 | 29 | 1916 | 8.86 | 612 | 576 | 151.2 |
| A | 7 | 110 | 1887 | 8.67 | 612 | 576 | 151.2 |
| A | 9 | 19 | 1880 | 8.63 | 612 | 576 | 151.2 |
| B | 2 | 9 | 1924 | 11.8 | 582 | 556 | 115.9 |
| B | 5 | 128 | 1564 | 8.7 | 582 | 556 | 115.9 |
| B | 2 | 8 | 1553 | 8.6 | 582 | 556 | 115.9 |
| C | 3 | 187 | 1567 | 6.65 | 599 | 563 | 150.9 |
| C | 3 | 158 | 1537 | 6.45 | 599 | 563 | 150.9 |
| C | 9 | 233 | 1463 | 5.96 | 599 | 563 | 150.9 |
| D | 4 | 160 | 1378 | 6.38 | 528 | 482 | 140.4 |
| D | 6 | 38 | 1367 | 6.3 | 528 | 482 | 140.4 |
| D | 10 | 189 | 1353 | 6.2 | 528 | 482 | 140.4 |
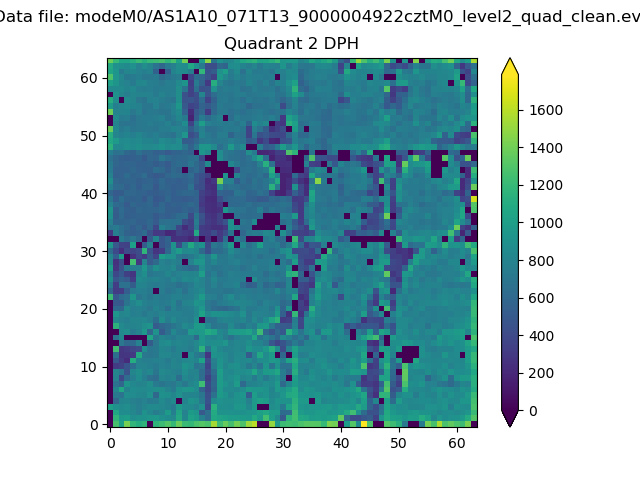
Histogram calculated using DETX and DETY for each event in the final _common_clean file
| Quadrant A | 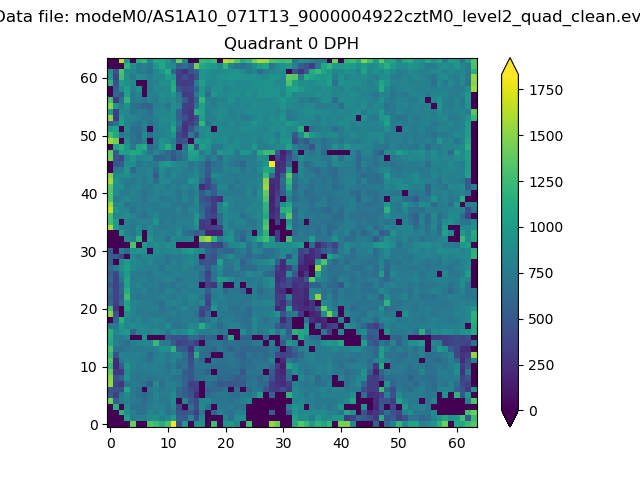 |
 |
Quadrant B |
|---|---|---|---|
| Quadrant D | 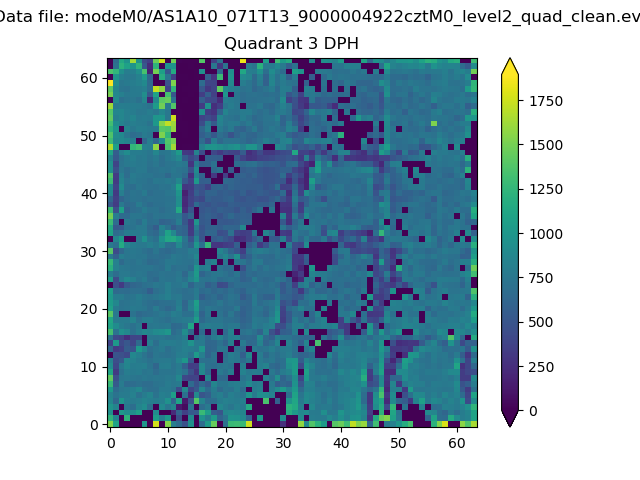 |
 |
Quadrant C |
| Plot type | Count rate plots | Images |
|---|---|---|
| Comparison with Poisson distribution Blue bars denote a histogram of data divided into 1 sec bins. Red curve is a Poisson curve with rate = median count rate of data. |
 |
 |
| Quadrant-wise count rates Data is divided into 100 sec bins |
 |
|
| Module-wise count rates for Quadrant A Data is divided into 100 sec bins |
 |
 |
| Module-wise count rates for Quadrant B Data is divided into 100 sec bins |
 |
 |
| Module-wise count rates for Quadrant C Data is divided into 100 sec bins |
 |
 |
| Module-wise count rates for Quadrant D Data is divided into 100 sec bins |
 |
 |
| Parameter | Plot |
|---|---|
| CZT HV Monitor | 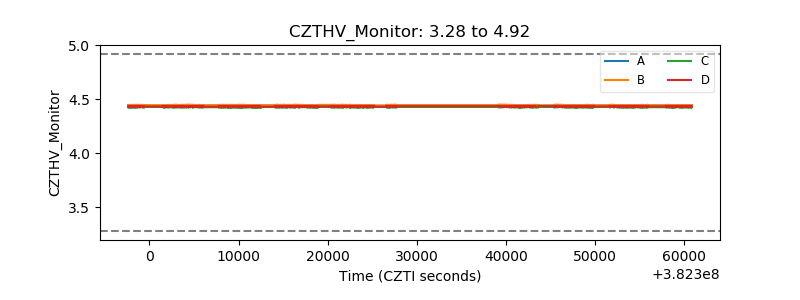 |
| D_VDD |  |
| Temperature 1 |  |
| Veto HV Monitor |  |
| Veto LLD |  |
| Alpha Counter |  |
| _CPM_Rate | 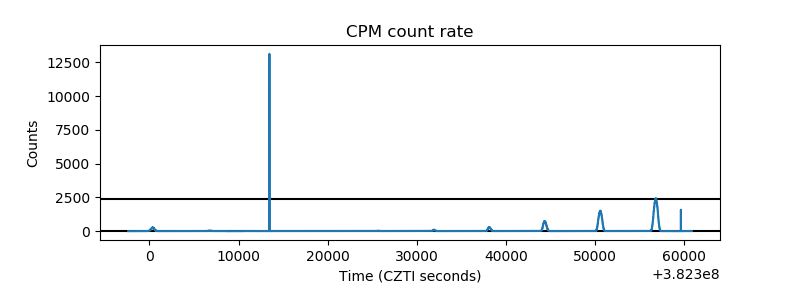 |
| CZT Counter |  |
| +2.5 Volts monitor | 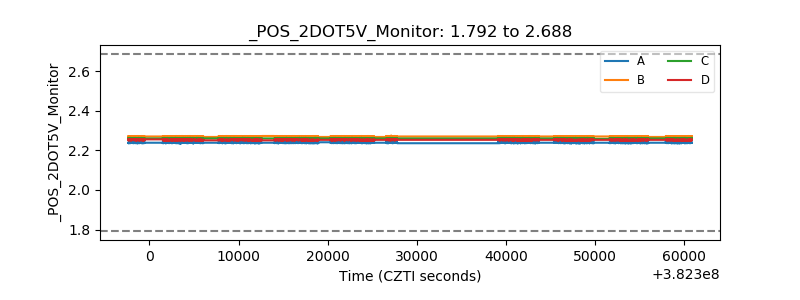 |
| +5 Volts monitor | 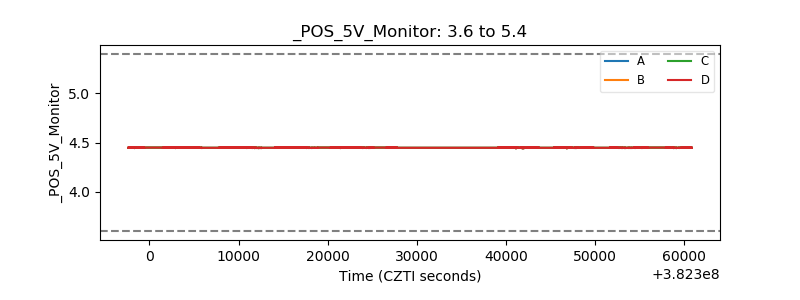 |
| _ROLL_ROT |  |
| _Roll_DEC | 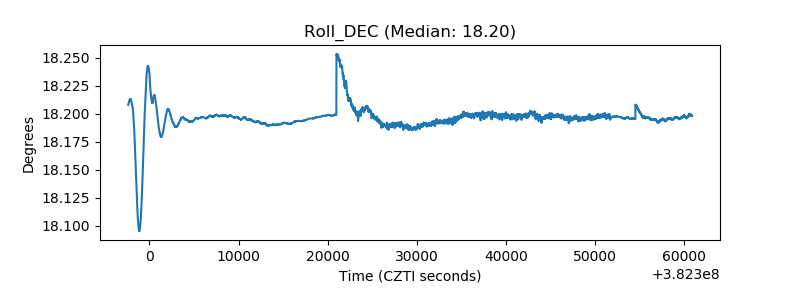 |
| _Roll_RA |  |
| Veto Counter |  |