| Param | Original file | Final file |
|---|---|---|
| Filename | modeM0/AS1A10_071T13_9000004922_34475cztM0_level2.evt | modeM0/AS1A10_071T13_9000004922_34475cztM0_level2_quad_clean.evt |
| Size (bytes) | 1,494,141,120 | 193,199,040 |
| Size | 1.4 GB | 184.2 MB |
| Events in quadrant A | 8,688,361 | 1,195,468 |
| Events in quadrant B | 9,309,962 | 1,216,717 |
| Events in quadrant C | 8,764,021 | 1,203,362 |
| Events in quadrant D | 17,364,128 | 1,085,488 |
| Mode M9 | |||
|---|---|---|---|
| Quadrant | BADHDUFLAG | Total packets | Discarded packets |
| A | 0 | 62 | 0 |
| B | 0 | 62 | 0 |
| C | 0 | 62 | 0 |
| D | 0 | 63 | 0 |
| Mode SS | |||
|---|---|---|---|
| Quadrant | BADHDUFLAG | Total packets | Discarded packets |
| A | 0 | 340 | 0 |
| B | 0 | 340 | 0 |
| C | 0 | 340 | 0 |
| D | 0 | 340 | 0 |
| Mode M0 | |||
|---|---|---|---|
| Quadrant | BADHDUFLAG | Total packets | Discarded packets |
| A | 0 | 36683 | 7 |
| B | 0 | 38379 | 5 |
| C | 0 | 36059 | 5 |
| D | 0 | 62977 | 5 |
| Quadrant | Total seconds | Saturated seconds | Saturation percentage |
|---|---|---|---|
| A | 16674 | 147 | 0.881612% |
| B | 16674 | 415 | 2.488905% |
| C | 16674 | 48 | 0.287873% |
| D | 16674 | 2353 | 14.111791% |
Noise dominated data is calculated using 1-second bins in cleaned event files. If a bin has >2000 counts, and if more than 50% of those come from <1% of pixels, then it is considered to be noise-dominated and hence unusable.
| Quadrant | # 1 sec bins | Bins with >0 counts | Bins with >2000 counts | High rate bins dominated by noise | Noise dominated (total time) | Noise dominated (detector-on time) | Marked lightcurve |
|---|---|---|---|---|---|---|---|
| A | 32237 | 16678 | 99 | 99 | 0.31% | 0.59% | 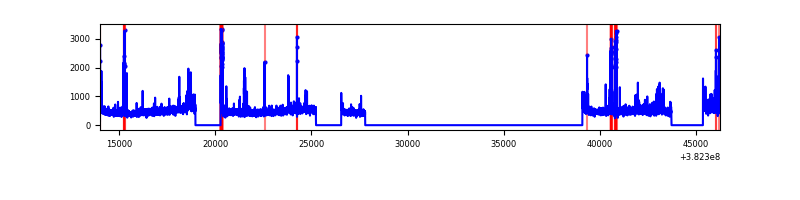 |
| B | 32237 | 16678 | 252 | 252 | 0.78% | 1.51% | 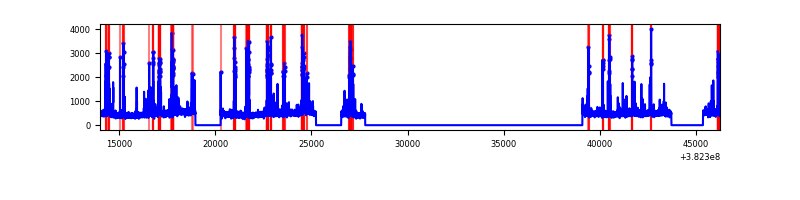 |
| C | 32237 | 16678 | 27 | 27 | 0.08% | 0.16% | 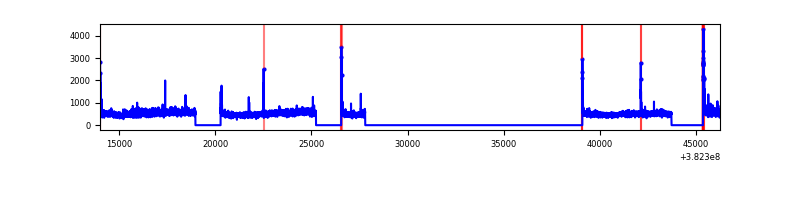 |
| D | 32237 | 16677 | 2135 | 2135 | 6.62% | 12.80% | 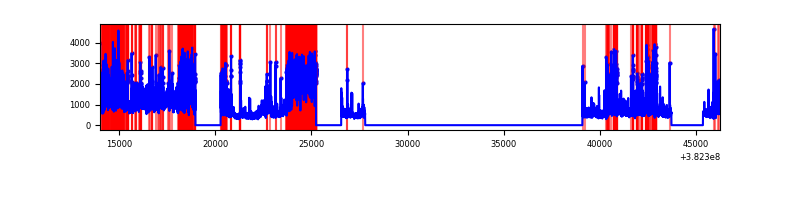 |
Top three noisy pixels from each quadrant. If the there are fewer than three noisy pixels in the level2.evt file, extra rows are filled as -1
| Pixel properties | Quadrant properties | ||||||
|---|---|---|---|---|---|---|---|
| Quadrant | DetID | PixID | Counts | Sigma | Mean | Median | Sigma |
| A | 15 | 169 | 679861 | 1725.64 | 1973 | 1935 | 392.9 |
| A | 9 | 143 | 120485 | 301.76 | 1973 | 1935 | 392.9 |
| A | 7 | 16 | 104254 | 260.45 | 1973 | 1935 | 392.9 |
| B | 5 | 172 | 1195021 | 3198.44 | 1944 | 1890 | 373.0 |
| B | 0 | 189 | 144779 | 383.04 | 1944 | 1890 | 373.0 |
| B | 5 | 255 | 108937 | 286.96 | 1944 | 1890 | 373.0 |
| C | 15 | 214 | 704122 | 1588.99 | 1912 | 1931 | 441.9 |
| C | 14 | 67 | 276081 | 620.37 | 1912 | 1931 | 441.9 |
| C | 0 | 10 | 149261 | 333.39 | 1912 | 1931 | 441.9 |
| D | 7 | 223 | 5200747 | 11953.29 | 1778 | 1728 | 434.9 |
| D | 8 | 195 | 1959596 | 4501.42 | 1778 | 1728 | 434.9 |
| D | 14 | 52 | 1144181 | 2626.66 | 1778 | 1728 | 434.9 |
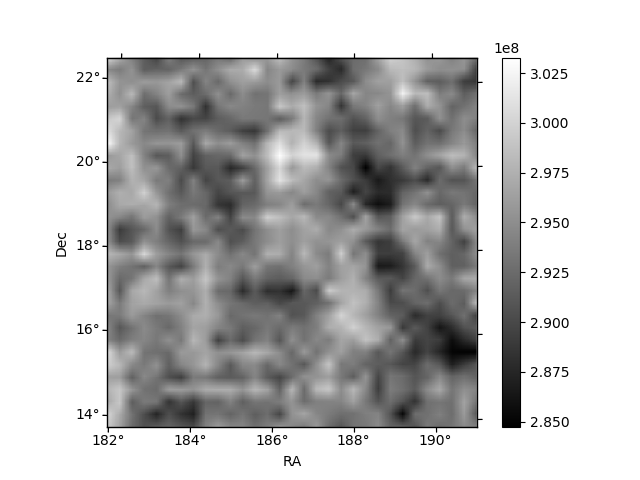
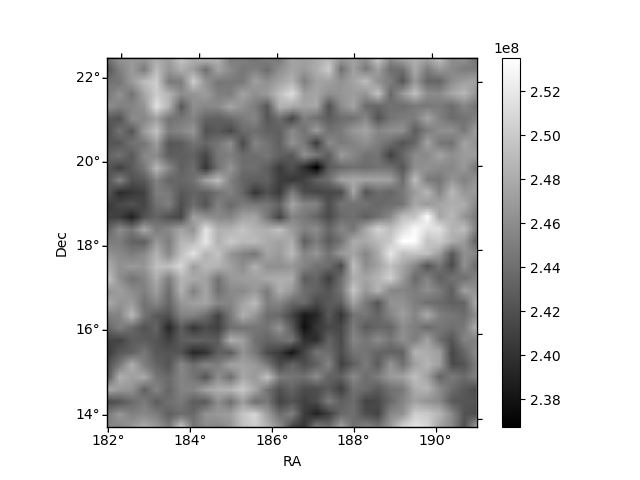
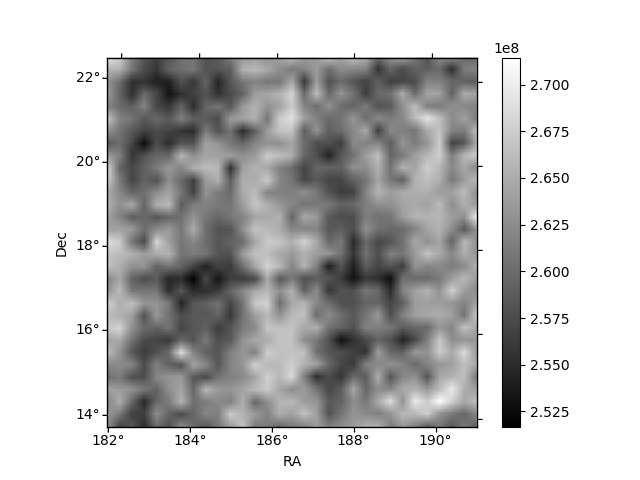
Histogram calculated using DETX and DETY for each event in the final _common_clean file
| Quadrant A | 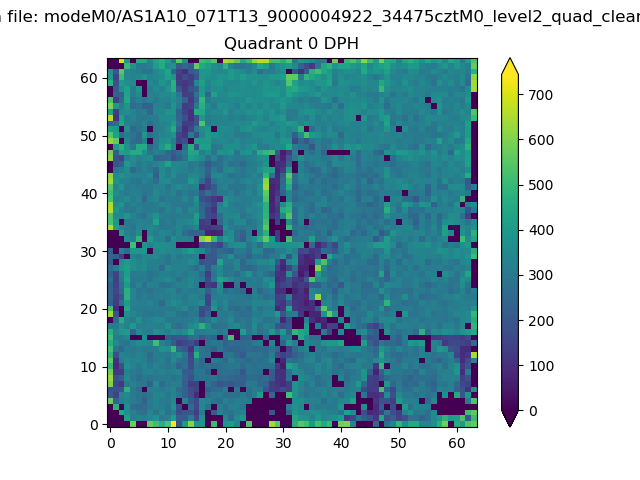 |
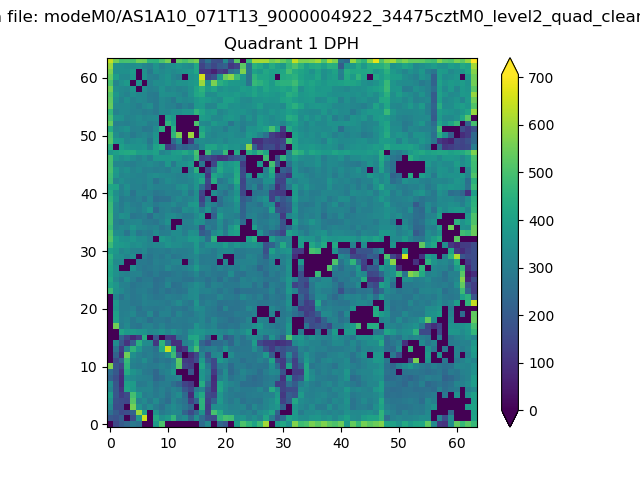 |
Quadrant B |
|---|---|---|---|
| Quadrant D | 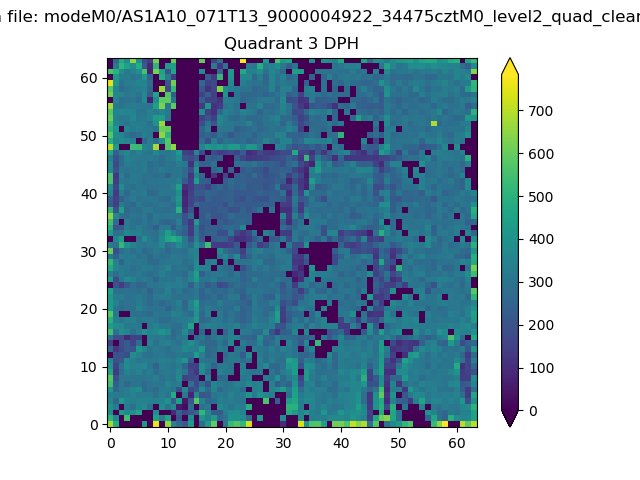 |
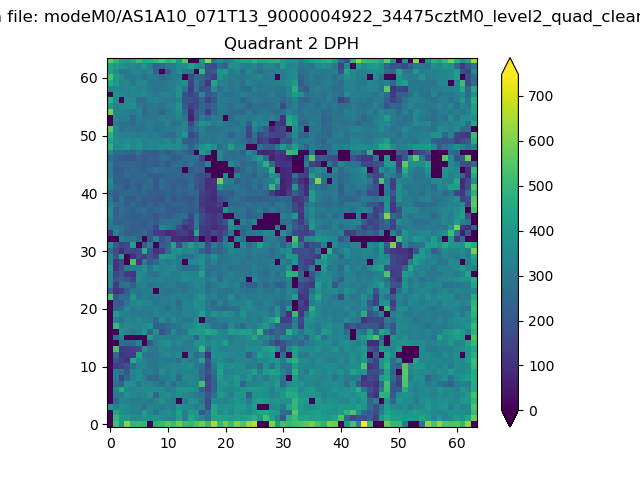 |
Quadrant C |
| Plot type | Count rate plots | Images |
|---|---|---|
| Comparison with Poisson distribution Blue bars denote a histogram of data divided into 1 sec bins. Red curve is a Poisson curve with rate = median count rate of data. |
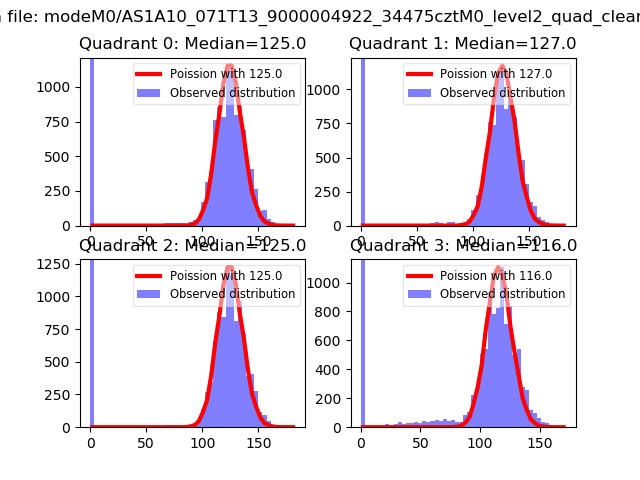 |
 |
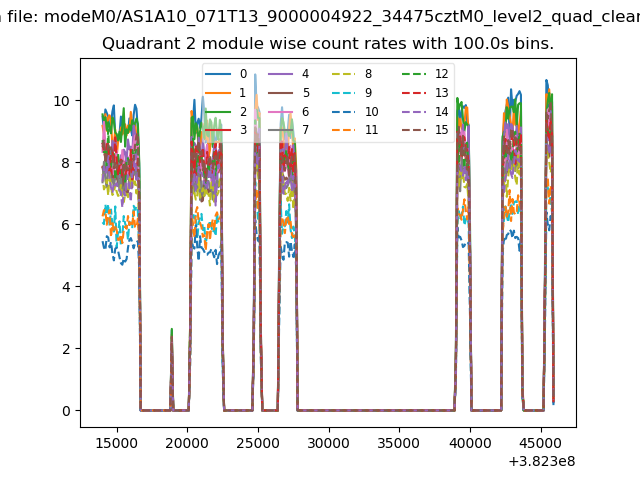
| Quadrant-wise count rates Data is divided into 100 sec bins |
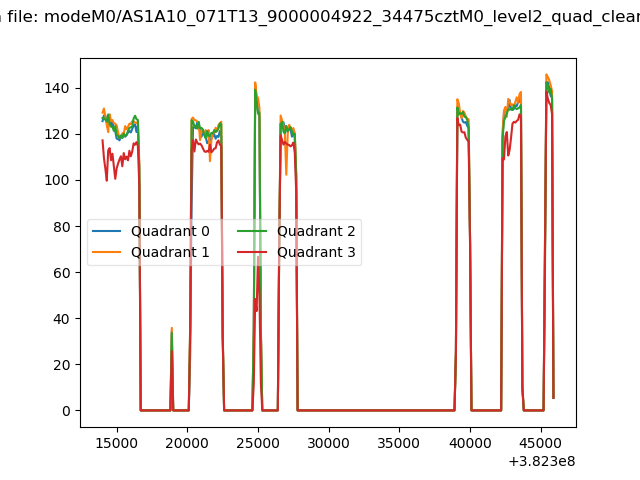 |
|
| Module-wise count rates for Quadrant A Data is divided into 100 sec bins |
 |
 |
| Module-wise count rates for Quadrant B Data is divided into 100 sec bins |
 |
 |
| Module-wise count rates for Quadrant C Data is divided into 100 sec bins |
 |
 |
| Module-wise count rates for Quadrant D Data is divided into 100 sec bins |
 |
 |
| Parameter | Plot |
|---|---|
| CZT HV Monitor | 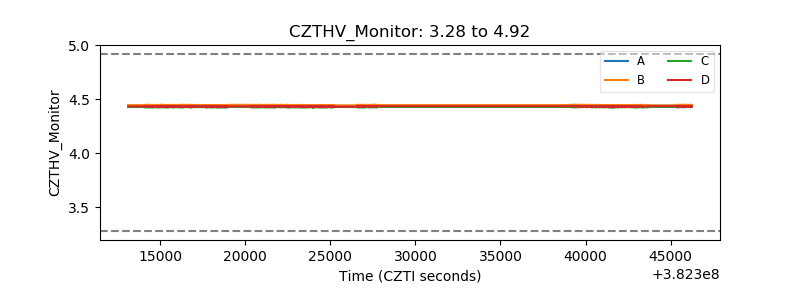 |
| D_VDD | 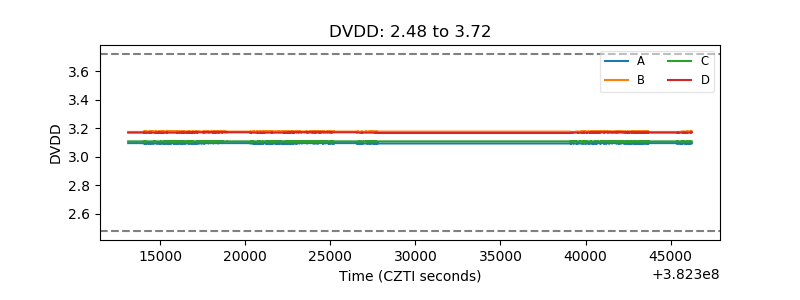 |
| Temperature 1 | 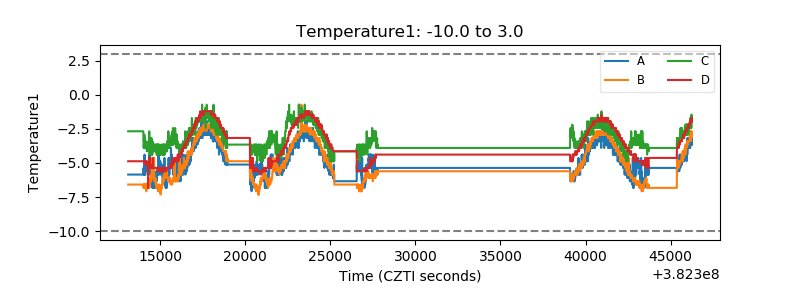 |
| Veto HV Monitor |  |
| Veto LLD |  |
| Alpha Counter | 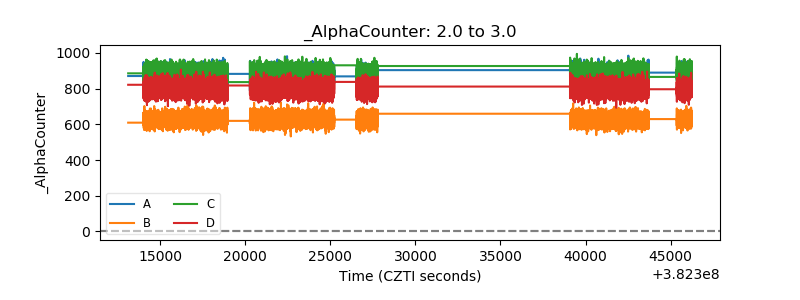 |
| _CPM_Rate | 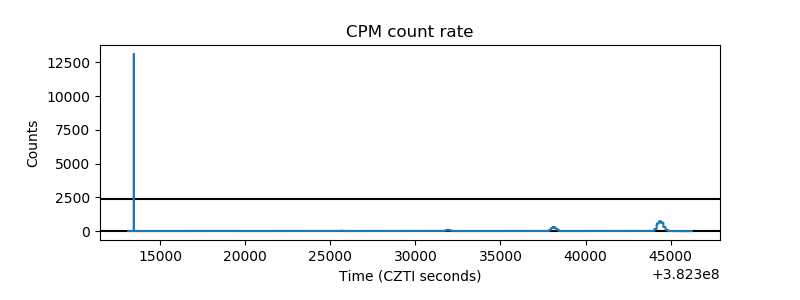 |
| CZT Counter | 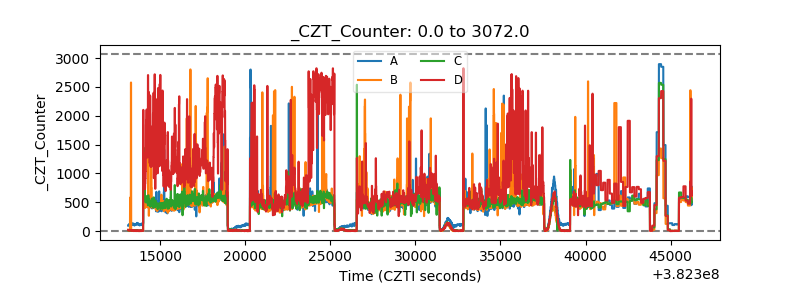 |
| +2.5 Volts monitor |  |
| +5 Volts monitor | 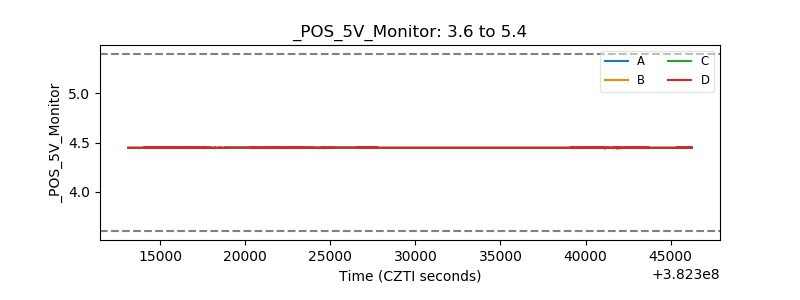 |
| _ROLL_ROT | 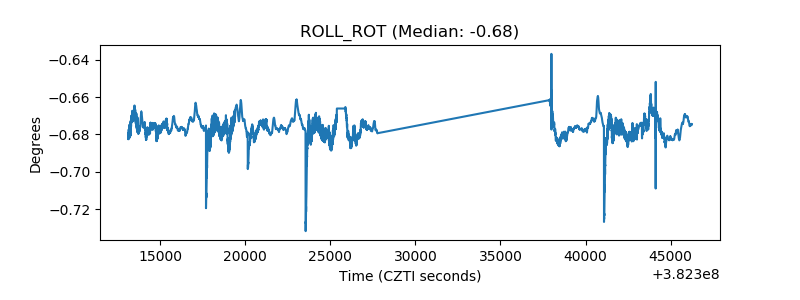 |
| _Roll_DEC | 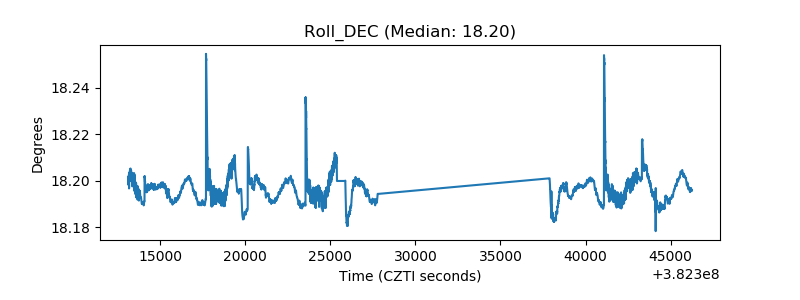 |
| _Roll_RA | 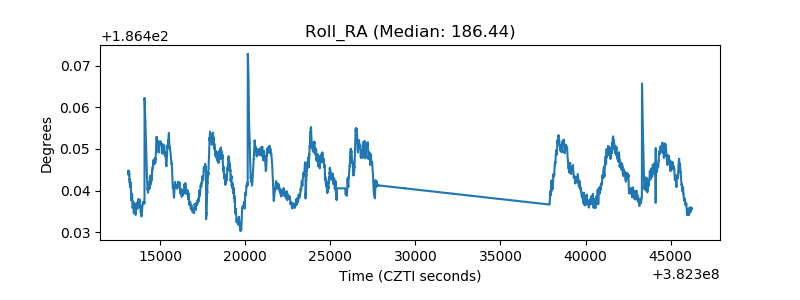 |
| Veto Counter | 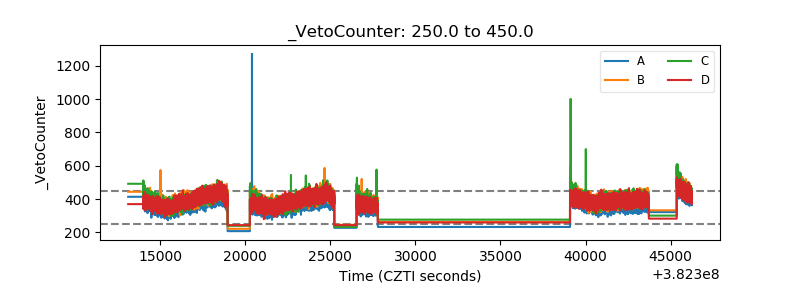 |