| Param | Original file | Final file |
|---|---|---|
| Filename | modeM0/AS1A05_118T04_9000004926cztM0_level2.fits | modeM0/AS1A05_118T04_9000004926cztM0_level2_quad_clean.evt |
| Size (bytes) | 128,496,960 | 101,381,760 |
| Size | 122.5 MB | 96.7 MB |
| Events in quadrant A | 804,416 | 567,767 |
| Events in quadrant B | 742,822 | 564,811 |
| Events in quadrant C | 778,262 | 541,092 |
| Events in quadrant D | 663,336 | 493,077 |
| Mode M9 | |||
|---|---|---|---|
| Quadrant | BADHDUFLAG | Total packets | Discarded packets |
| A | 0 | 31 | 0 |
| B | 0 | 31 | 0 |
| C | 0 | 31 | 0 |
| D | 0 | 31 | 0 |
| Mode SS | |||
|---|---|---|---|
| Quadrant | BADHDUFLAG | Total packets | Discarded packets |
| A | 0 | 266 | 0 |
| B | 0 | 266 | 0 |
| C | 0 | 266 | 0 |
| D | 0 | 266 | 0 |
| Mode M0 | |||
|---|---|---|---|
| Quadrant | BADHDUFLAG | Total packets | Discarded packets |
| A | 0 | 27364 | 0 |
| B | 0 | 33352 | 0 |
| C | 0 | 27966 | 0 |
| D | 0 | 40096 | 0 |
| Quadrant | Total seconds | Saturated seconds | Saturation percentage |
|---|---|---|---|
| A | 13062 | 26 | 0.199051% |
| B | 13062 | 738 | 5.649977% |
| C | 13062 | 50 | 0.382790% |
| D | 13062 | 558 | 4.271934% |
Noise dominated data is calculated using 1-second bins in cleaned event files. If a bin has >2000 counts, and if more than 50% of those come from <1% of pixels, then it is considered to be noise-dominated and hence unusable.
| Quadrant | # 1 sec bins | Bins with >0 counts | Bins with >2000 counts | High rate bins dominated by noise | Noise dominated (total time) | Noise dominated (detector-on time) | Marked lightcurve |
|---|---|---|---|---|---|---|---|
| A | 39680 | 13063 | 0 | 0 | 0.00% | 0.00% |  |
| B | 39680 | 13058 | 0 | 0 | 0.00% | 0.00% | 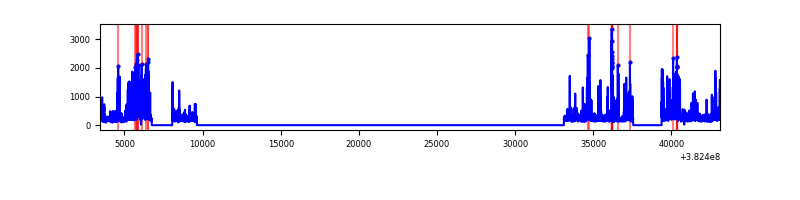 |
| C | 39680 | 13063 | 0 | 0 | 0.00% | 0.00% | 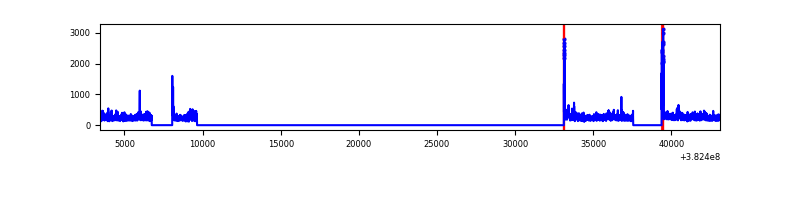 |
| D | 39680 | 13062 | 0 | 0 | 0.00% | 0.00% |  |
Top three noisy pixels from each quadrant. If the there are fewer than three noisy pixels in the level2.evt file, extra rows are filled as -1
| Pixel properties | Quadrant properties | ||||||
|---|---|---|---|---|---|---|---|
| Quadrant | DetID | PixID | Counts | Sigma | Mean | Median | Sigma |
| A | 0 | 29 | 670 | 8.87 | 210 | 198 | 53.2 |
| A | 9 | 19 | 634 | 8.19 | 210 | 198 | 53.2 |
| A | 7 | 110 | 623 | 7.99 | 210 | 198 | 53.2 |
| B | 2 | 9 | 688 | 12.31 | 196 | 188 | 40.6 |
| B | 3 | 80 | 533 | 8.49 | 196 | 188 | 40.6 |
| B | 2 | 8 | 531 | 8.44 | 196 | 188 | 40.6 |
| C | 1 | 81 | 629 | 8.11 | 205 | 194 | 53.7 |
| C | 1 | 80 | 613 | 7.81 | 205 | 194 | 53.7 |
| C | 3 | 202 | 592 | 7.42 | 205 | 194 | 53.7 |
| D | 10 | 189 | 512 | 6.59 | 190 | 174 | 51.3 |
| D | 4 | 160 | 491 | 6.18 | 190 | 174 | 51.3 |
| D | 6 | 38 | 484 | 6.05 | 190 | 174 | 51.3 |
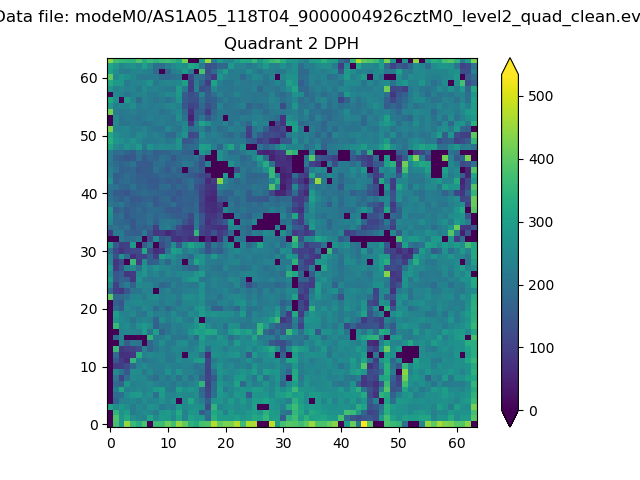
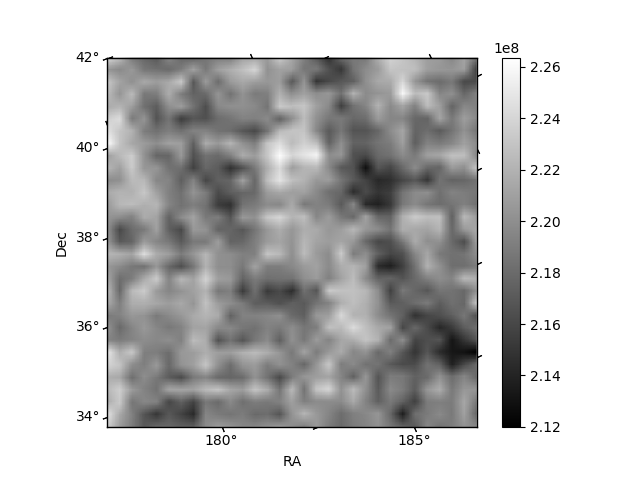
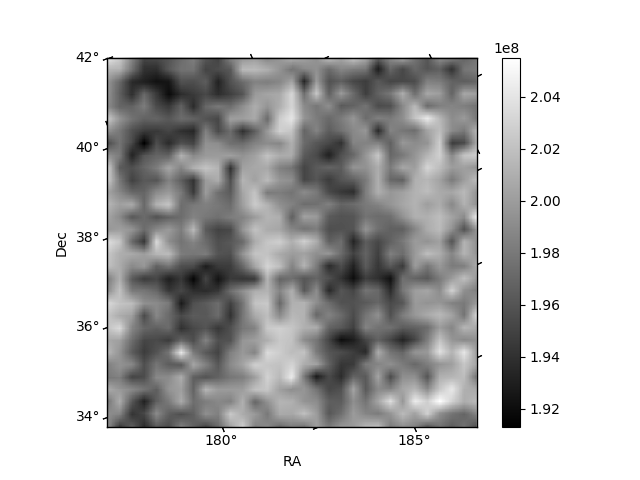
Histogram calculated using DETX and DETY for each event in the final _common_clean file
| Quadrant A | 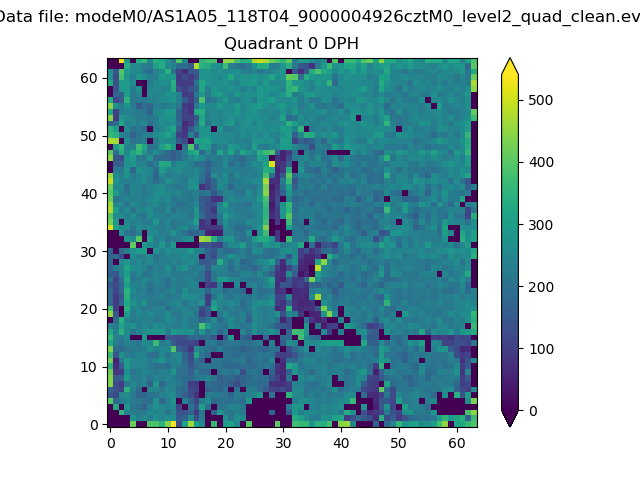 |
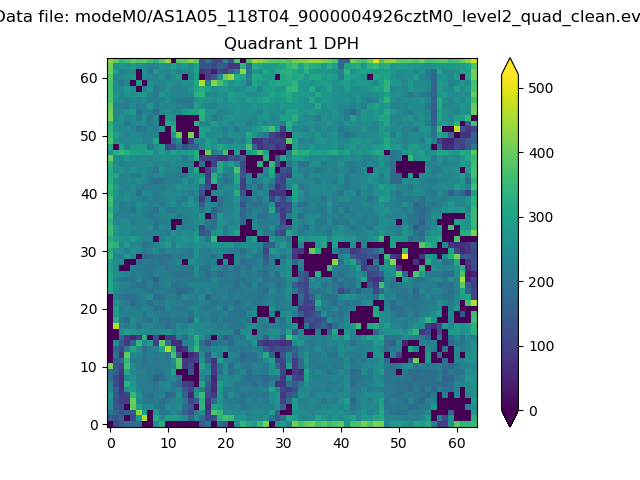 |
Quadrant B |
|---|---|---|---|
| Quadrant D | 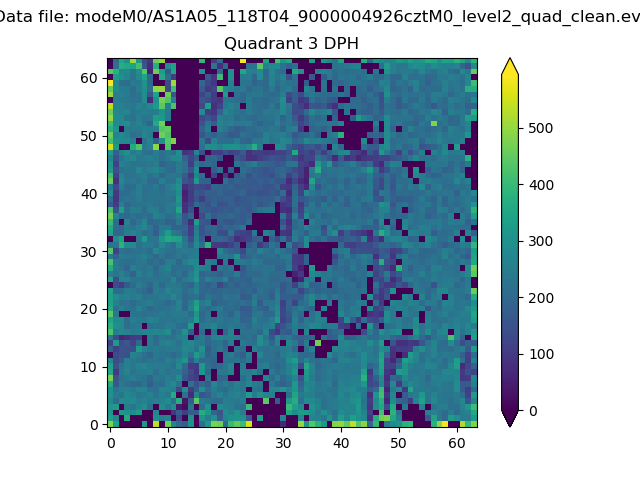 |
 |
Quadrant C |
| Plot type | Count rate plots | Images |
|---|---|---|
| Comparison with Poisson distribution Blue bars denote a histogram of data divided into 1 sec bins. Red curve is a Poisson curve with rate = median count rate of data. |
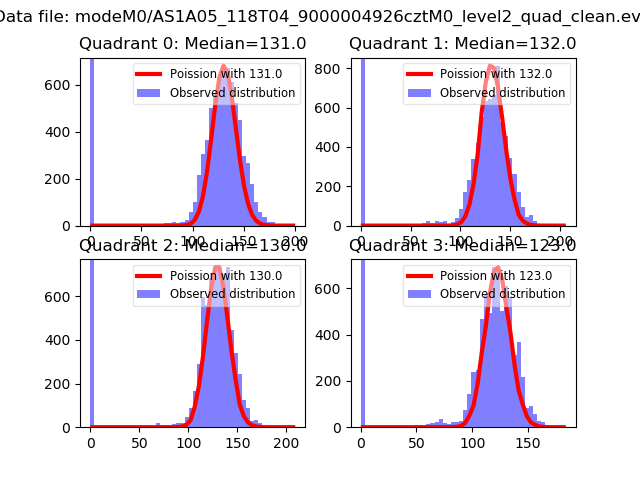 |
 |
| Quadrant-wise count rates Data is divided into 100 sec bins |
 |
|
| Module-wise count rates for Quadrant A Data is divided into 100 sec bins |
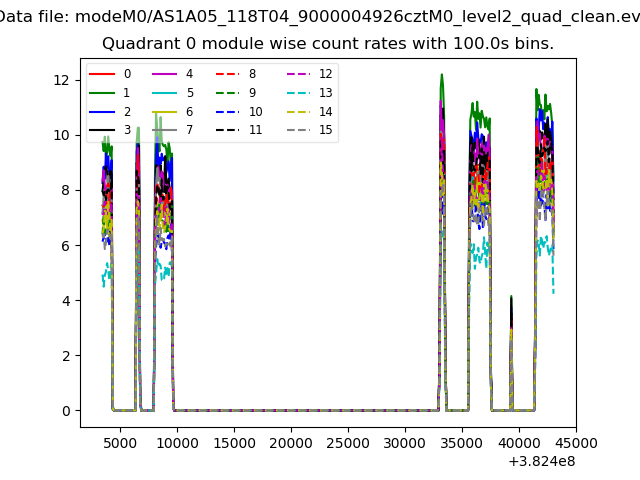 |
 |
| Module-wise count rates for Quadrant B Data is divided into 100 sec bins |
 |
 |
| Module-wise count rates for Quadrant C Data is divided into 100 sec bins |
 |
 |
| Module-wise count rates for Quadrant D Data is divided into 100 sec bins |
 |
 |
| Parameter | Plot |
|---|---|
| CZT HV Monitor | 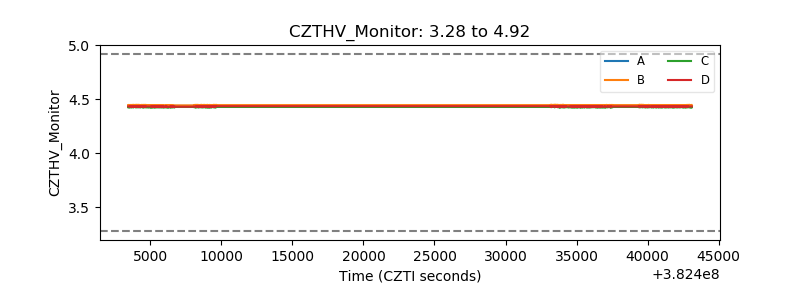 |
| D_VDD | 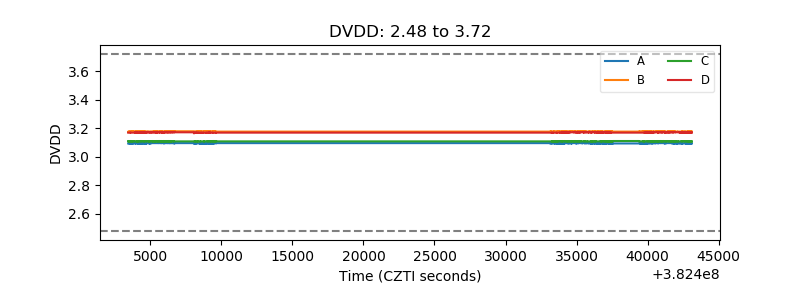 |
| Temperature 1 |  |
| Veto HV Monitor |  |
| Veto LLD |  |
| Alpha Counter |  |
| _CPM_Rate | 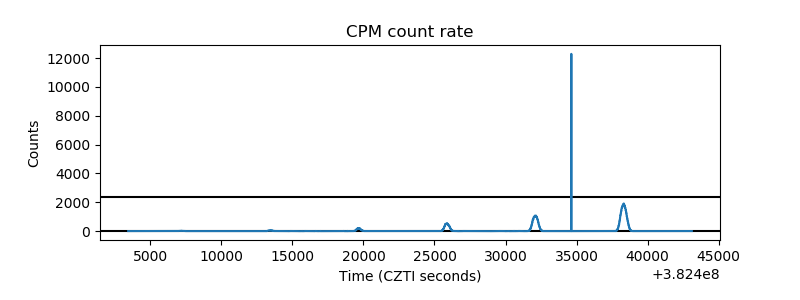 |
| CZT Counter |  |
| +2.5 Volts monitor | 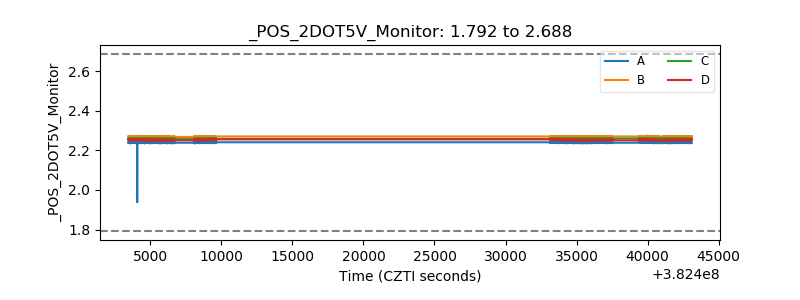 |
| +5 Volts monitor |  |
| _ROLL_ROT | 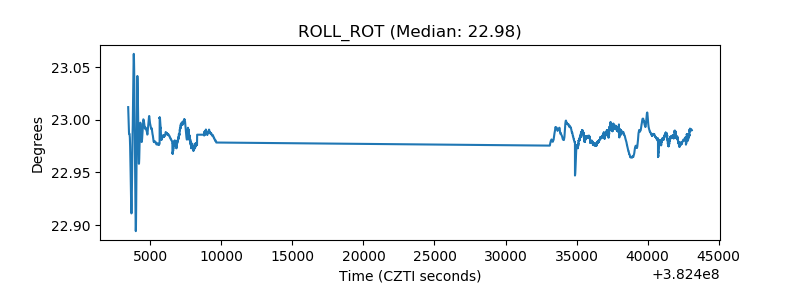 |
| _Roll_DEC |  |
| _Roll_RA |  |
| Veto Counter |  |