| Param | Original file | Final file |
|---|---|---|
| Filename | modeM0/AS1A10_071T14_9000004924cztM0_level2.fits | modeM0/AS1A10_071T14_9000004924cztM0_level2_quad_clean.evt |
| Size (bytes) | 285,036,480 | 286,372,800 |
| Size | 271.8 MB | 273.1 MB |
| Events in quadrant A | 1,751,530 | 1,723,506 |
| Events in quadrant B | 1,649,960 | 1,760,008 |
| Events in quadrant C | 1,766,670 | 1,701,445 |
| Events in quadrant D | 1,500,624 | 1,524,387 |
| Mode M0 | |||
|---|---|---|---|
| Quadrant | BADHDUFLAG | Total packets | Discarded packets |
| A | 0 | 71801 | 0 |
| B | 0 | 72368 | 0 |
| C | 0 | 62326 | 0 |
| D | 0 | 82467 | 0 |
| Mode SS | |||
|---|---|---|---|
| Quadrant | BADHDUFLAG | Total packets | Discarded packets |
| A | 0 | 584 | 0 |
| B | 0 | 584 | 0 |
| C | 0 | 584 | 0 |
| D | 0 | 584 | 0 |
| Mode M9 | |||
|---|---|---|---|
| Quadrant | BADHDUFLAG | Total packets | Discarded packets |
| A | 0 | 131 | 0 |
| B | 0 | 131 | 0 |
| C | 0 | 131 | 0 |
| D | 0 | 131 | 0 |
| Quadrant | Total seconds | Saturated seconds | Saturation percentage |
|---|---|---|---|
| A | 28552 | 1281 | 4.486551% |
| B | 28552 | 1637 | 5.733399% |
| C | 28552 | 148 | 0.518352% |
| D | 28552 | 1037 | 3.631970% |
Noise dominated data is calculated using 1-second bins in cleaned event files. If a bin has >2000 counts, and if more than 50% of those come from <1% of pixels, then it is considered to be noise-dominated and hence unusable.
| Quadrant | # 1 sec bins | Bins with >0 counts | Bins with >2000 counts | High rate bins dominated by noise | Noise dominated (total time) | Noise dominated (detector-on time) | Marked lightcurve |
|---|---|---|---|---|---|---|---|
| A | 41673 | 28549 | 0 | 0 | 0.00% | 0.00% |  |
| B | 41673 | 28541 | 0 | 0 | 0.00% | 0.00% |  |
| C | 41673 | 28552 | 0 | 0 | 0.00% | 0.00% |  |
| D | 41673 | 28550 | 0 | 0 | 0.00% | 0.00% | 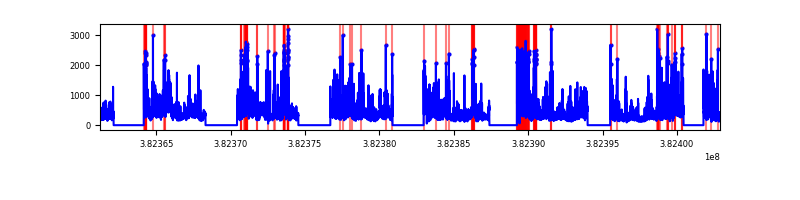 |
Top three noisy pixels from each quadrant. If the there are fewer than three noisy pixels in the level2.evt file, extra rows are filled as -1
| Pixel properties | Quadrant properties | ||||||
|---|---|---|---|---|---|---|---|
| Quadrant | DetID | PixID | Counts | Sigma | Mean | Median | Sigma |
| A | 0 | 29 | 1407 | 8.71 | 457 | 432 | 112.0 |
| A | 9 | 19 | 1365 | 8.33 | 457 | 432 | 112.0 |
| A | 7 | 110 | 1333 | 8.05 | 457 | 432 | 112.0 |
| B | 2 | 9 | 1446 | 11.75 | 438 | 419 | 87.4 |
| B | 3 | 80 | 1271 | 9.75 | 438 | 419 | 87.4 |
| B | 2 | 8 | 1175 | 8.65 | 438 | 419 | 87.4 |
| C | 1 | 81 | 1485 | 8.92 | 466 | 443 | 116.8 |
| C | 1 | 80 | 1455 | 8.67 | 466 | 443 | 116.8 |
| C | 3 | 203 | 1426 | 8.42 | 466 | 443 | 116.8 |
| D | 7 | 3 | 1128 | 6.41 | 430 | 396 | 114.2 |
| D | 10 | 113 | 1091 | 6.08 | 430 | 396 | 114.2 |
| D | 6 | 67 | 1089 | 6.07 | 430 | 396 | 114.2 |
Histogram calculated using DETX and DETY for each event in the final _common_clean file
| Quadrant A |  |
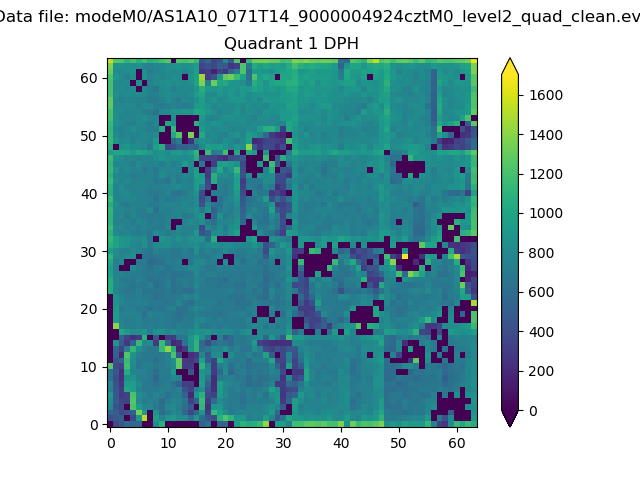 |
Quadrant B |
|---|---|---|---|
| Quadrant D |  |
 |
Quadrant C |
| Plot type | Count rate plots | Images |
|---|---|---|
| Comparison with Poisson distribution Blue bars denote a histogram of data divided into 1 sec bins. Red curve is a Poisson curve with rate = median count rate of data. |
 |
 |
| Quadrant-wise count rates Data is divided into 100 sec bins |
 |
|
| Module-wise count rates for Quadrant A Data is divided into 100 sec bins |
 |
 |
| Module-wise count rates for Quadrant B Data is divided into 100 sec bins |
 |
 |
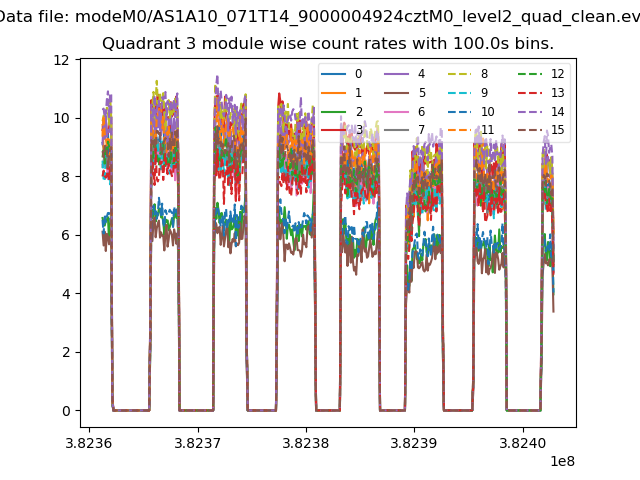
| Module-wise count rates for Quadrant C Data is divided into 100 sec bins |
 |
 |
| Module-wise count rates for Quadrant D Data is divided into 100 sec bins |
 |
 |
| Parameter | Plot |
|---|---|
| CZT HV Monitor |  |
| D_VDD |  |
| Temperature 1 |  |
| Veto HV Monitor |  |
| Veto LLD | 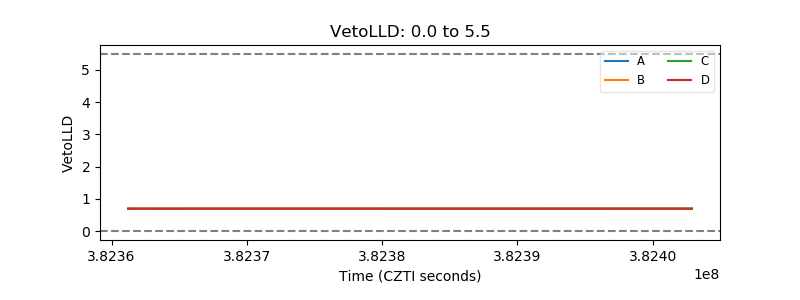 |
| Alpha Counter |  |
| _CPM_Rate |  |
| CZT Counter |  |
| +2.5 Volts monitor |  |
| +5 Volts monitor |  |
| _ROLL_ROT | 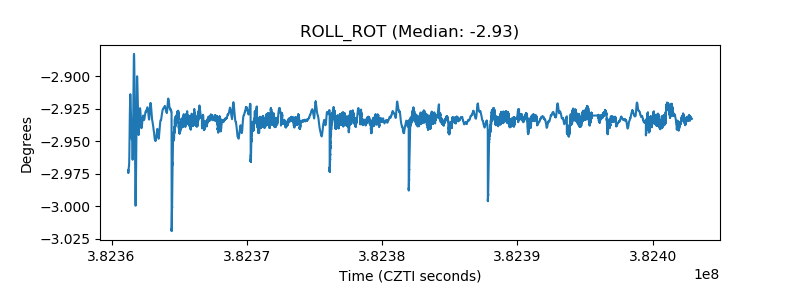 |
| _Roll_DEC |  |
| _Roll_RA |  |
| Veto Counter |  |