| Param | Original file | Final file |
|---|---|---|
| Filename | modeM0/AS1A10_071T14_9000004924_34482cztM0_level2.evt | modeM0/AS1A10_071T14_9000004924_34482cztM0_level2_quad_clean.evt |
| Size (bytes) | 419,618,880 | 85,878,720 |
| Size | 400.2 MB | 81.9 MB |
| Events in quadrant A | 2,815,161 | 561,174 |
| Events in quadrant B | 3,096,979 | 573,988 |
| Events in quadrant C | 2,780,384 | 573,220 |
| Events in quadrant D | 3,675,546 | 541,223 |
| Mode M0 | |||
|---|---|---|---|
| Quadrant | BADHDUFLAG | Total packets | Discarded packets |
| A | 0 | 11529 | 4 |
| B | 0 | 12203 | 2 |
| C | 0 | 11118 | 2 |
| D | 0 | 14517 | 2 |
| Mode SS | |||
|---|---|---|---|
| Quadrant | BADHDUFLAG | Total packets | Discarded packets |
| A | 0 | 102 | 0 |
| B | 0 | 102 | 0 |
| C | 0 | 102 | 0 |
| D | 0 | 102 | 0 |
| Mode M9 | |||
|---|---|---|---|
| Quadrant | BADHDUFLAG | Total packets | Discarded packets |
| A | 0 | 27 | 0 |
| B | 0 | 27 | 0 |
| C | 0 | 27 | 0 |
| D | 0 | 27 | 0 |
| Quadrant | Total seconds | Saturated seconds | Saturation percentage |
|---|---|---|---|
| A | 5008 | 91 | 1.817093% |
| B | 5008 | 272 | 5.431310% |
| C | 5008 | 46 | 0.918530% |
| D | 5008 | 108 | 2.156550% |
Noise dominated data is calculated using 1-second bins in cleaned event files. If a bin has >2000 counts, and if more than 50% of those come from <1% of pixels, then it is considered to be noise-dominated and hence unusable.
| Quadrant | # 1 sec bins | Bins with >0 counts | Bins with >2000 counts | High rate bins dominated by noise | Noise dominated (total time) | Noise dominated (detector-on time) | Marked lightcurve |
|---|---|---|---|---|---|---|---|
| A | 7102 | 5010 | 54 | 54 | 0.76% | 1.08% | 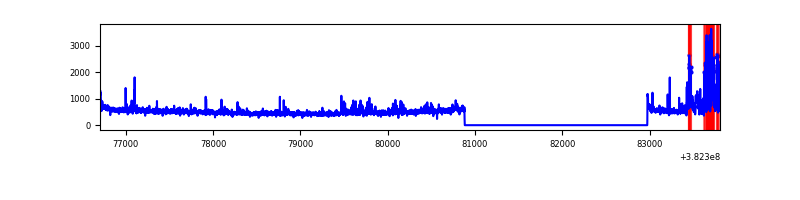 |
| B | 7102 | 5010 | 220 | 220 | 3.10% | 4.39% |  |
| C | 7102 | 5010 | 34 | 34 | 0.48% | 0.68% | 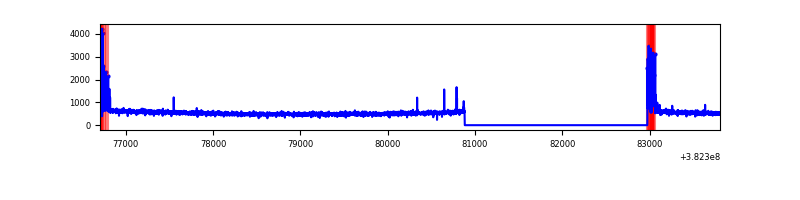 |
| D | 7102 | 5010 | 72 | 72 | 1.01% | 1.44% | 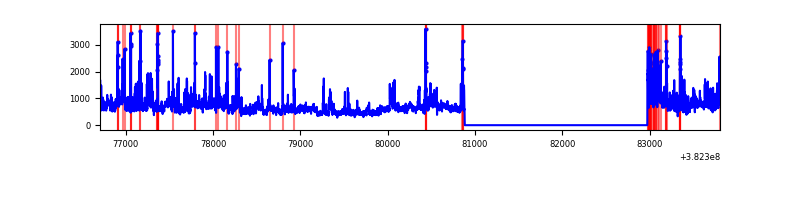 |
Top three noisy pixels from each quadrant. If the there are fewer than three noisy pixels in the level2.evt file, extra rows are filled as -1
| Pixel properties | Quadrant properties | ||||||
|---|---|---|---|---|---|---|---|
| Quadrant | DetID | PixID | Counts | Sigma | Mean | Median | Sigma |
| A | 15 | 169 | 369995 | 2961.91 | 615 | 604 | 124.7 |
| A | 10 | 83 | 38655 | 305.11 | 615 | 604 | 124.7 |
| A | 9 | 143 | 14762 | 113.52 | 615 | 604 | 124.7 |
| B | 5 | 172 | 649942 | 5648.39 | 599 | 585 | 115.0 |
| B | 4 | 232 | 24948 | 211.92 | 599 | 585 | 115.0 |
| B | 0 | 189 | 22827 | 193.47 | 599 | 585 | 115.0 |
| C | 15 | 214 | 212160 | 1512.45 | 608 | 615 | 139.9 |
| C | 0 | 10 | 153837 | 1095.47 | 608 | 615 | 139.9 |
| C | 14 | 67 | 27938 | 195.35 | 608 | 615 | 139.9 |
| D | 8 | 195 | 627276 | 4239.75 | 603 | 587 | 147.8 |
| D | 2 | 250 | 137008 | 922.93 | 603 | 587 | 147.8 |
| D | 10 | 118 | 133098 | 896.48 | 603 | 587 | 147.8 |
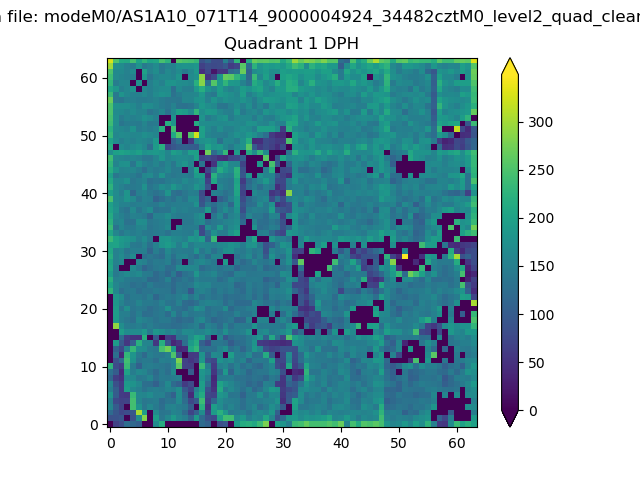
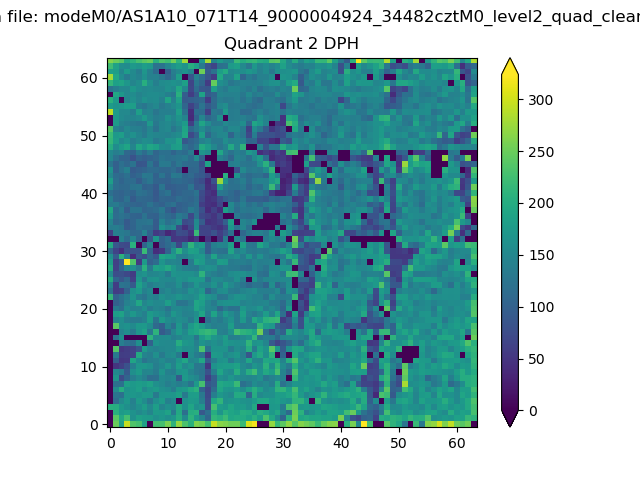
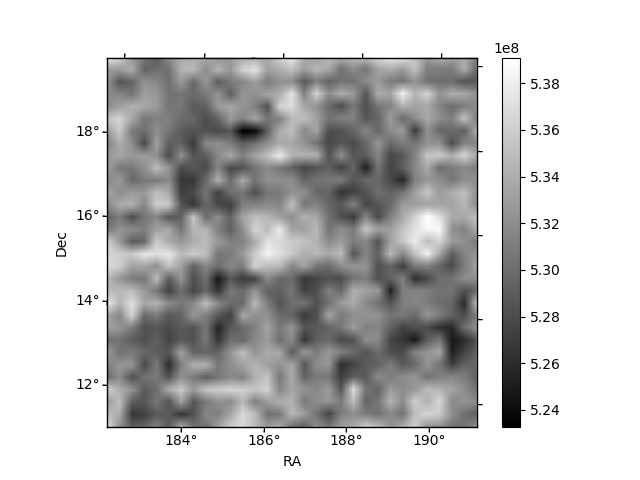
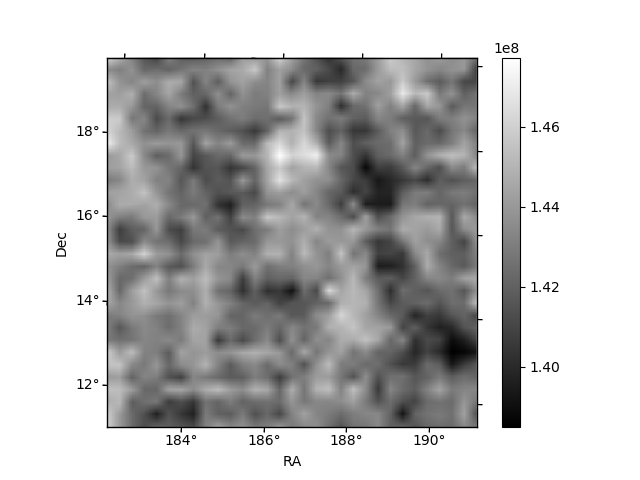
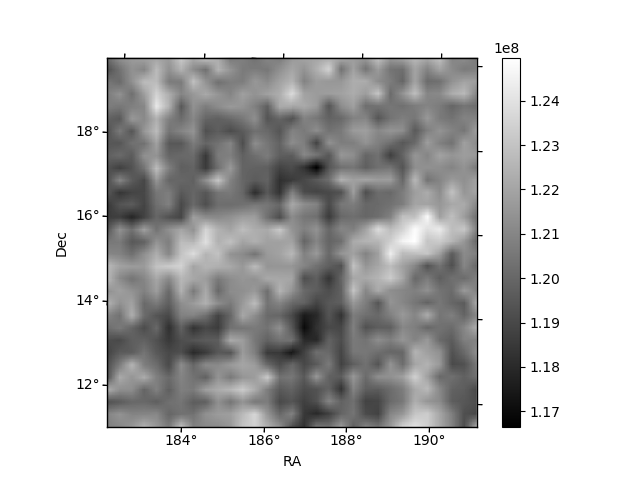
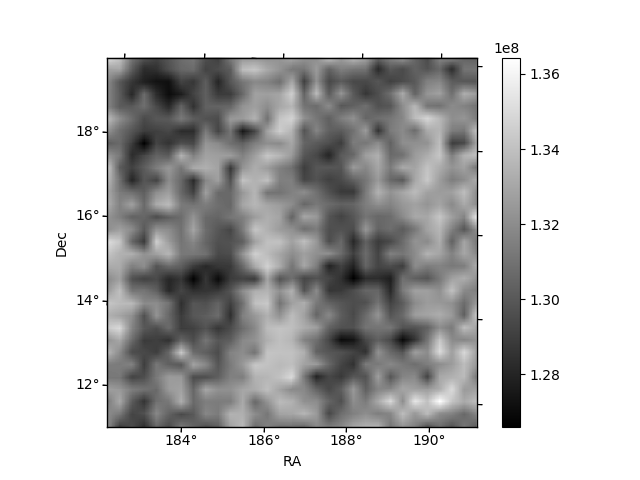
Histogram calculated using DETX and DETY for each event in the final _common_clean file
| Quadrant A | 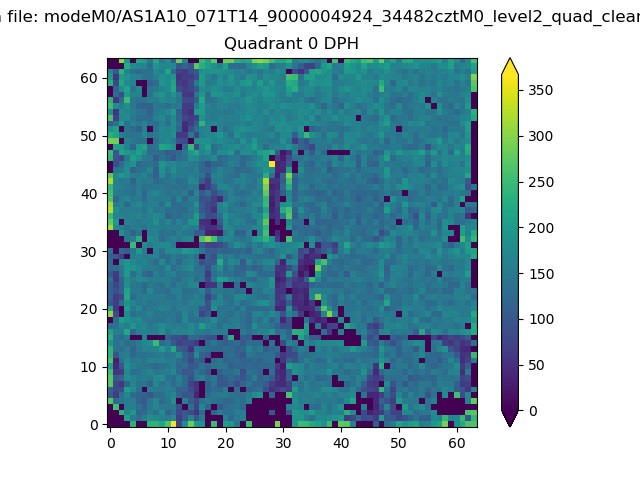 |
 |
Quadrant B |
|---|---|---|---|
| Quadrant D | 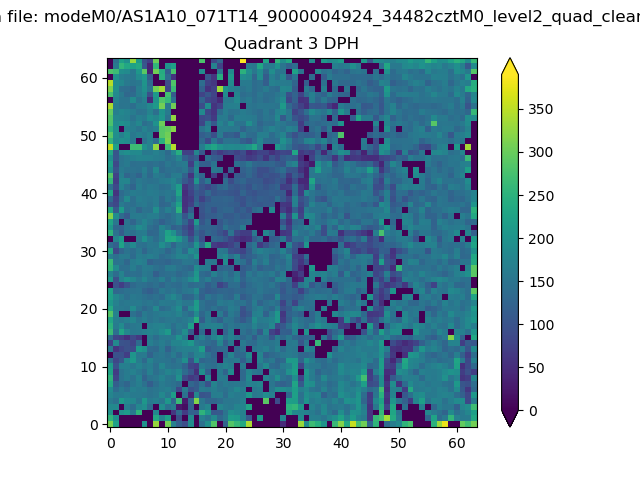 |
 |
Quadrant C |
| Plot type | Count rate plots | Images |
|---|---|---|
| Comparison with Poisson distribution Blue bars denote a histogram of data divided into 1 sec bins. Red curve is a Poisson curve with rate = median count rate of data. |
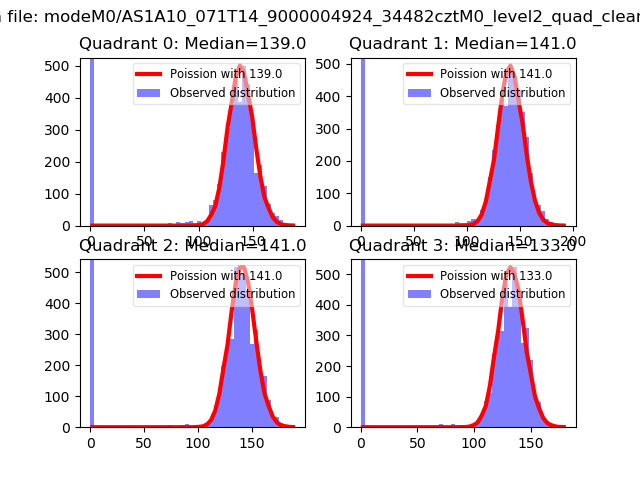 |
 |
| Quadrant-wise count rates Data is divided into 100 sec bins |
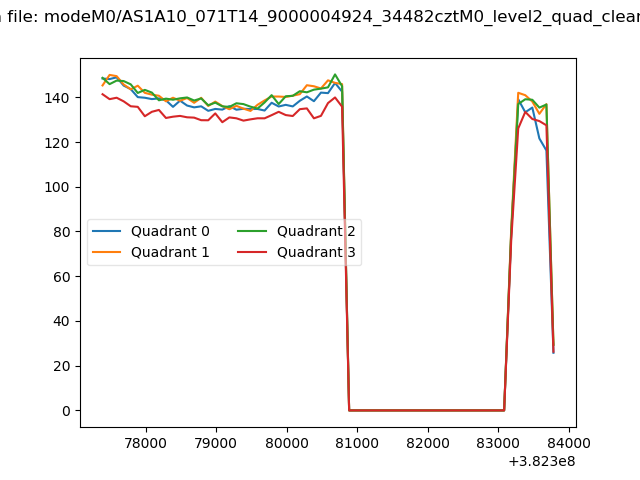 |
|
| Module-wise count rates for Quadrant A Data is divided into 100 sec bins |
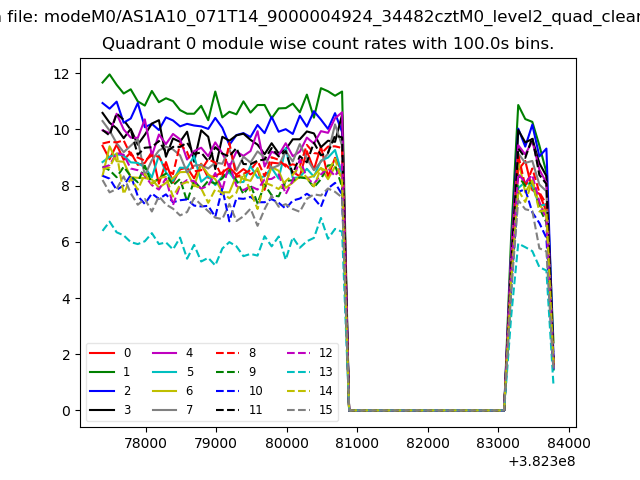 |
 |
| Module-wise count rates for Quadrant B Data is divided into 100 sec bins |
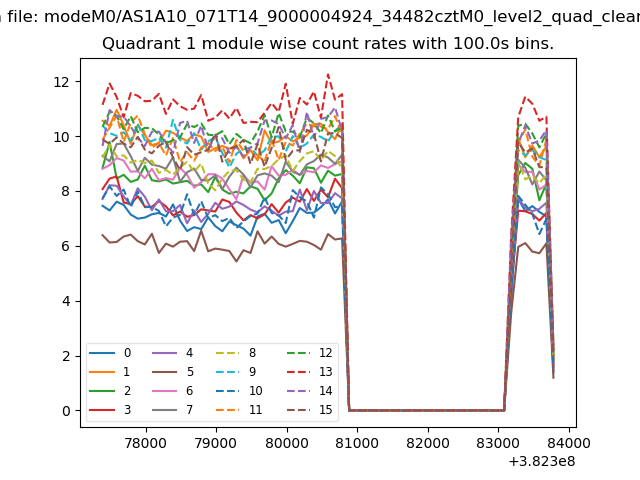 |
 |
| Module-wise count rates for Quadrant C Data is divided into 100 sec bins |
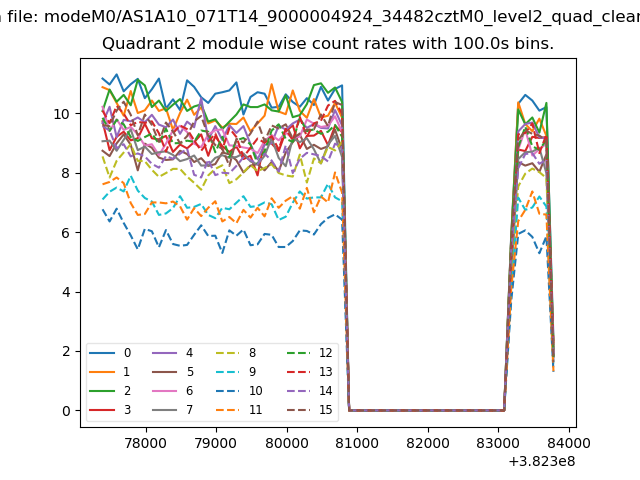 |
 |
| Module-wise count rates for Quadrant D Data is divided into 100 sec bins |
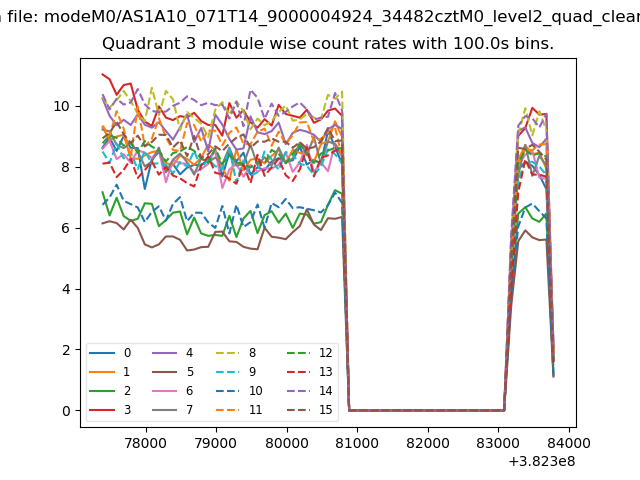 |
 |
| Parameter | Plot |
|---|---|
| CZT HV Monitor | 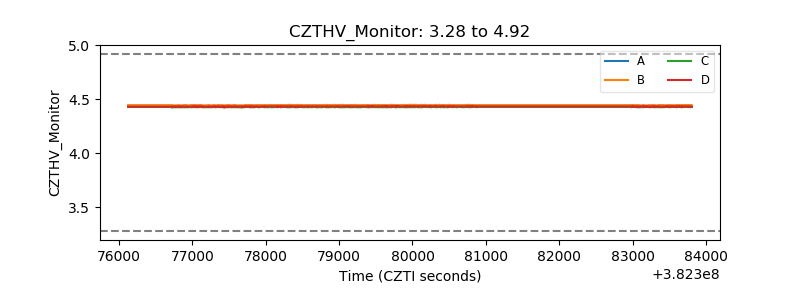 |
| D_VDD |  |
| Temperature 1 | 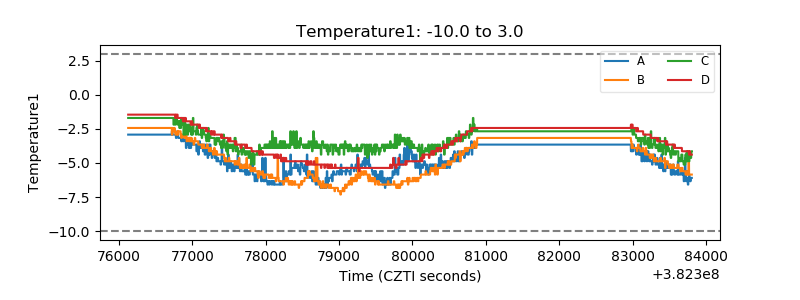 |
| Veto HV Monitor | 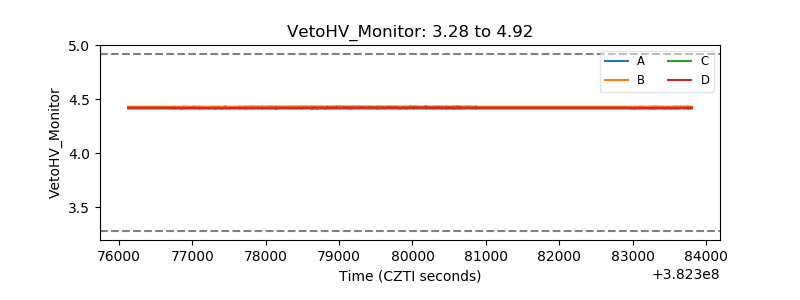 |
| Veto LLD | 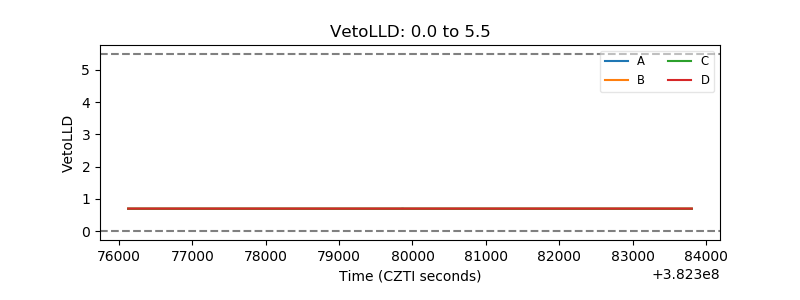 |
| Alpha Counter | 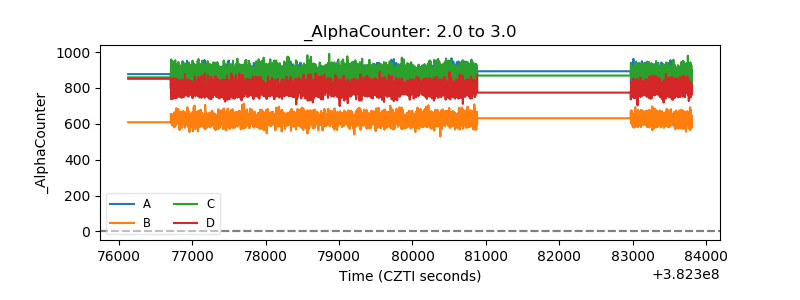 |
| _CPM_Rate | 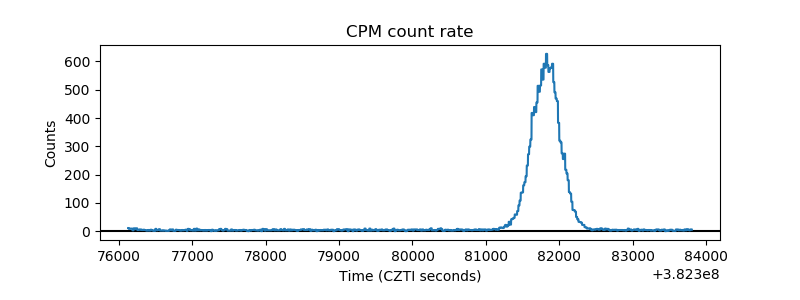 |
| CZT Counter | 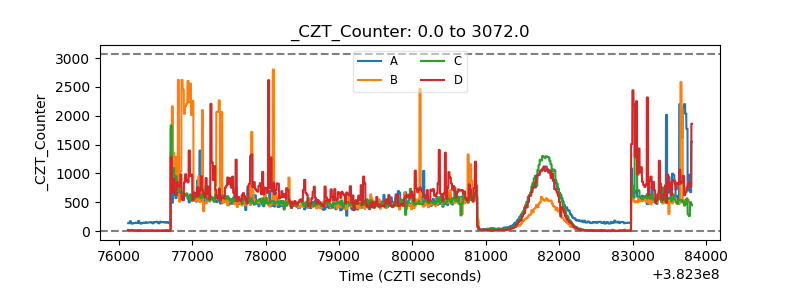 |
| +2.5 Volts monitor |  |
| +5 Volts monitor |  |
| _ROLL_ROT | 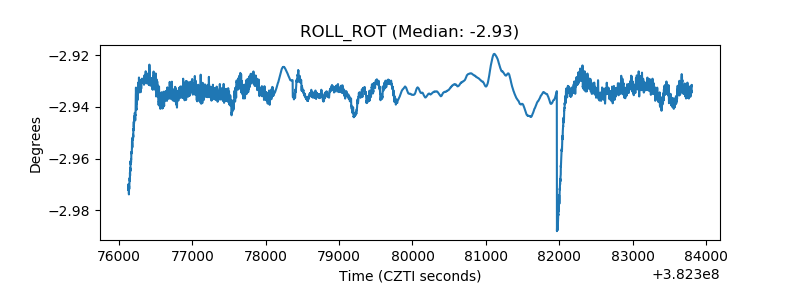 |
| _Roll_DEC | 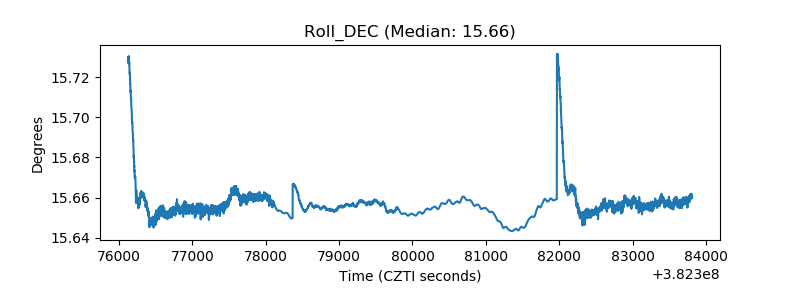 |
| _Roll_RA | 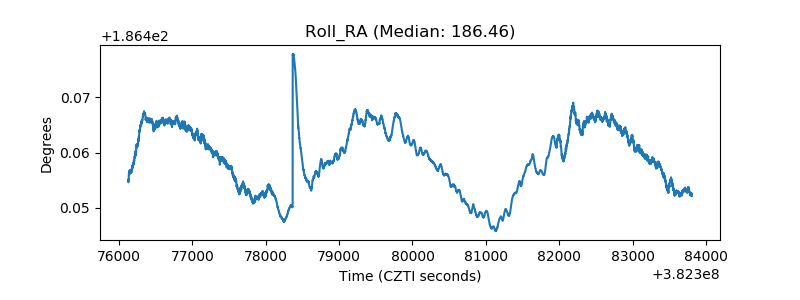 |
| Veto Counter | 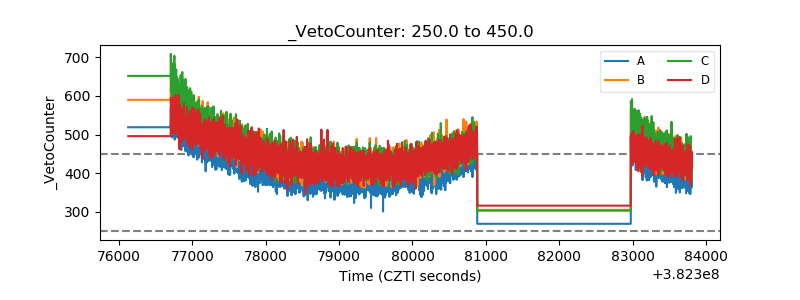 |