| Param | Original file | Final file |
|---|---|---|
| Filename | modeM0/AS1A05_156T01_9000004928cztM0_level2.fits | modeM0/AS1A05_156T01_9000004928cztM0_level2_quad_clean.evt |
| Size (bytes) | 771,768,000 | 764,988,480 |
| Size | 736.0 MB | 729.5 MB |
| Events in quadrant A | 4,877,644 | 4,732,685 |
| Events in quadrant B | 4,463,338 | 4,636,268 |
| Events in quadrant C | 4,729,164 | 4,542,910 |
| Events in quadrant D | 3,921,528 | 3,877,231 |
| Mode SS | |||
|---|---|---|---|
| Quadrant | BADHDUFLAG | Total packets | Discarded packets |
| A | 0 | 1602 | 0 |
| B | 0 | 1602 | 0 |
| C | 0 | 1602 | 0 |
| D | 0 | 1602 | 0 |
| Mode M0 | |||
|---|---|---|---|
| Quadrant | BADHDUFLAG | Total packets | Discarded packets |
| A | 0 | 164765 | 0 |
| B | 0 | 206704 | 0 |
| C | 0 | 170320 | 0 |
| D | 0 | 270248 | 0 |
| Mode M9 | |||
|---|---|---|---|
| Quadrant | BADHDUFLAG | Total packets | Discarded packets |
| A | 0 | 326 | 0 |
| B | 0 | 326 | 0 |
| C | 0 | 326 | 0 |
| D | 0 | 326 | 0 |
| Quadrant | Total seconds | Saturated seconds | Saturation percentage |
|---|---|---|---|
| A | 78451 | 203 | 0.258760% |
| B | 78454 | 4430 | 5.646621% |
| C | 78455 | 367 | 0.467784% |
| D | 78455 | 6310 | 8.042827% |
Noise dominated data is calculated using 1-second bins in cleaned event files. If a bin has >2000 counts, and if more than 50% of those come from <1% of pixels, then it is considered to be noise-dominated and hence unusable.
| Quadrant | # 1 sec bins | Bins with >0 counts | Bins with >2000 counts | High rate bins dominated by noise | Noise dominated (total time) | Noise dominated (detector-on time) | Marked lightcurve |
|---|---|---|---|---|---|---|---|
| A | 110880 | 78456 | 0 | 0 | 0.00% | 0.00% |  |
| B | 110880 | 78423 | 0 | 0 | 0.00% | 0.00% | 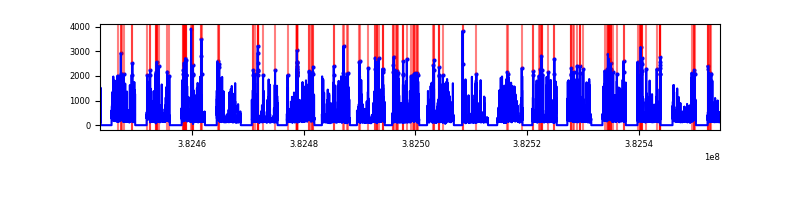 |
| C | 110880 | 78449 | 0 | 0 | 0.00% | 0.00% |  |
| D | 110880 | 78337 | 0 | 0 | 0.00% | 0.00% |  |
Top three noisy pixels from each quadrant. If the there are fewer than three noisy pixels in the level2.evt file, extra rows are filled as -1
| Pixel properties | Quadrant properties | ||||||
|---|---|---|---|---|---|---|---|
| Quadrant | DetID | PixID | Counts | Sigma | Mean | Median | Sigma |
| A | 9 | 19 | 3987 | 9.02 | 1272 | 1201 | 308.8 |
| A | 0 | 29 | 3946 | 8.89 | 1272 | 1201 | 308.8 |
| A | 7 | 110 | 3869 | 8.64 | 1272 | 1201 | 308.8 |
| B | 2 | 9 | 3997 | 12.53 | 1185 | 1138 | 228.2 |
| B | 3 | 80 | 3555 | 10.59 | 1185 | 1138 | 228.2 |
| B | 2 | 8 | 3234 | 9.18 | 1185 | 1138 | 228.2 |
| C | 1 | 80 | 3809 | 8.33 | 1251 | 1181 | 315.6 |
| C | 1 | 81 | 3802 | 8.31 | 1251 | 1181 | 315.6 |
| C | 3 | 203 | 3701 | 7.99 | 1251 | 1181 | 315.6 |
| D | 7 | 3 | 2950 | 6.44 | 1127 | 1034 | 297.5 |
| D | 4 | 160 | 2854 | 6.12 | 1127 | 1034 | 297.5 |
| D | 10 | 189 | 2828 | 6.03 | 1127 | 1034 | 297.5 |
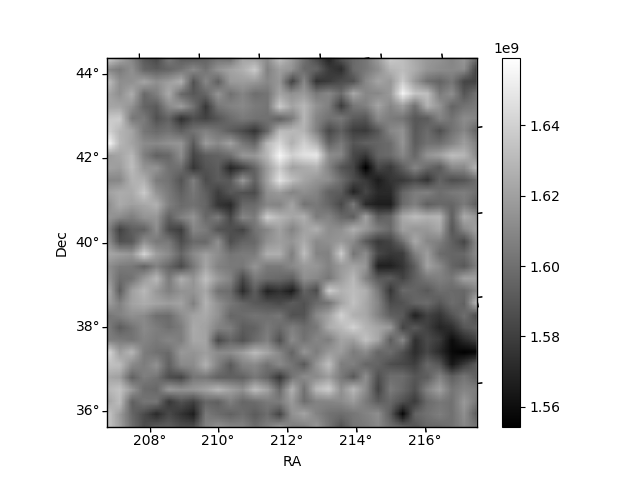
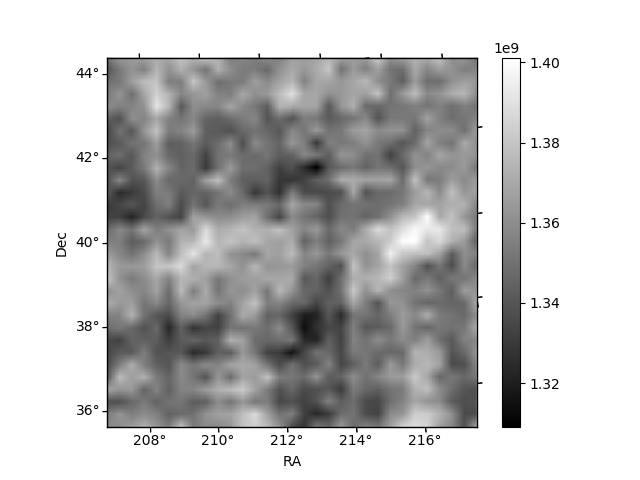
Histogram calculated using DETX and DETY for each event in the final _common_clean file
| Quadrant A |  |
 |
Quadrant B |
|---|---|---|---|
| Quadrant D | 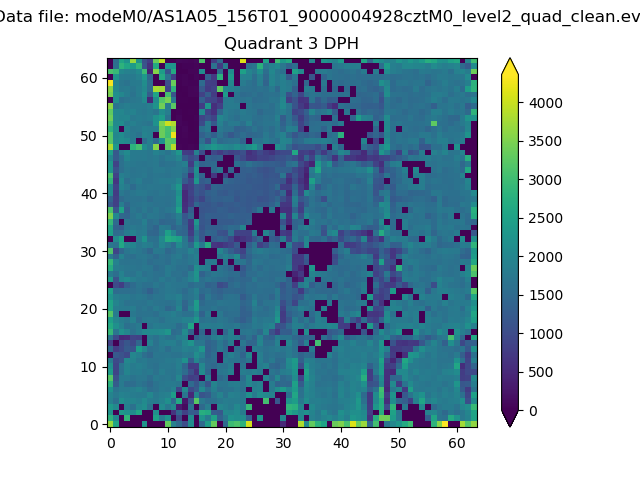 |
 |
Quadrant C |
| Plot type | Count rate plots | Images |
|---|---|---|
| Comparison with Poisson distribution Blue bars denote a histogram of data divided into 1 sec bins. Red curve is a Poisson curve with rate = median count rate of data. |
 |
 |
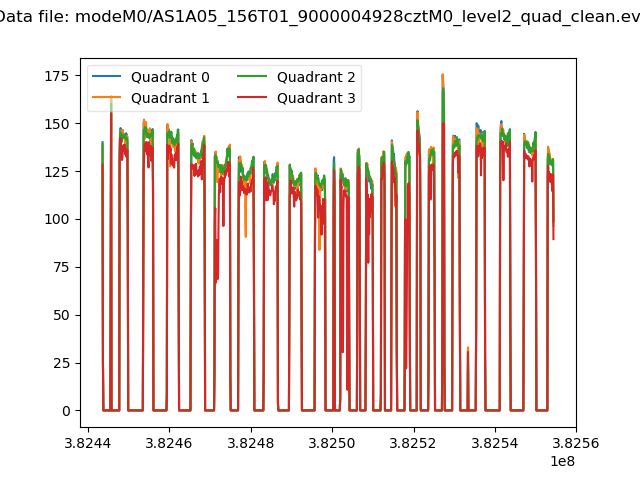
| Quadrant-wise count rates Data is divided into 100 sec bins |
 |
|
| Module-wise count rates for Quadrant A Data is divided into 100 sec bins |
 |
 |
| Module-wise count rates for Quadrant B Data is divided into 100 sec bins |
 |
 |
| Module-wise count rates for Quadrant C Data is divided into 100 sec bins |
 |
 |
| Module-wise count rates for Quadrant D Data is divided into 100 sec bins |
 |
 |
| Parameter | Plot |
|---|---|
| CZT HV Monitor |  |
| D_VDD |  |
| Temperature 1 | 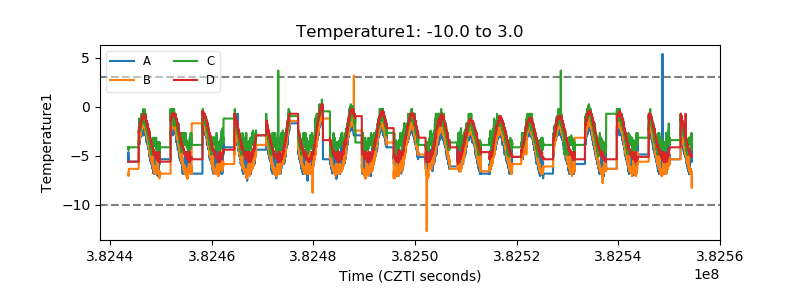 |
| Veto HV Monitor |  |
| Veto LLD |  |
| Alpha Counter |  |
| _CPM_Rate |  |
| CZT Counter |  |
| +2.5 Volts monitor |  |
| +5 Volts monitor |  |
| _ROLL_ROT | 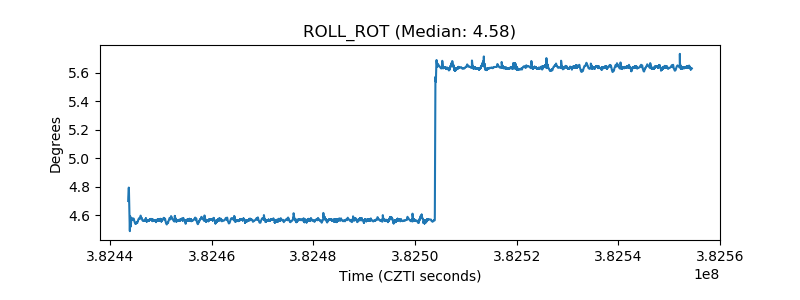 |
| _Roll_DEC | 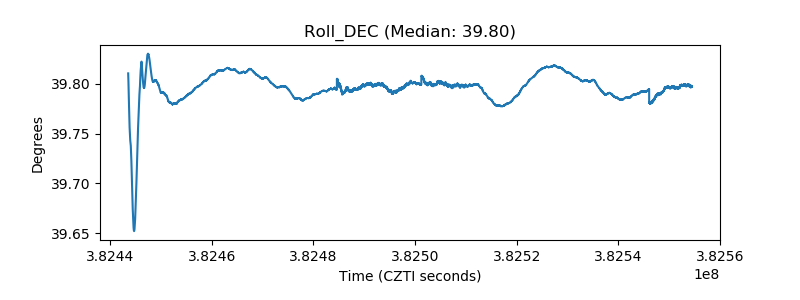 |
| _Roll_RA | 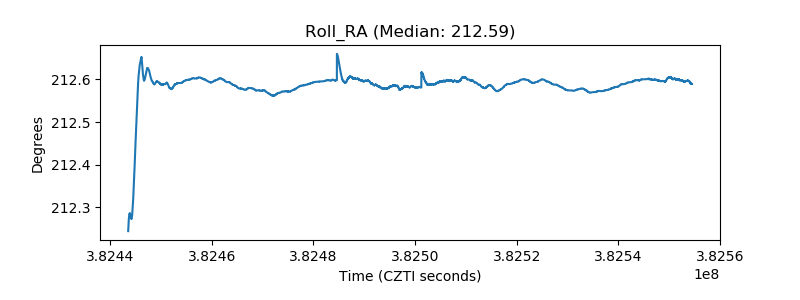 |
| Veto Counter |  |