| Param | Original file | Final file |
|---|---|---|
| Filename | modeM0/AS1A05_103T05_9000004930cztM0_level2.fits | modeM0/AS1A05_103T05_9000004930cztM0_level2_quad_clean.evt |
| Size (bytes) | 442,569,600 | 436,389,120 |
| Size | 422.1 MB | 416.2 MB |
| Events in quadrant A | 2,795,762 | 2,743,017 |
| Events in quadrant B | 2,566,338 | 2,627,339 |
| Events in quadrant C | 2,733,082 | 2,605,197 |
| Events in quadrant D | 2,050,340 | 1,987,221 |
| Mode M9 | |||
|---|---|---|---|
| Quadrant | BADHDUFLAG | Total packets | Discarded packets |
| A | 0 | 161 | 0 |
| B | 0 | 160 | 0 |
| C | 0 | 160 | 0 |
| D | 0 | 161 | 0 |
| Mode M0 | |||
|---|---|---|---|
| Quadrant | BADHDUFLAG | Total packets | Discarded packets |
| A | 0 | 97417 | 0 |
| B | 0 | 128811 | 0 |
| C | 0 | 104124 | 0 |
| D | 0 | 204203 | 0 |
| Mode SS | |||
|---|---|---|---|
| Quadrant | BADHDUFLAG | Total packets | Discarded packets |
| A | 0 | 964 | 0 |
| B | 0 | 964 | 0 |
| C | 0 | 964 | 0 |
| D | 0 | 964 | 0 |
| Quadrant | Total seconds | Saturated seconds | Saturation percentage |
|---|---|---|---|
| A | 47406 | 107 | 0.225710% |
| B | 47406 | 2736 | 5.771421% |
| C | 47406 | 230 | 0.485171% |
| D | 47406 | 9911 | 20.906636% |
Noise dominated data is calculated using 1-second bins in cleaned event files. If a bin has >2000 counts, and if more than 50% of those come from <1% of pixels, then it is considered to be noise-dominated and hence unusable.
| Quadrant | # 1 sec bins | Bins with >0 counts | Bins with >2000 counts | High rate bins dominated by noise | Noise dominated (total time) | Noise dominated (detector-on time) | Marked lightcurve |
|---|---|---|---|---|---|---|---|
| A | 63356 | 47406 | 0 | 0 | 0.00% | 0.00% | 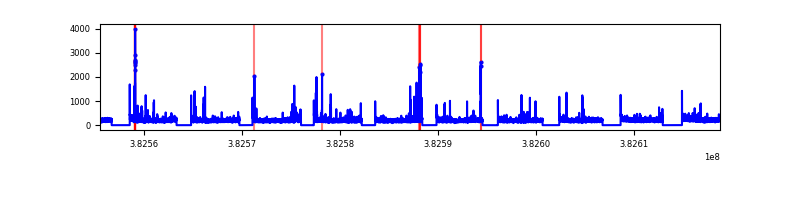 |
| B | 63356 | 47385 | 0 | 0 | 0.00% | 0.00% | 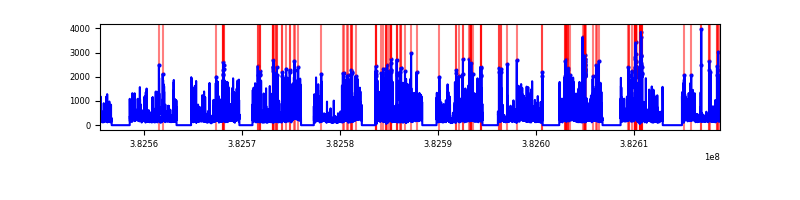 |
| C | 63356 | 47406 | 0 | 0 | 0.00% | 0.00% |  |
| D | 63356 | 47021 | 0 | 0 | 0.00% | 0.00% | 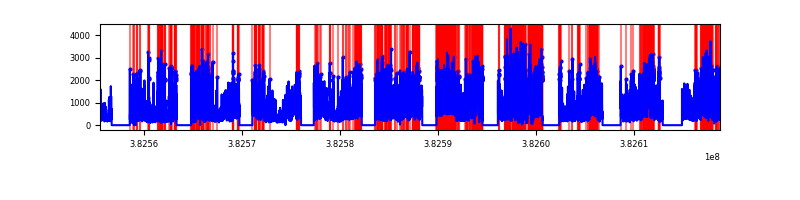 |
Top three noisy pixels from each quadrant. If the there are fewer than three noisy pixels in the level2.evt file, extra rows are filled as -1
| Pixel properties | Quadrant properties | ||||||
|---|---|---|---|---|---|---|---|
| Quadrant | DetID | PixID | Counts | Sigma | Mean | Median | Sigma |
| A | 9 | 19 | 2301 | 9.11 | 730 | 688 | 177.1 |
| A | 0 | 29 | 2222 | 8.66 | 730 | 688 | 177.1 |
| A | 7 | 110 | 2208 | 8.58 | 730 | 688 | 177.1 |
| B | 2 | 9 | 2296 | 12.64 | 680 | 651 | 130.2 |
| B | 3 | 80 | 1993 | 10.31 | 680 | 651 | 130.2 |
| B | 2 | 8 | 1830 | 9.06 | 680 | 651 | 130.2 |
| C | 1 | 81 | 2298 | 8.95 | 721 | 679 | 180.9 |
| C | 1 | 80 | 2266 | 8.77 | 721 | 679 | 180.9 |
| C | 3 | 203 | 2090 | 7.8 | 721 | 679 | 180.9 |
| D | 10 | 189 | 1535 | 6.41 | 589 | 539 | 155.3 |
| D | 10 | 113 | 1513 | 6.27 | 589 | 539 | 155.3 |
| D | 7 | 3 | 1502 | 6.2 | 589 | 539 | 155.3 |
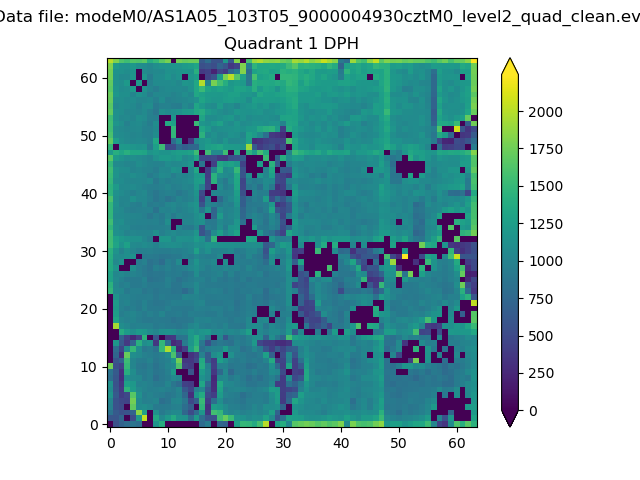
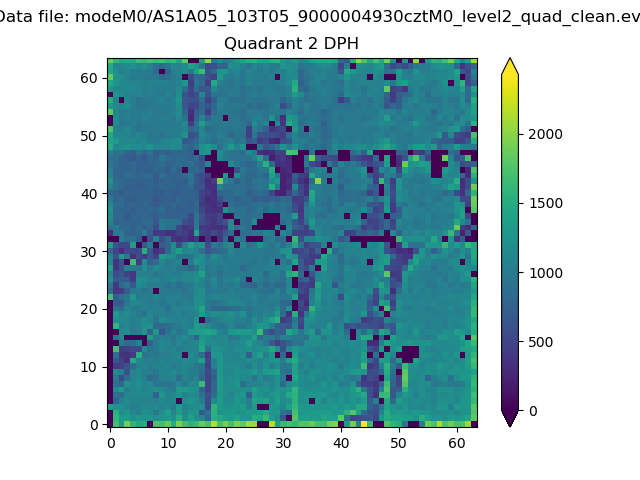
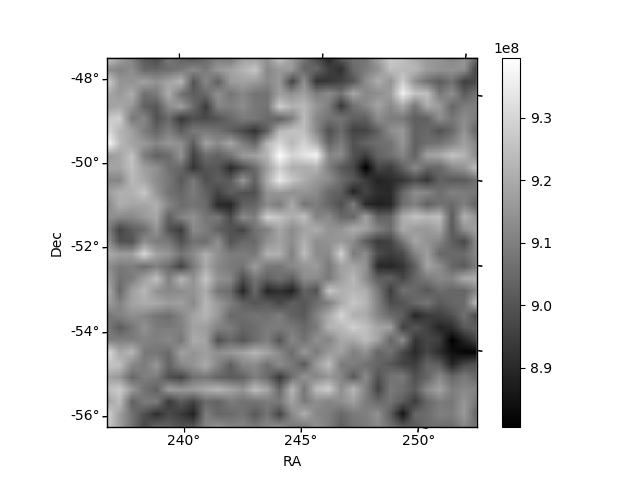
Histogram calculated using DETX and DETY for each event in the final _common_clean file
| Quadrant A | 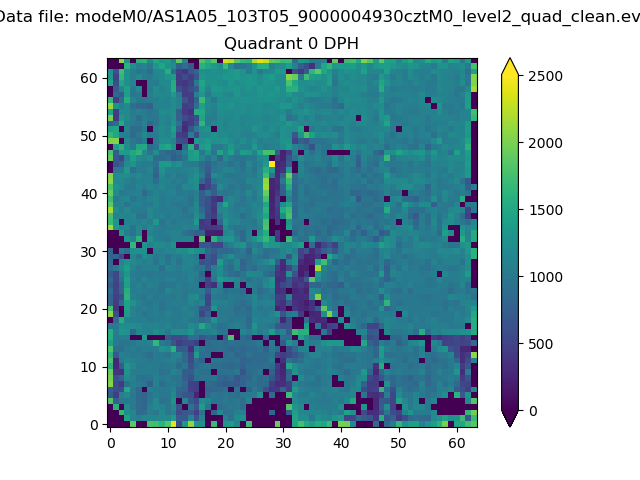 |
 |
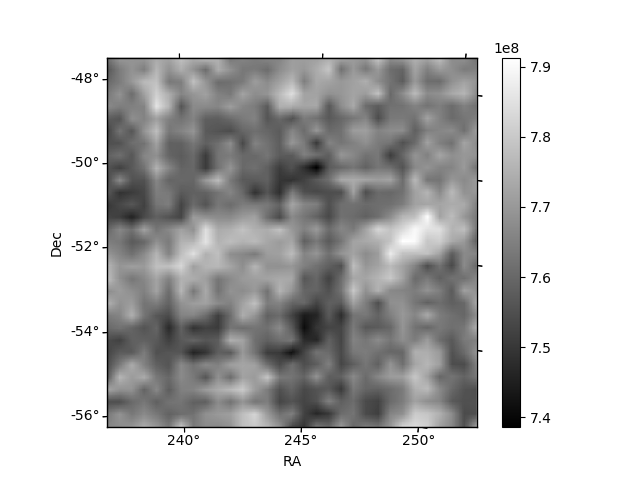
Quadrant B |
|---|---|---|---|
| Quadrant D |  |
 |
Quadrant C |
| Plot type | Count rate plots | Images |
|---|---|---|
| Comparison with Poisson distribution Blue bars denote a histogram of data divided into 1 sec bins. Red curve is a Poisson curve with rate = median count rate of data. |
 |
 |
| Quadrant-wise count rates Data is divided into 100 sec bins |
 |
|
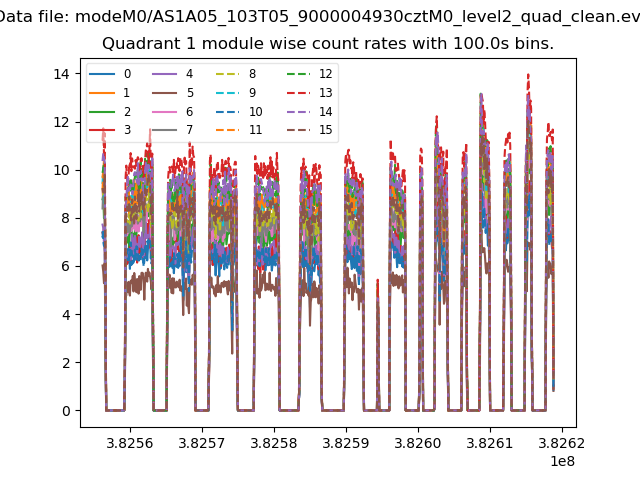
| Module-wise count rates for Quadrant A Data is divided into 100 sec bins |
 |
 |
| Module-wise count rates for Quadrant B Data is divided into 100 sec bins |
 |
 |
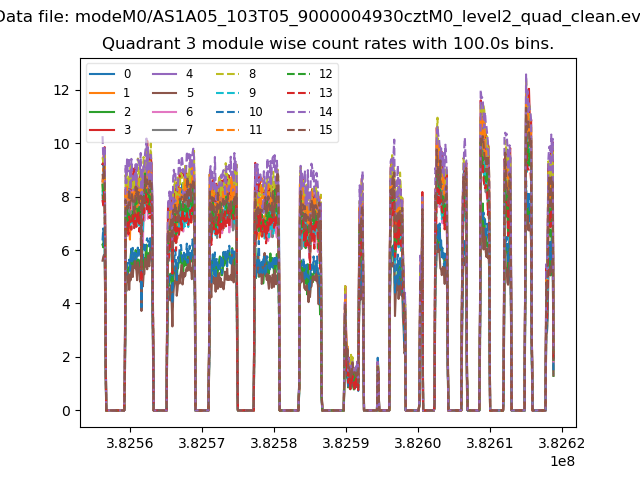
| Module-wise count rates for Quadrant C Data is divided into 100 sec bins |
 |
 |
| Module-wise count rates for Quadrant D Data is divided into 100 sec bins |
 |
 |
| Parameter | Plot |
|---|---|
| CZT HV Monitor |  |
| D_VDD | 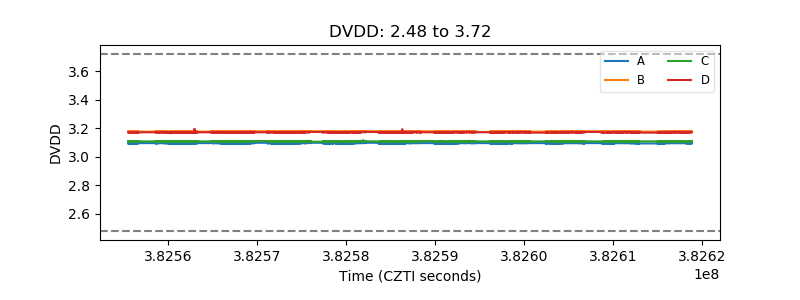 |
| Temperature 1 |  |
| Veto HV Monitor | 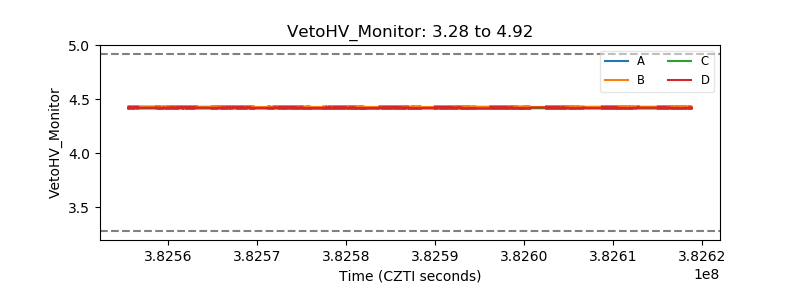 |
| Veto LLD | 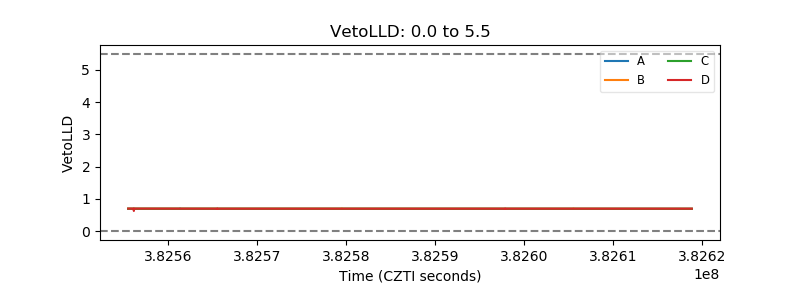 |
| Alpha Counter |  |
| _CPM_Rate | 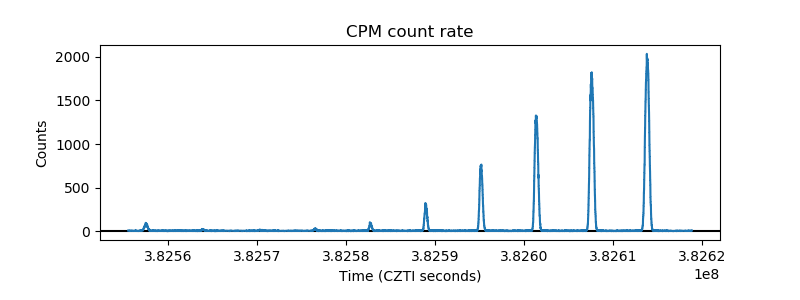 |
| CZT Counter | 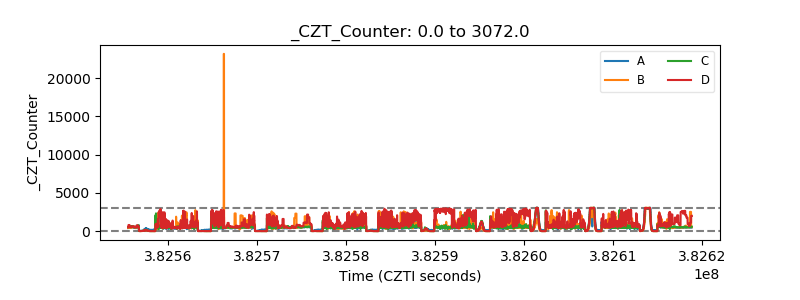 |
| +2.5 Volts monitor |  |
| +5 Volts monitor |  |
| _ROLL_ROT |  |
| _Roll_DEC |  |
| _Roll_RA |  |
| Veto Counter |  |