| Param | Original file | Final file |
|---|---|---|
| Filename | modeM0/AS1A05_103T05_9000004930_34523cztM0_level2.evt | modeM0/AS1A05_103T05_9000004930_34523cztM0_level2_quad_clean.evt |
| Size (bytes) | 406,964,160 | 46,321,920 |
| Size | 388.1 MB | 44.2 MB |
| Events in quadrant A | 1,996,744 | 298,250 |
| Events in quadrant B | 2,526,597 | 286,157 |
| Events in quadrant C | 2,167,981 | 290,161 |
| Events in quadrant D | 5,369,788 | 253,508 |
| Mode M9 | |||
|---|---|---|---|
| Quadrant | BADHDUFLAG | Total packets | Discarded packets |
| A | 0 | 7 | 0 |
| B | 0 | 7 | 0 |
| C | 0 | 7 | 0 |
| D | 0 | 8 | 0 |
| Mode M0 | |||
|---|---|---|---|
| Quadrant | BADHDUFLAG | Total packets | Discarded packets |
| A | 0 | 8116 | 1 |
| B | 0 | 9808 | 1 |
| C | 0 | 8642 | 1 |
| D | 0 | 18768 | 1 |
| Mode SS | |||
|---|---|---|---|
| Quadrant | BADHDUFLAG | Total packets | Discarded packets |
| A | 0 | 76 | 0 |
| B | 0 | 76 | 0 |
| C | 0 | 76 | 0 |
| D | 0 | 76 | 0 |
| Quadrant | Total seconds | Saturated seconds | Saturation percentage |
|---|---|---|---|
| A | 3887 | 1 | 0.025727% |
| B | 3887 | 166 | 4.270646% |
| C | 3887 | 13 | 0.334448% |
| D | 3887 | 975 | 25.083612% |
Noise dominated data is calculated using 1-second bins in cleaned event files. If a bin has >2000 counts, and if more than 50% of those come from <1% of pixels, then it is considered to be noise-dominated and hence unusable.
| Quadrant | # 1 sec bins | Bins with >0 counts | Bins with >2000 counts | High rate bins dominated by noise | Noise dominated (total time) | Noise dominated (detector-on time) | Marked lightcurve |
|---|---|---|---|---|---|---|---|
| A | 3887 | 3887 | 0 | 0 | 0.00% | 0.00% | 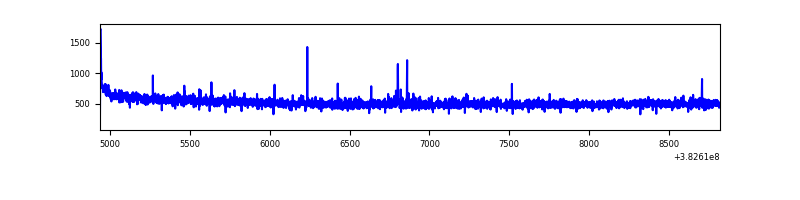 |
| B | 3887 | 3887 | 115 | 115 | 2.96% | 2.96% | 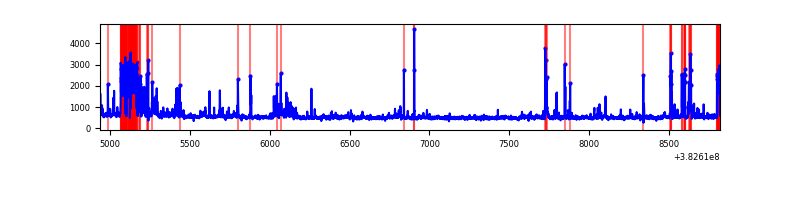 |
| C | 3887 | 3887 | 7 | 7 | 0.18% | 0.18% | 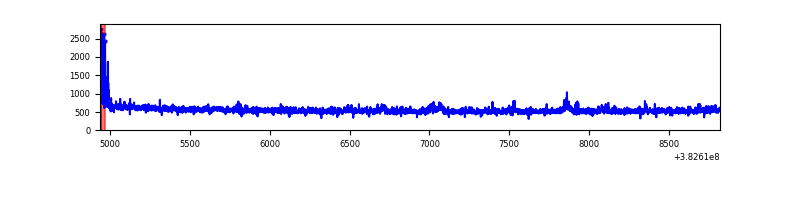 |
| D | 3887 | 3887 | 856 | 856 | 22.02% | 22.02% | 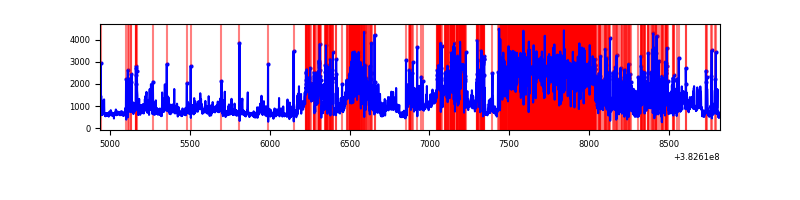 |
Top three noisy pixels from each quadrant. If the there are fewer than three noisy pixels in the level2.evt file, extra rows are filled as -1
| Pixel properties | Quadrant properties | ||||||
|---|---|---|---|---|---|---|---|
| Quadrant | DetID | PixID | Counts | Sigma | Mean | Median | Sigma |
| A | 10 | 83 | 23087 | 222.7 | 505 | 496 | 101.4 |
| A | 9 | 143 | 10830 | 101.87 | 505 | 496 | 101.4 |
| A | 13 | 254 | 6792 | 62.07 | 505 | 496 | 101.4 |
| B | 5 | 172 | 323600 | 3575.91 | 485 | 475 | 90.4 |
| B | 0 | 229 | 65176 | 716.02 | 485 | 475 | 90.4 |
| B | 5 | 236 | 59082 | 648.58 | 485 | 475 | 90.4 |
| C | 15 | 214 | 176696 | 1602.09 | 483 | 489 | 110.0 |
| C | 14 | 67 | 54346 | 489.67 | 483 | 489 | 110.0 |
| C | 0 | 10 | 35491 | 318.24 | 483 | 489 | 110.0 |
| D | 7 | 38 | 1245989 | 10968.37 | 438 | 429 | 113.6 |
| D | 12 | 235 | 1003123 | 8829.7 | 438 | 429 | 113.6 |
| D | 8 | 195 | 502972 | 4425.38 | 438 | 429 | 113.6 |
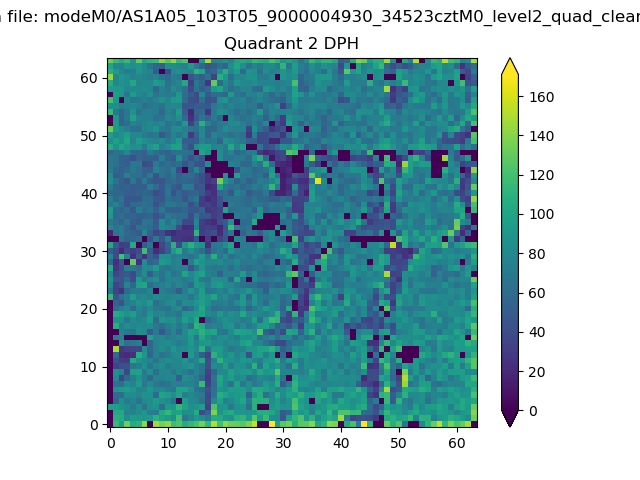
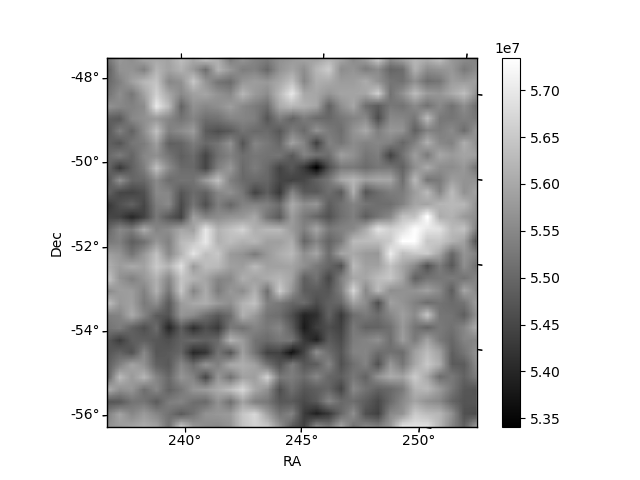
Histogram calculated using DETX and DETY for each event in the final _common_clean file
| Quadrant A |  |
 |
Quadrant B |
|---|---|---|---|
| Quadrant D |  |
 |
Quadrant C |
| Plot type | Count rate plots | Images |
|---|---|---|
| Comparison with Poisson distribution Blue bars denote a histogram of data divided into 1 sec bins. Red curve is a Poisson curve with rate = median count rate of data. |
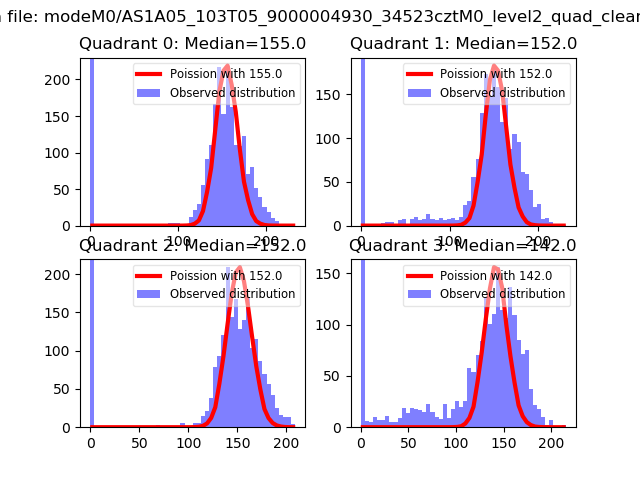 |
 |
| Quadrant-wise count rates Data is divided into 100 sec bins |
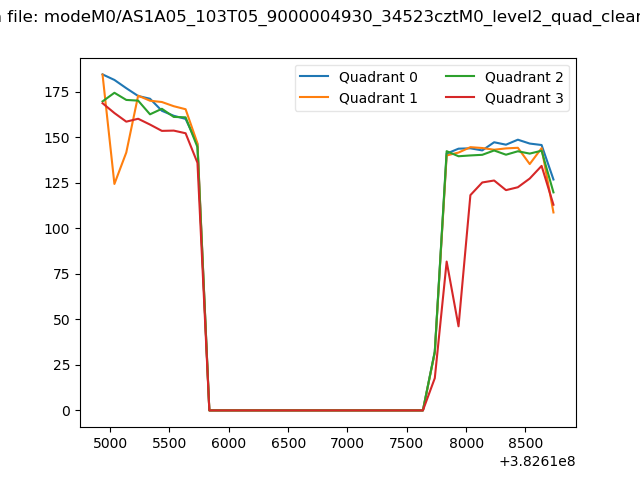 |
|
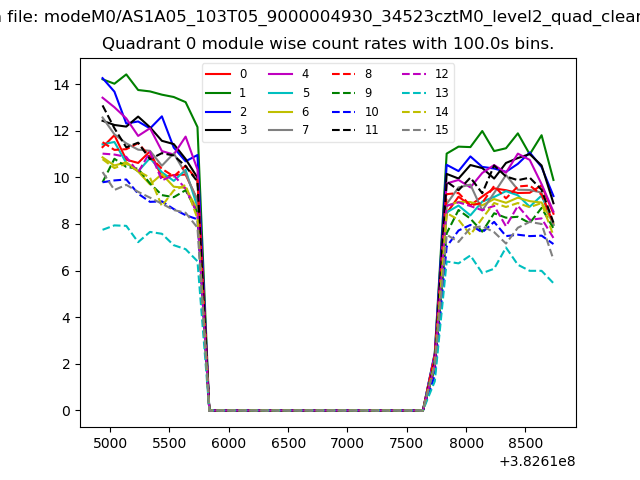
| Module-wise count rates for Quadrant A Data is divided into 100 sec bins |
 |
 |
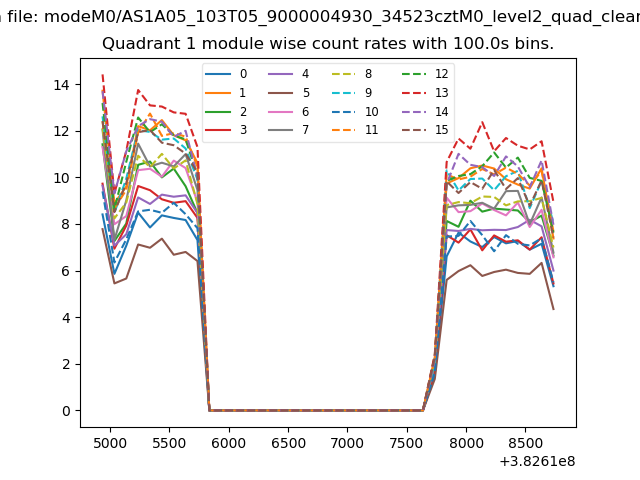
| Module-wise count rates for Quadrant B Data is divided into 100 sec bins |
 |
 |
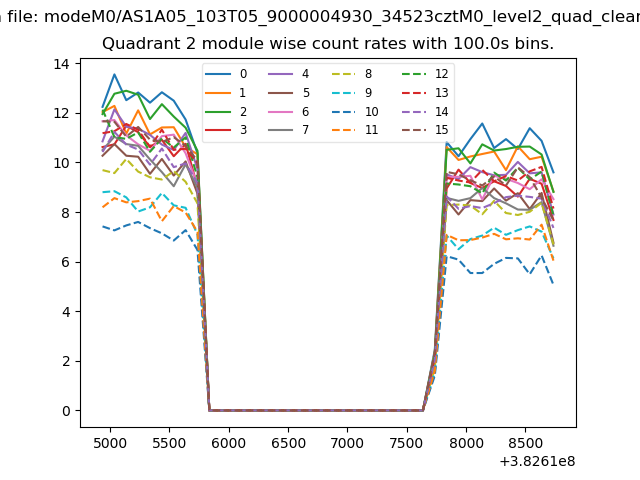
| Module-wise count rates for Quadrant C Data is divided into 100 sec bins |
 |
 |
| Module-wise count rates for Quadrant D Data is divided into 100 sec bins |
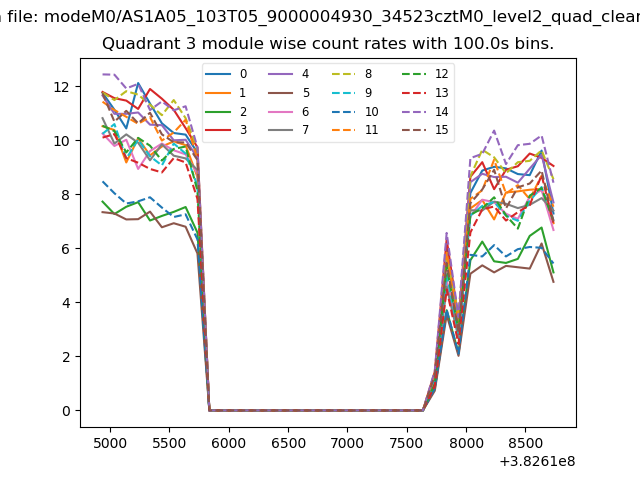 |
 |
| Parameter | Plot |
|---|---|
| CZT HV Monitor | 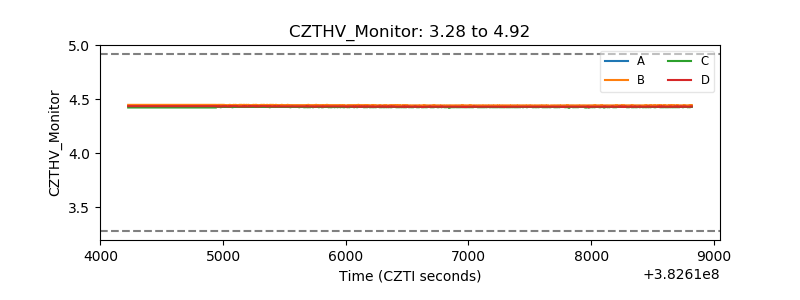 |
| D_VDD | 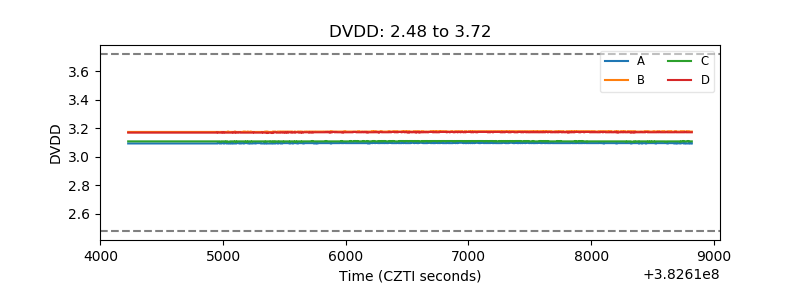 |
| Temperature 1 | 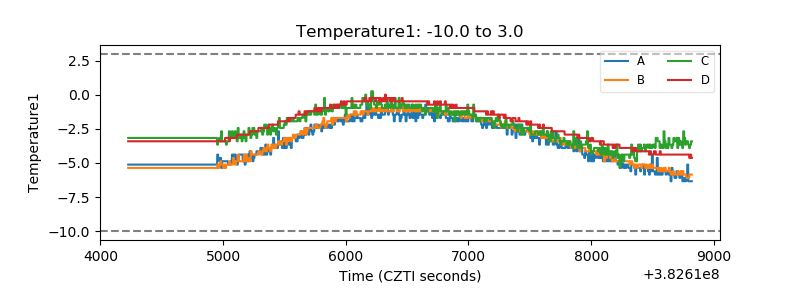 |
| Veto HV Monitor | 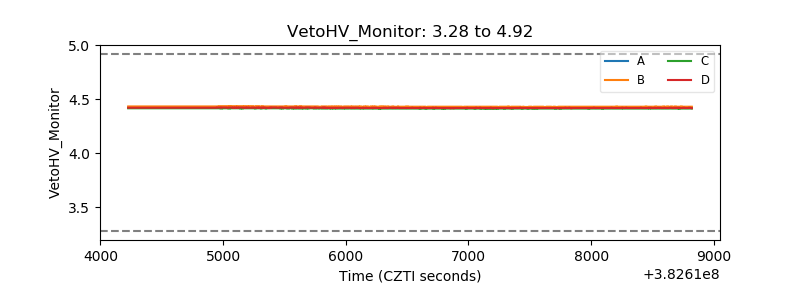 |
| Veto LLD | 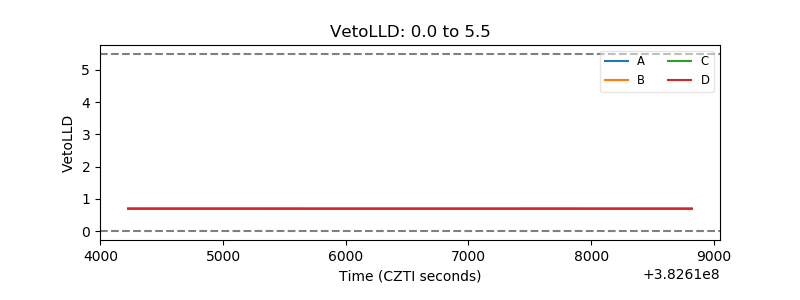 |
| Alpha Counter | 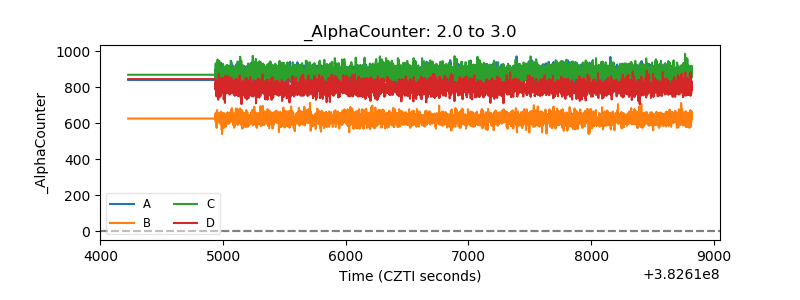 |
| _CPM_Rate | 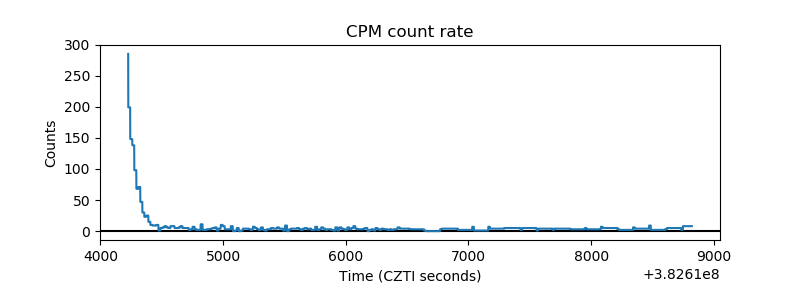 |
| CZT Counter | 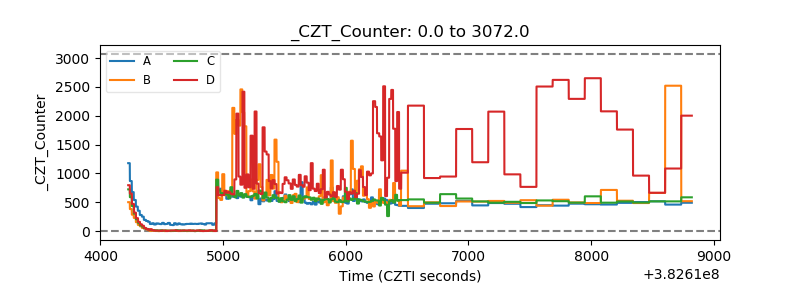 |
| +2.5 Volts monitor |  |
| +5 Volts monitor |  |
| _ROLL_ROT | 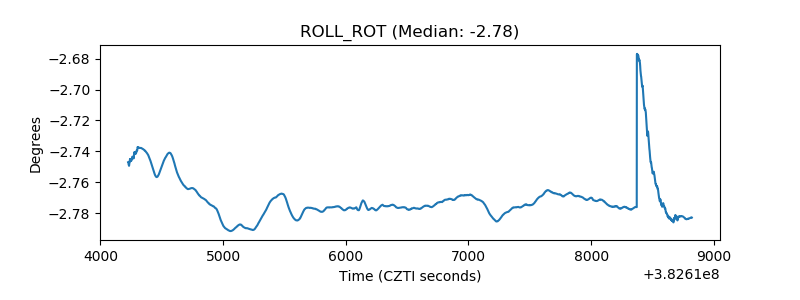 |
| _Roll_DEC | 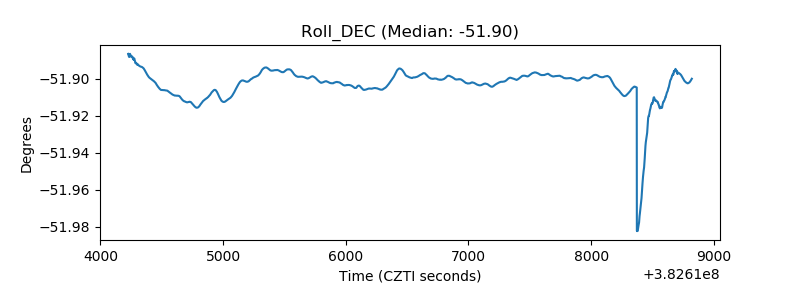 |
| _Roll_RA | 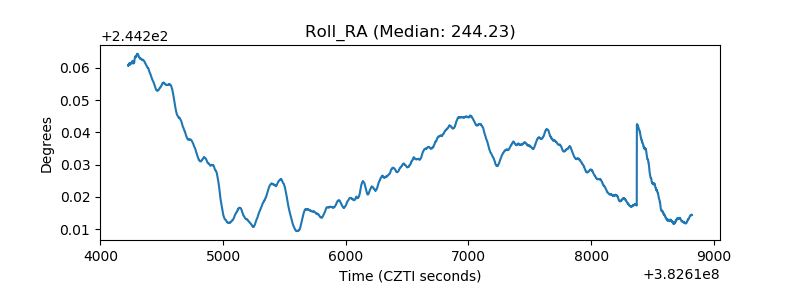 |
| Veto Counter | 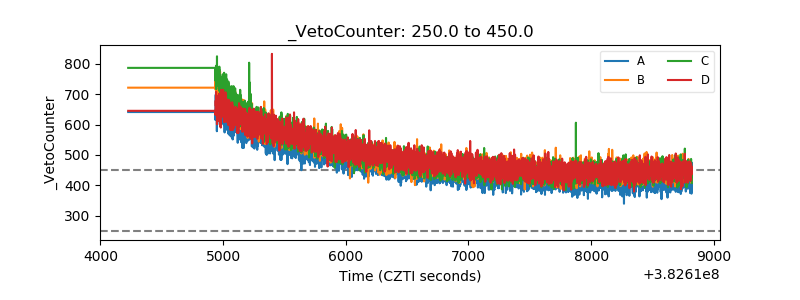 |