| Param | Original file | Final file |
|---|---|---|
| Filename | modeM0/AS1A06_005T01_9000004932cztM0_level2.fits | modeM0/AS1A06_005T01_9000004932cztM0_level2_quad_clean.evt |
| Size (bytes) | 515,494,080 | 530,642,880 |
| Size | 491.6 MB | 506.1 MB |
| Events in quadrant A | 3,235,106 | 3,396,427 |
| Events in quadrant B | 2,955,482 | 3,190,932 |
| Events in quadrant C | 3,144,594 | 3,193,711 |
| Events in quadrant D | 2,552,436 | 2,568,293 |
| Mode M9 | |||
|---|---|---|---|
| Quadrant | BADHDUFLAG | Total packets | Discarded packets |
| A | 0 | 201 | 0 |
| B | 0 | 201 | 0 |
| C | 0 | 201 | 0 |
| D | 0 | 201 | 0 |
| Mode SS | |||
|---|---|---|---|
| Quadrant | BADHDUFLAG | Total packets | Discarded packets |
| A | 0 | 1104 | 0 |
| B | 0 | 1104 | 0 |
| C | 0 | 1104 | 0 |
| D | 0 | 1104 | 0 |
| Mode M0 | |||
|---|---|---|---|
| Quadrant | BADHDUFLAG | Total packets | Discarded packets |
| A | 0 | 111361 | 0 |
| B | 0 | 148216 | 0 |
| C | 0 | 116909 | 0 |
| D | 0 | 193240 | 0 |
| Quadrant | Total seconds | Saturated seconds | Saturation percentage |
|---|---|---|---|
| A | 54243 | 112 | 0.206478% |
| B | 54243 | 3819 | 7.040540% |
| C | 54243 | 159 | 0.293125% |
| D | 54243 | 5825 | 10.738713% |
Noise dominated data is calculated using 1-second bins in cleaned event files. If a bin has >2000 counts, and if more than 50% of those come from <1% of pixels, then it is considered to be noise-dominated and hence unusable.
| Quadrant | # 1 sec bins | Bins with >0 counts | Bins with >2000 counts | High rate bins dominated by noise | Noise dominated (total time) | Noise dominated (detector-on time) | Marked lightcurve |
|---|---|---|---|---|---|---|---|
| A | 72556 | 54242 | 0 | 0 | 0.00% | 0.00% |  |
| B | 72556 | 54167 | 0 | 0 | 0.00% | 0.00% |  |
| C | 72556 | 54241 | 0 | 0 | 0.00% | 0.00% |  |
| D | 72556 | 54171 | 0 | 0 | 0.00% | 0.00% |  |
Top three noisy pixels from each quadrant. If the there are fewer than three noisy pixels in the level2.evt file, extra rows are filled as -1
| Pixel properties | Quadrant properties | ||||||
|---|---|---|---|---|---|---|---|
| Quadrant | DetID | PixID | Counts | Sigma | Mean | Median | Sigma |
| A | 9 | 19 | 2691 | 9.11 | 845 | 796 | 208.0 |
| A | 7 | 110 | 2617 | 8.76 | 845 | 796 | 208.0 |
| A | 0 | 29 | 2513 | 8.26 | 845 | 796 | 208.0 |
| B | 2 | 9 | 2565 | 11.84 | 783 | 750 | 153.3 |
| B | 3 | 80 | 2221 | 9.6 | 783 | 750 | 153.3 |
| B | 2 | 8 | 2075 | 8.64 | 783 | 750 | 153.3 |
| C | 1 | 81 | 2665 | 8.87 | 830 | 780 | 212.5 |
| C | 1 | 80 | 2659 | 8.84 | 830 | 780 | 212.5 |
| C | 3 | 203 | 2512 | 8.15 | 830 | 780 | 212.5 |
| D | 7 | 3 | 1913 | 6.43 | 732 | 670 | 193.2 |
| D | 10 | 189 | 1860 | 6.16 | 732 | 670 | 193.2 |
| D | 10 | 113 | 1844 | 6.08 | 732 | 670 | 193.2 |
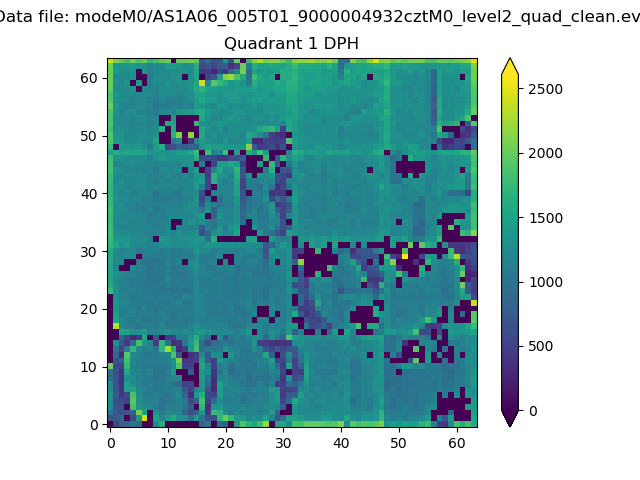
Histogram calculated using DETX and DETY for each event in the final _common_clean file
| Quadrant A |  |
 |
Quadrant B |
|---|---|---|---|
| Quadrant D |  |
 |
Quadrant C |
| Plot type | Count rate plots | Images |
|---|---|---|
| Comparison with Poisson distribution Blue bars denote a histogram of data divided into 1 sec bins. Red curve is a Poisson curve with rate = median count rate of data. |
 |
 |
| Quadrant-wise count rates Data is divided into 100 sec bins |
 |
|
| Module-wise count rates for Quadrant A Data is divided into 100 sec bins |
 |
 |
| Module-wise count rates for Quadrant B Data is divided into 100 sec bins |
 |
 |
| Module-wise count rates for Quadrant C Data is divided into 100 sec bins |
 |
 |
| Module-wise count rates for Quadrant D Data is divided into 100 sec bins |
 |
 |
| Parameter | Plot |
|---|---|
| CZT HV Monitor |  |
| D_VDD |  |
| Temperature 1 |  |
| Veto HV Monitor |  |
| Veto LLD |  |
| Alpha Counter |  |
| _CPM_Rate |  |
| CZT Counter |  |
| +2.5 Volts monitor |  |
| +5 Volts monitor |  |
| _ROLL_ROT |  |
| _Roll_DEC |  |
| _Roll_RA |  |
| Veto Counter | 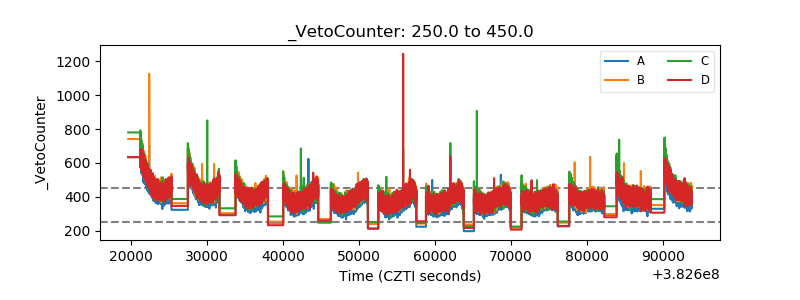 |