| Param | Original file | Final file |
|---|---|---|
| Filename | modeM0/AS1A05_115T02_9000004934cztM0_level2.fits | modeM0/AS1A05_115T02_9000004934cztM0_level2_quad_clean.evt |
| Size (bytes) | 426,225,600 | 455,086,080 |
| Size | 406.5 MB | 434.0 MB |
| Events in quadrant A | 2,662,744 | 2,842,551 |
| Events in quadrant B | 2,484,610 | 2,771,933 |
| Events in quadrant C | 2,598,982 | 2,749,100 |
| Events in quadrant D | 2,188,000 | 2,444,851 |
| Mode SS | |||
|---|---|---|---|
| Quadrant | BADHDUFLAG | Total packets | Discarded packets |
| A | 0 | 884 | 0 |
| B | 0 | 884 | 0 |
| C | 0 | 884 | 0 |
| D | 0 | 884 | 0 |
| Mode M0 | |||
|---|---|---|---|
| Quadrant | BADHDUFLAG | Total packets | Discarded packets |
| A | 0 | 90230 | 0 |
| B | 0 | 105199 | 0 |
| C | 0 | 94073 | 0 |
| D | 0 | 139813 | 0 |
| Mode M9 | |||
|---|---|---|---|
| Quadrant | BADHDUFLAG | Total packets | Discarded packets |
| A | 0 | 171 | 0 |
| B | 0 | 171 | 0 |
| C | 0 | 171 | 0 |
| D | 0 | 171 | 0 |
| Quadrant | Total seconds | Saturated seconds | Saturation percentage |
|---|---|---|---|
| A | 43322 | 94 | 0.216980% |
| B | 43322 | 1216 | 2.806888% |
| C | 43322 | 191 | 0.440885% |
| D | 43322 | 1731 | 3.995660% |
Noise dominated data is calculated using 1-second bins in cleaned event files. If a bin has >2000 counts, and if more than 50% of those come from <1% of pixels, then it is considered to be noise-dominated and hence unusable.
| Quadrant | # 1 sec bins | Bins with >0 counts | Bins with >2000 counts | High rate bins dominated by noise | Noise dominated (total time) | Noise dominated (detector-on time) | Marked lightcurve |
|---|---|---|---|---|---|---|---|
| A | 58884 | 43321 | 0 | 0 | 0.00% | 0.00% |  |
| B | 58884 | 43291 | 0 | 0 | 0.00% | 0.00% |  |
| C | 58884 | 43320 | 0 | 0 | 0.00% | 0.00% |  |
| D | 58884 | 43291 | 0 | 0 | 0.00% | 0.00% |  |
Top three noisy pixels from each quadrant. If the there are fewer than three noisy pixels in the level2.evt file, extra rows are filled as -1
| Pixel properties | Quadrant properties | ||||||
|---|---|---|---|---|---|---|---|
| Quadrant | DetID | PixID | Counts | Sigma | Mean | Median | Sigma |
| A | 7 | 110 | 2134 | 8.68 | 695 | 655 | 170.5 |
| A | 9 | 19 | 2114 | 8.56 | 695 | 655 | 170.5 |
| A | 0 | 29 | 2095 | 8.45 | 695 | 655 | 170.5 |
| B | 2 | 9 | 2148 | 11.61 | 660 | 632 | 130.6 |
| B | 3 | 80 | 1867 | 9.45 | 660 | 632 | 130.6 |
| B | 2 | 8 | 1697 | 8.15 | 660 | 632 | 130.6 |
| C | 1 | 81 | 2119 | 8.5 | 686 | 648 | 173.0 |
| C | 1 | 80 | 2098 | 8.38 | 686 | 648 | 173.0 |
| C | 3 | 203 | 2004 | 7.84 | 686 | 648 | 173.0 |
| D | 10 | 113 | 1628 | 6.4 | 627 | 575 | 164.6 |
| D | 10 | 189 | 1618 | 6.34 | 627 | 575 | 164.6 |
| D | 4 | 160 | 1615 | 6.32 | 627 | 575 | 164.6 |
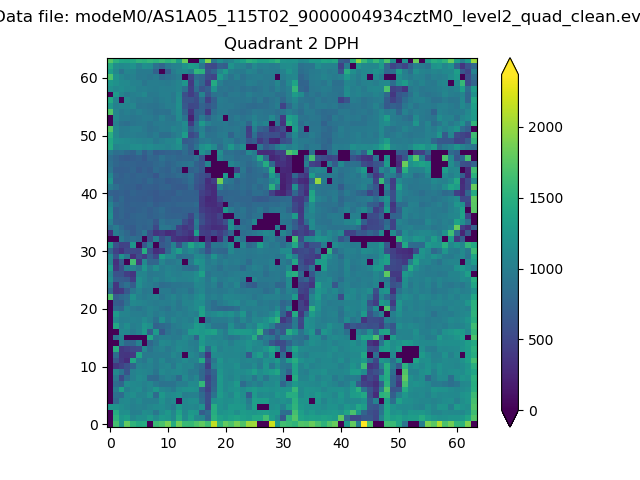
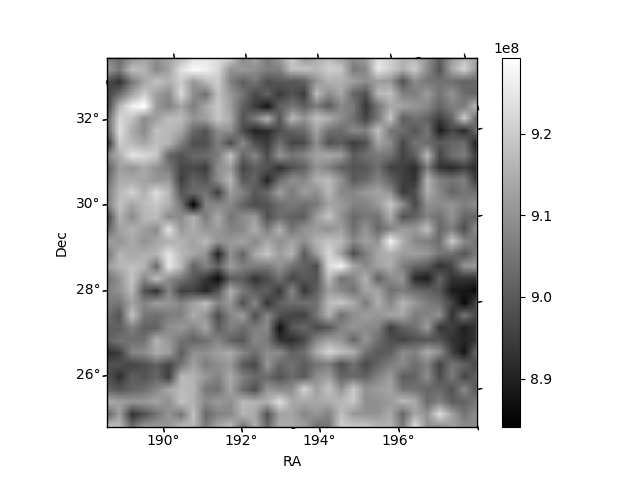
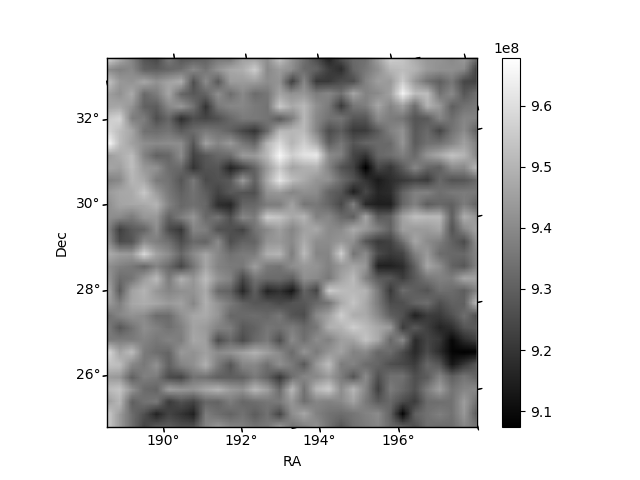
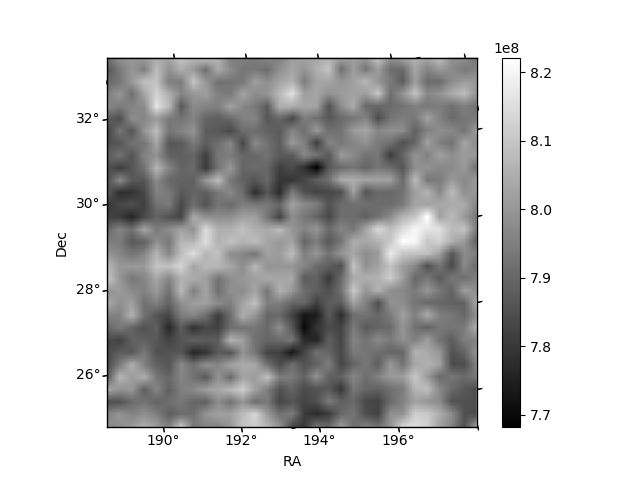
Histogram calculated using DETX and DETY for each event in the final _common_clean file
| Quadrant A | 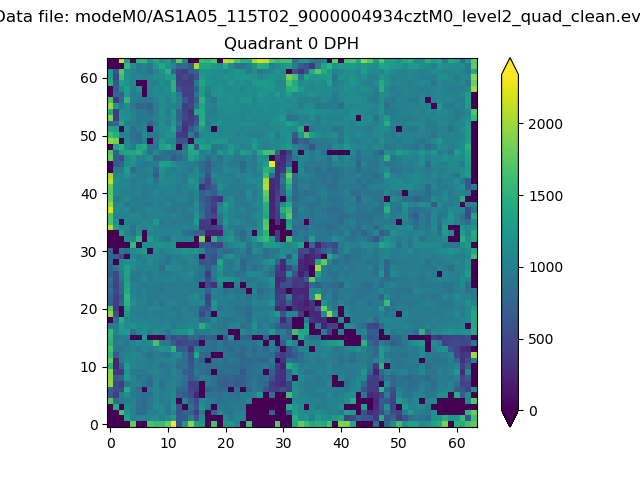 |
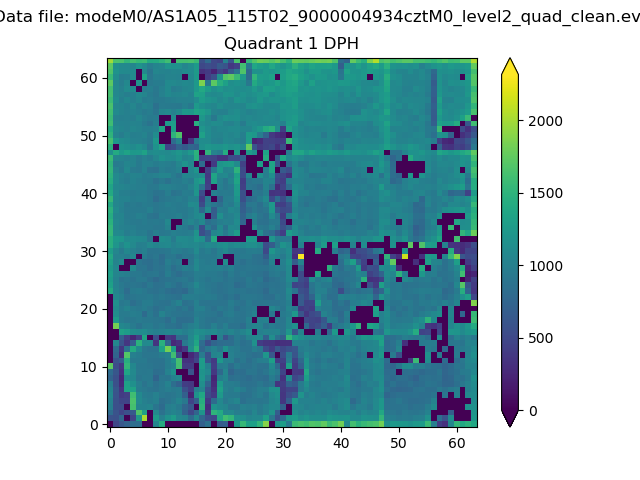 |
Quadrant B |
|---|---|---|---|
| Quadrant D | 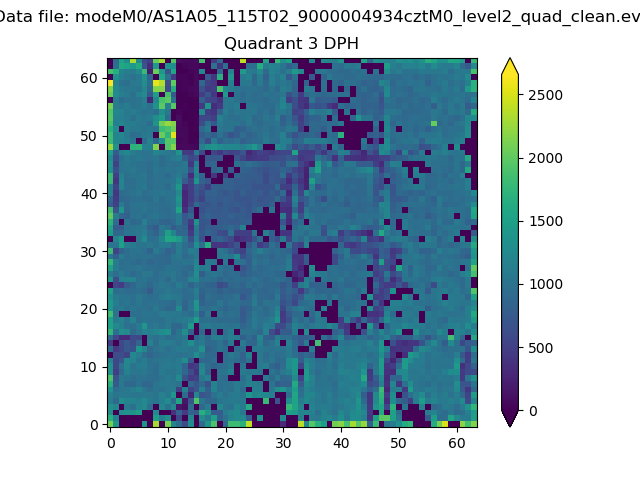 |
 |
Quadrant C |
| Plot type | Count rate plots | Images |
|---|---|---|
| Comparison with Poisson distribution Blue bars denote a histogram of data divided into 1 sec bins. Red curve is a Poisson curve with rate = median count rate of data. |
 |
 |
| Quadrant-wise count rates Data is divided into 100 sec bins |
 |
|
| Module-wise count rates for Quadrant A Data is divided into 100 sec bins |
 |
 |
| Module-wise count rates for Quadrant B Data is divided into 100 sec bins |
 |
 |
| Module-wise count rates for Quadrant C Data is divided into 100 sec bins |
 |
 |
| Module-wise count rates for Quadrant D Data is divided into 100 sec bins |
 |
 |
| Parameter | Plot |
|---|---|
| CZT HV Monitor |  |
| D_VDD | 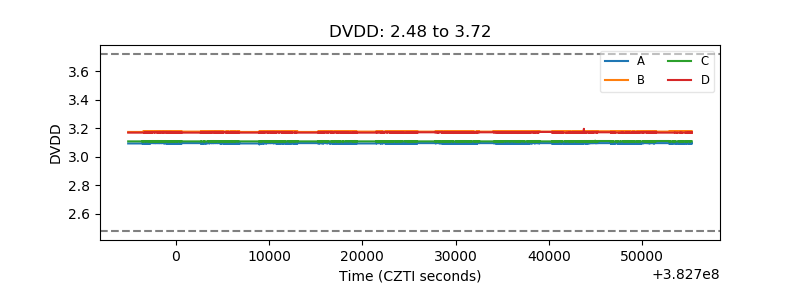 |
| Temperature 1 |  |
| Veto HV Monitor | 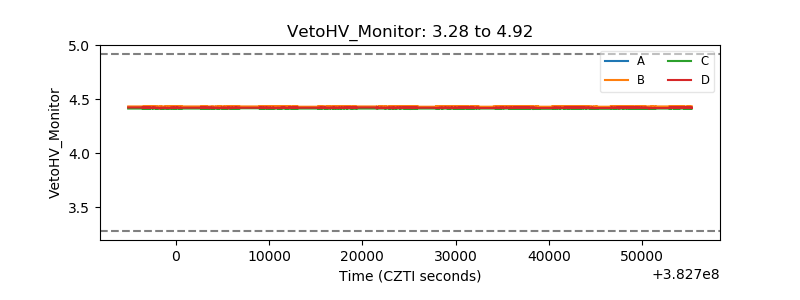 |
| Veto LLD | 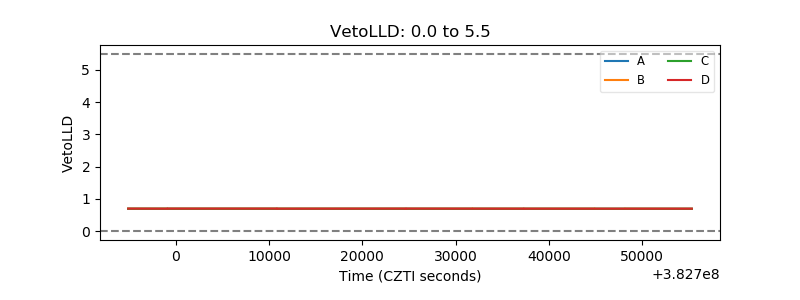 |
| Alpha Counter |  |
| _CPM_Rate |  |
| CZT Counter |  |
| +2.5 Volts monitor | 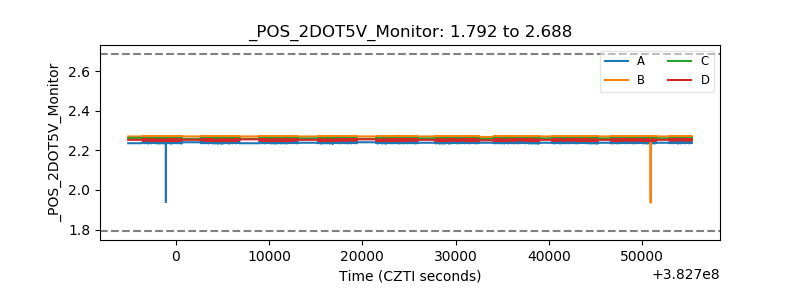 |
| +5 Volts monitor |  |
| _ROLL_ROT |  |
| _Roll_DEC | 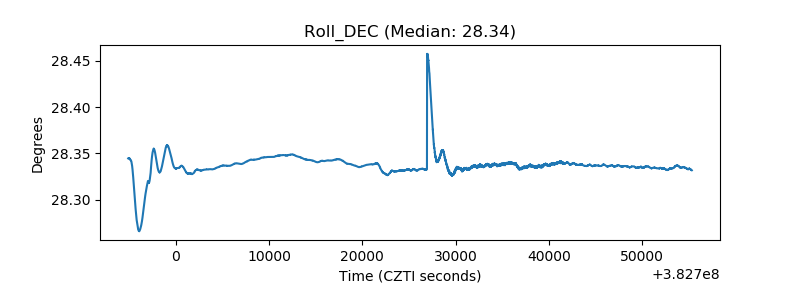 |
| _Roll_RA | 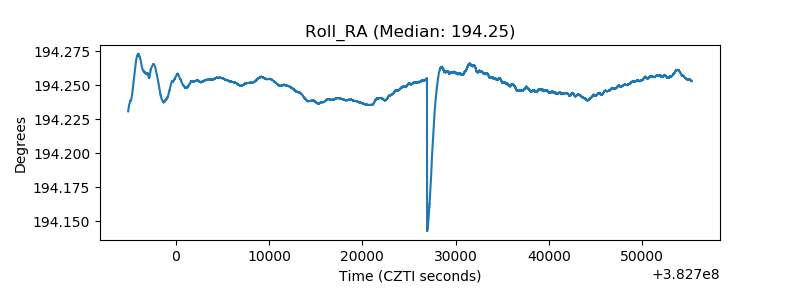 |
| Veto Counter | 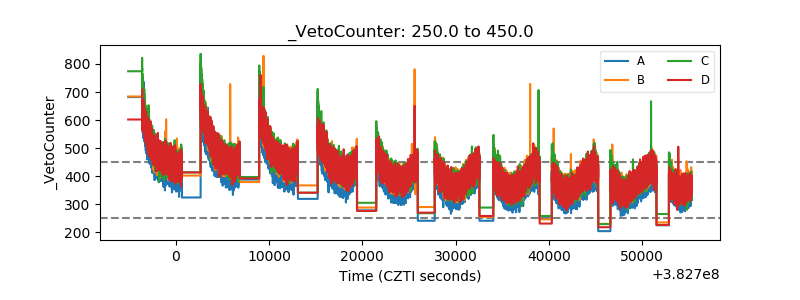 |