| Param | Original file | Final file |
|---|---|---|
| Filename | modeM0/AS1A05_097T01_9000004936cztM0_level2.fits | modeM0/AS1A05_097T01_9000004936cztM0_level2_quad_clean.evt |
| Size (bytes) | 277,390,080 | 167,584,320 |
| Size | 264.5 MB | 159.8 MB |
| Events in quadrant A | 1,756,456 | 844,462 |
| Events in quadrant B | 1,603,136 | 798,897 |
| Events in quadrant C | 1,710,538 | 816,436 |
| Events in quadrant D | 1,437,446 | 720,303 |
| Mode M0 | |||
|---|---|---|---|
| Quadrant | BADHDUFLAG | Total packets | Discarded packets |
| A | 0 | 57473 | 0 |
| B | 0 | 72772 | 0 |
| C | 0 | 60348 | 0 |
| D | 0 | 102805 | 0 |
| Mode SS | |||
|---|---|---|---|
| Quadrant | BADHDUFLAG | Total packets | Discarded packets |
| A | 0 | 560 | 0 |
| B | 0 | 560 | 0 |
| C | 0 | 560 | 0 |
| D | 0 | 560 | 0 |
| Mode M9 | |||
|---|---|---|---|
| Quadrant | BADHDUFLAG | Total packets | Discarded packets |
| A | 0 | 106 | 0 |
| B | 0 | 105 | 0 |
| C | 0 | 105 | 0 |
| D | 0 | 106 | 0 |
| Quadrant | Total seconds | Saturated seconds | Saturation percentage |
|---|---|---|---|
| A | 27538 | 69 | 0.250563% |
| B | 27538 | 1565 | 5.683056% |
| C | 27538 | 57 | 0.206987% |
| D | 27538 | 1465 | 5.319922% |
Noise dominated data is calculated using 1-second bins in cleaned event files. If a bin has >2000 counts, and if more than 50% of those come from <1% of pixels, then it is considered to be noise-dominated and hence unusable.
| Quadrant | # 1 sec bins | Bins with >0 counts | Bins with >2000 counts | High rate bins dominated by noise | Noise dominated (total time) | Noise dominated (detector-on time) | Marked lightcurve |
|---|---|---|---|---|---|---|---|
| A | 38177 | 27538 | 0 | 0 | 0.00% | 0.00% |  |
| B | 38177 | 27513 | 0 | 0 | 0.00% | 0.00% |  |
| C | 38177 | 27538 | 0 | 0 | 0.00% | 0.00% |  |
| D | 38177 | 27534 | 0 | 0 | 0.00% | 0.00% |  |
Top three noisy pixels from each quadrant. If the there are fewer than three noisy pixels in the level2.evt file, extra rows are filled as -1
| Pixel properties | Quadrant properties | ||||||
|---|---|---|---|---|---|---|---|
| Quadrant | DetID | PixID | Counts | Sigma | Mean | Median | Sigma |
| A | 9 | 19 | 1399 | 8.47 | 459 | 432 | 114.1 |
| A | 0 | 29 | 1386 | 8.36 | 459 | 432 | 114.1 |
| A | 7 | 110 | 1349 | 8.04 | 459 | 432 | 114.1 |
| B | 2 | 9 | 1370 | 11.44 | 425 | 406 | 84.3 |
| B | 3 | 80 | 1284 | 10.42 | 425 | 406 | 84.3 |
| B | 2 | 8 | 1170 | 9.06 | 425 | 406 | 84.3 |
| C | 3 | 202 | 1374 | 8.23 | 452 | 425 | 115.3 |
| C | 1 | 81 | 1348 | 8.0 | 452 | 425 | 115.3 |
| C | 3 | 203 | 1341 | 7.94 | 452 | 425 | 115.3 |
| D | 10 | 113 | 1071 | 6.39 | 412 | 378 | 108.4 |
| D | 7 | 3 | 1045 | 6.15 | 412 | 378 | 108.4 |
| D | 6 | 38 | 1007 | 5.8 | 412 | 378 | 108.4 |
Histogram calculated using DETX and DETY for each event in the final _common_clean file
| Quadrant A |  |
 |
Quadrant B |
|---|---|---|---|
| Quadrant D |  |
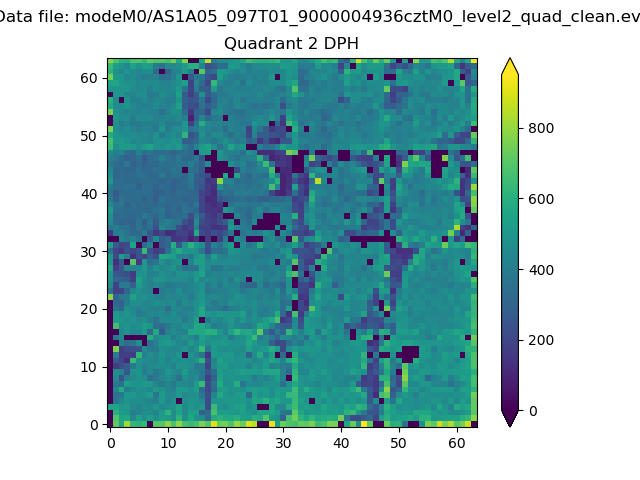 |
Quadrant C |
| Plot type | Count rate plots | Images |
|---|---|---|
| Comparison with Poisson distribution Blue bars denote a histogram of data divided into 1 sec bins. Red curve is a Poisson curve with rate = median count rate of data. |
 |
 |
| Quadrant-wise count rates Data is divided into 100 sec bins |
 |
|
| Module-wise count rates for Quadrant A Data is divided into 100 sec bins |
 |
 |
| Module-wise count rates for Quadrant B Data is divided into 100 sec bins |
 |
 |
| Module-wise count rates for Quadrant C Data is divided into 100 sec bins |
 |
 |
| Module-wise count rates for Quadrant D Data is divided into 100 sec bins |
 |
 |
| Parameter | Plot |
|---|---|
| CZT HV Monitor |  |
| D_VDD |  |
| Temperature 1 |  |
| Veto HV Monitor |  |
| Veto LLD |  |
| Alpha Counter |  |
| _CPM_Rate |  |
| CZT Counter |  |
| +2.5 Volts monitor |  |
| +5 Volts monitor |  |
| _ROLL_ROT |  |
| _Roll_DEC |  |
| _Roll_RA |  |
| Veto Counter |  |