| Param | Original file | Final file |
|---|---|---|
| Filename | modeM0/AS1A05_103T05_9000004938cztM0_level2.fits | modeM0/AS1A05_103T05_9000004938cztM0_level2_quad_clean.evt |
| Size (bytes) | 264,484,800 | 308,004,480 |
| Size | 252.2 MB | 293.7 MB |
| Events in quadrant A | 1,659,908 | 2,011,521 |
| Events in quadrant B | 1,529,802 | 1,932,843 |
| Events in quadrant C | 1,594,804 | 1,886,274 |
| Events in quadrant D | 1,295,740 | 1,569,155 |
| Mode M9 | |||
|---|---|---|---|
| Quadrant | BADHDUFLAG | Total packets | Discarded packets |
| A | 0 | 118 | 0 |
| B | 0 | 118 | 0 |
| C | 0 | 118 | 0 |
| D | 0 | 118 | 0 |
| Mode SS | |||
|---|---|---|---|
| Quadrant | BADHDUFLAG | Total packets | Discarded packets |
| A | 0 | 572 | 0 |
| B | 0 | 572 | 0 |
| C | 0 | 572 | 0 |
| D | 0 | 572 | 0 |
| Mode M0 | |||
|---|---|---|---|
| Quadrant | BADHDUFLAG | Total packets | Discarded packets |
| A | 0 | 58264 | 0 |
| B | 0 | 71645 | 0 |
| C | 0 | 59164 | 0 |
| D | 0 | 116601 | 0 |
| Quadrant | Total seconds | Saturated seconds | Saturation percentage |
|---|---|---|---|
| A | 28050 | 103 | 0.367201% |
| B | 28050 | 1199 | 4.274510% |
| C | 28050 | 140 | 0.499109% |
| D | 28049 | 3164 | 11.280260% |
Noise dominated data is calculated using 1-second bins in cleaned event files. If a bin has >2000 counts, and if more than 50% of those come from <1% of pixels, then it is considered to be noise-dominated and hence unusable.
| Quadrant | # 1 sec bins | Bins with >0 counts | Bins with >2000 counts | High rate bins dominated by noise | Noise dominated (total time) | Noise dominated (detector-on time) | Marked lightcurve |
|---|---|---|---|---|---|---|---|
| A | 37815 | 28049 | 0 | 0 | 0.00% | 0.00% | 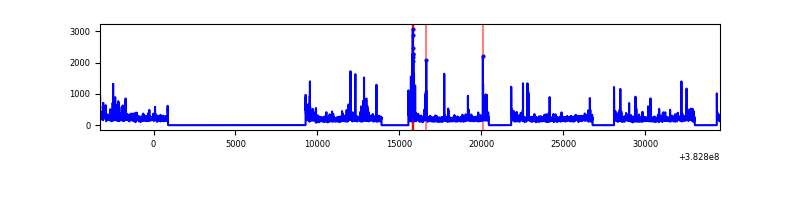 |
| B | 37815 | 28035 | 0 | 0 | 0.00% | 0.00% | 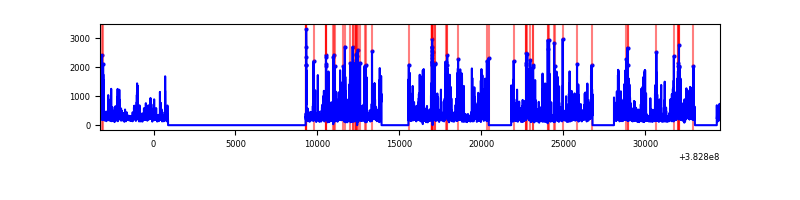 |
| C | 37815 | 28035 | 0 | 0 | 0.00% | 0.00% | 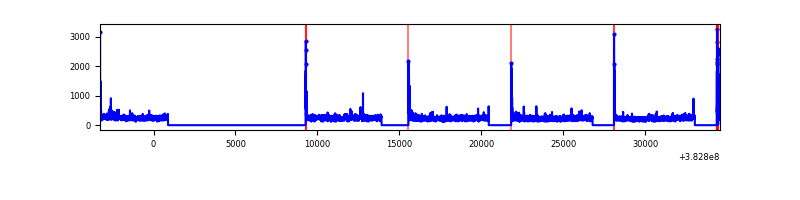 |
| D | 37815 | 28015 | 0 | 0 | 0.00% | 0.00% | 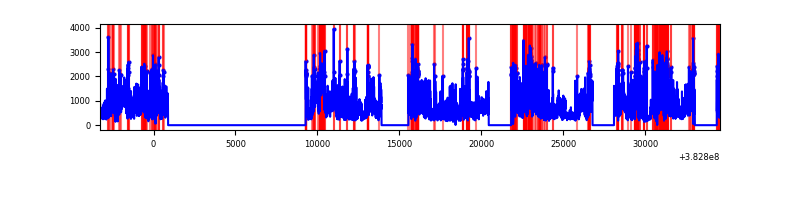 |
Top three noisy pixels from each quadrant. If the there are fewer than three noisy pixels in the level2.evt file, extra rows are filled as -1
| Pixel properties | Quadrant properties | ||||||
|---|---|---|---|---|---|---|---|
| Quadrant | DetID | PixID | Counts | Sigma | Mean | Median | Sigma |
| A | 9 | 19 | 1412 | 9.26 | 433 | 409 | 108.3 |
| A | 7 | 110 | 1404 | 9.18 | 433 | 409 | 108.3 |
| A | 0 | 29 | 1331 | 8.51 | 433 | 409 | 108.3 |
| B | 2 | 9 | 1303 | 11.68 | 405 | 389 | 78.3 |
| B | 3 | 80 | 1170 | 9.98 | 405 | 389 | 78.3 |
| B | 2 | 8 | 1094 | 9.01 | 405 | 389 | 78.3 |
| C | 3 | 187 | 1106 | 6.56 | 422 | 398 | 107.9 |
| C | 1 | 65 | 1068 | 6.21 | 422 | 398 | 107.9 |
| C | 3 | 158 | 1047 | 6.02 | 422 | 398 | 107.9 |
| D | 4 | 160 | 989 | 6.55 | 371 | 339 | 99.3 |
| D | 6 | 231 | 986 | 6.52 | 371 | 339 | 99.3 |
| D | 6 | 38 | 963 | 6.28 | 371 | 339 | 99.3 |
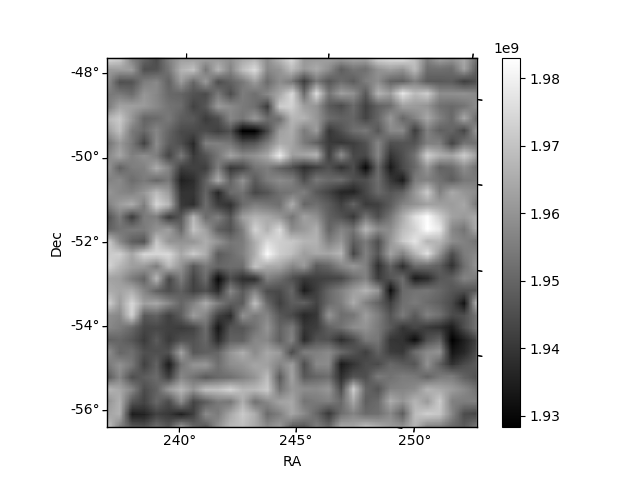
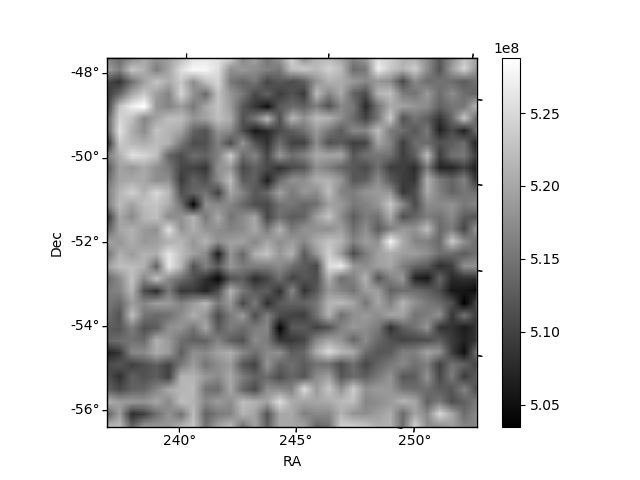
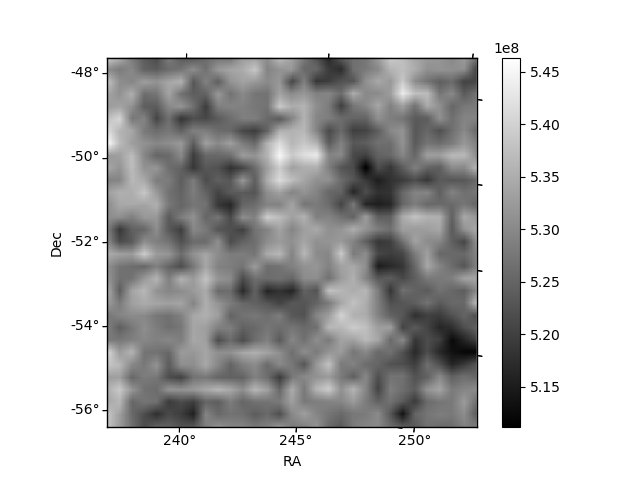
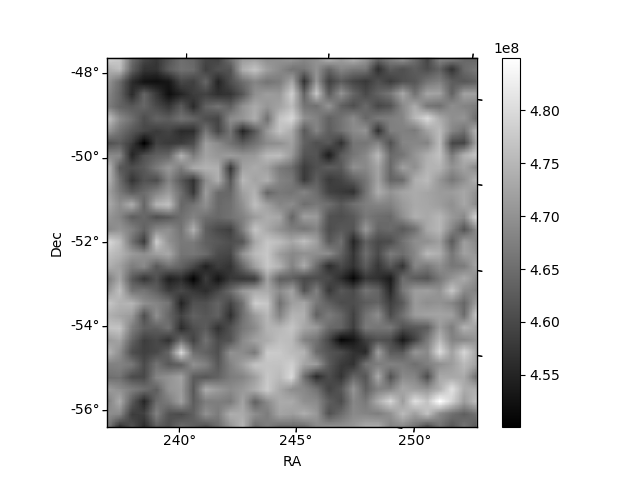
Histogram calculated using DETX and DETY for each event in the final _common_clean file
| Quadrant A | 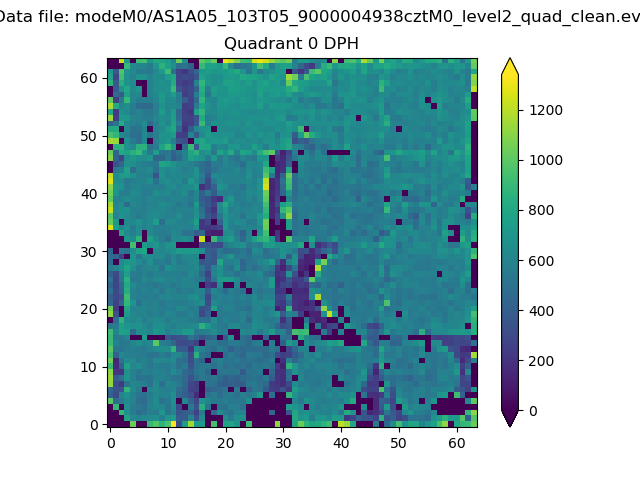 |
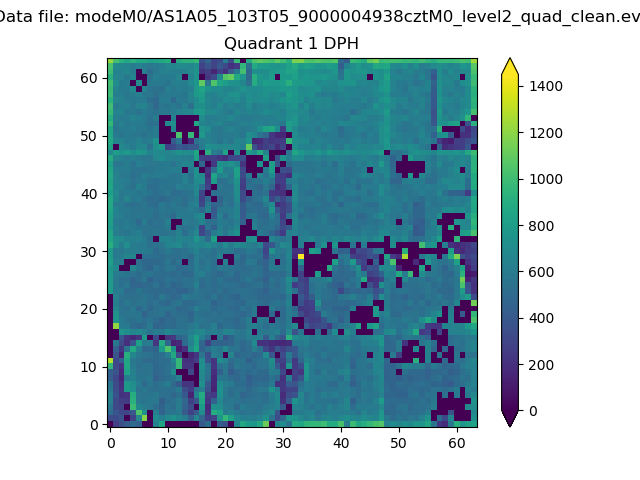 |
Quadrant B |
|---|---|---|---|
| Quadrant D | 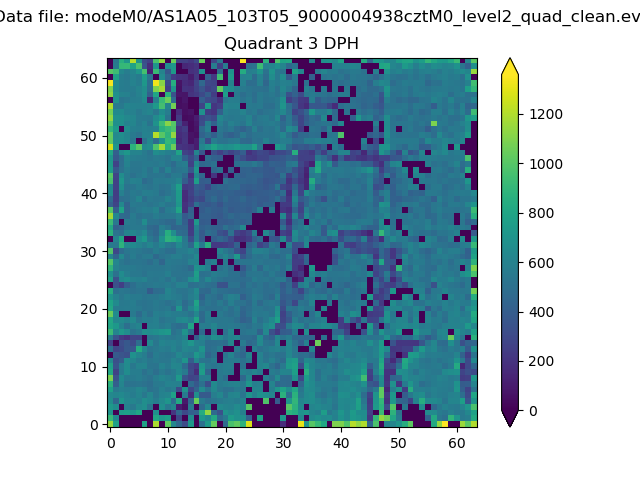 |
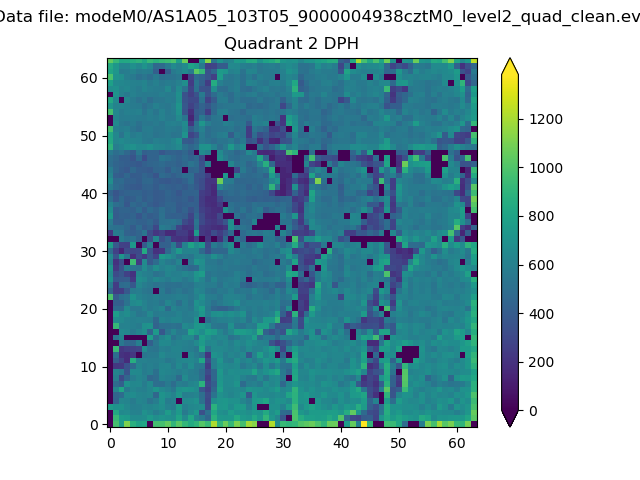 |
Quadrant C |
| Plot type | Count rate plots | Images |
|---|---|---|
| Comparison with Poisson distribution Blue bars denote a histogram of data divided into 1 sec bins. Red curve is a Poisson curve with rate = median count rate of data. |
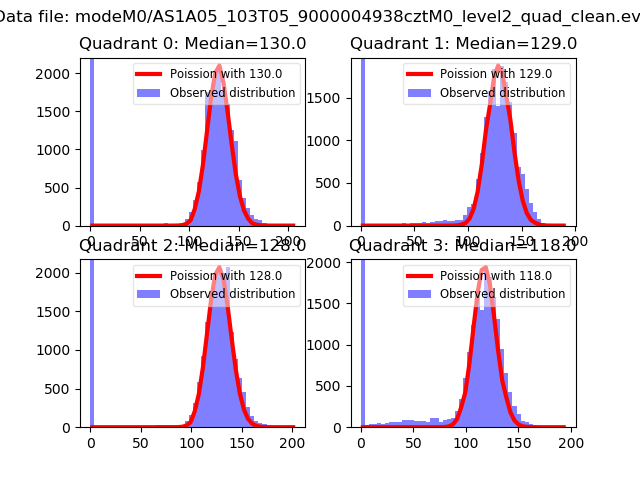 |
 |
| Quadrant-wise count rates Data is divided into 100 sec bins |
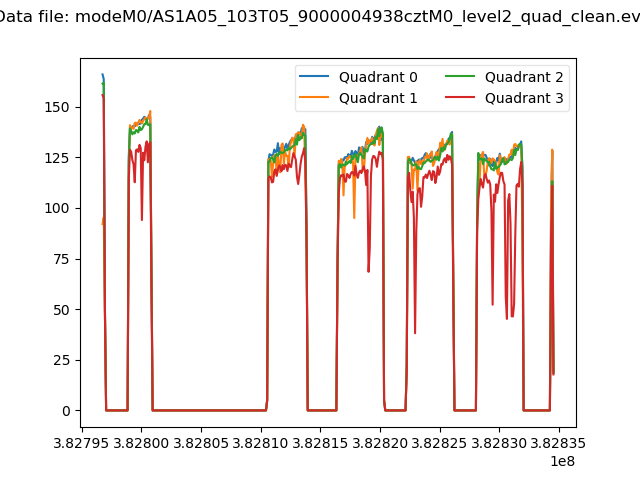 |
|
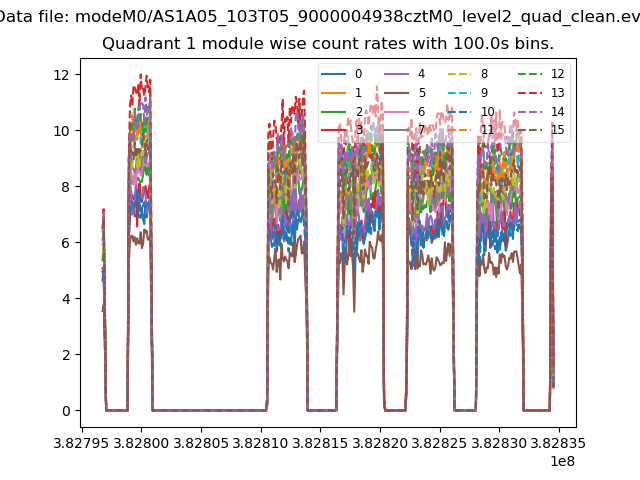
| Module-wise count rates for Quadrant A Data is divided into 100 sec bins |
 |
 |
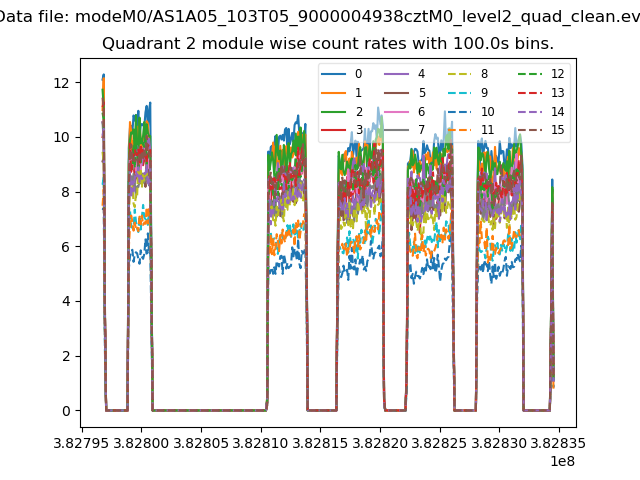
| Module-wise count rates for Quadrant B Data is divided into 100 sec bins |
 |
 |
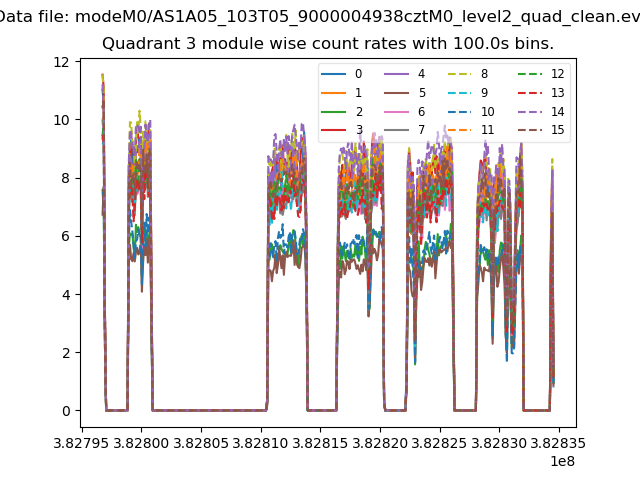
| Module-wise count rates for Quadrant C Data is divided into 100 sec bins |
 |
 |
| Module-wise count rates for Quadrant D Data is divided into 100 sec bins |
 |
 |
| Parameter | Plot |
|---|---|
| CZT HV Monitor |  |
| D_VDD | 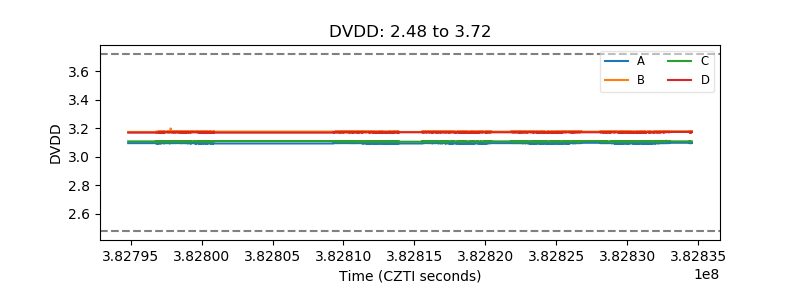 |
| Temperature 1 |  |
| Veto HV Monitor |  |
| Veto LLD | 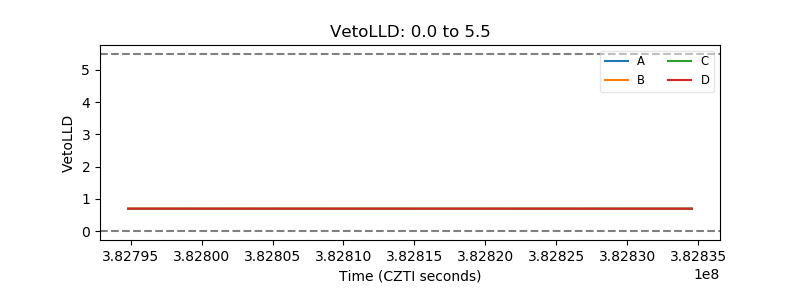 |
| Alpha Counter | 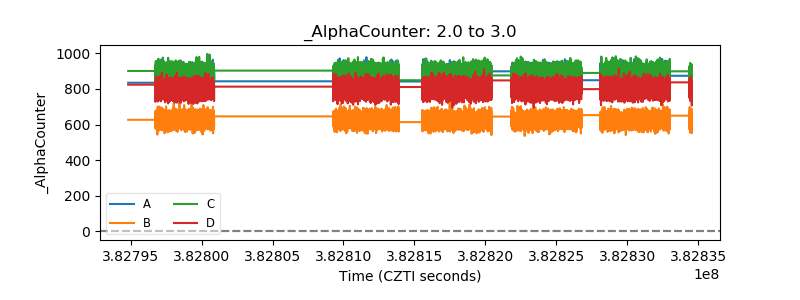 |
| _CPM_Rate | 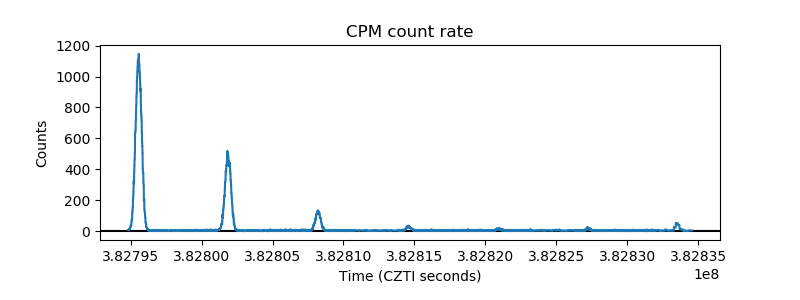 |
| CZT Counter | 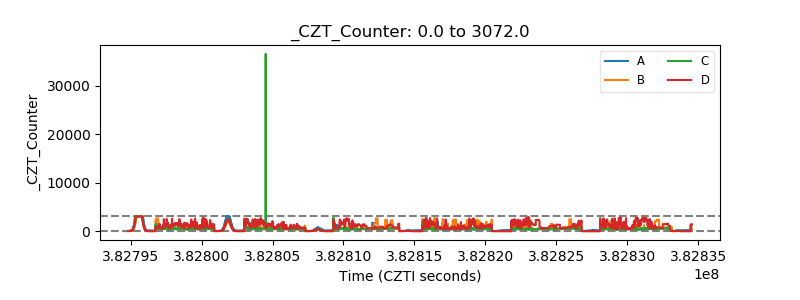 |
| +2.5 Volts monitor | 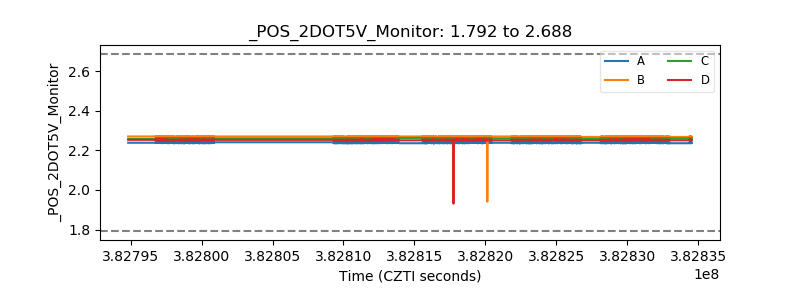 |
| +5 Volts monitor |  |
| _ROLL_ROT |  |
| _Roll_DEC | 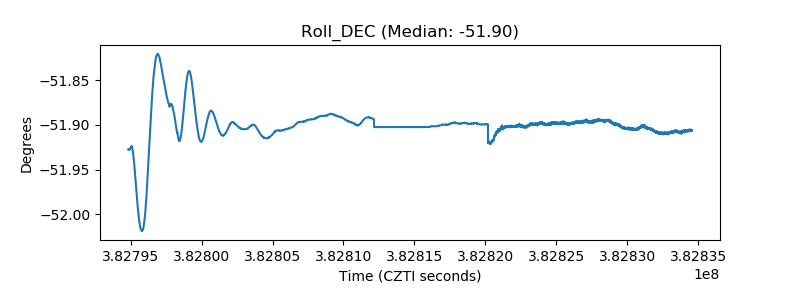 |
| _Roll_RA | 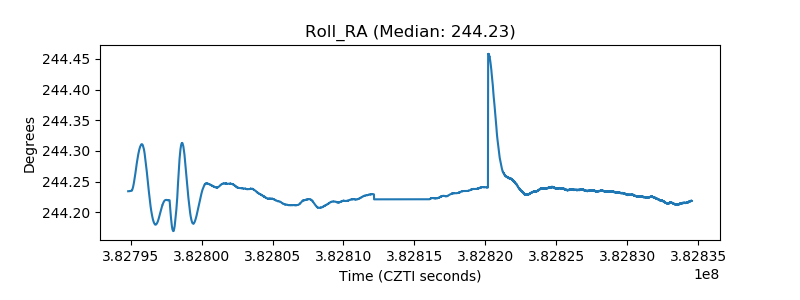 |
| Veto Counter | 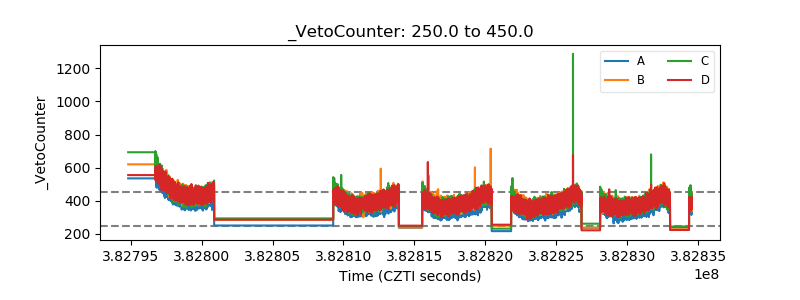 |