| Param | Original file | Final file |
|---|---|---|
| Filename | modeM0/AS1A05_167T01_9000004940_34572cztM0_level2.evt | modeM0/AS1A05_167T01_9000004940_34572cztM0_level2_quad_clean.evt |
| Size (bytes) | 528,367,680 | 79,862,400 |
| Size | 503.9 MB | 76.2 MB |
| Events in quadrant A | 2,958,915 | 513,849 |
| Events in quadrant B | 4,724,330 | 489,163 |
| Events in quadrant C | 2,991,362 | 519,634 |
| Events in quadrant D | 4,929,820 | 486,016 |
| Mode SS | |||
|---|---|---|---|
| Quadrant | BADHDUFLAG | Total packets | Discarded packets |
| A | 0 | 120 | 0 |
| B | 0 | 120 | 0 |
| C | 0 | 120 | 0 |
| D | 0 | 120 | 0 |
| Mode M9 | |||
|---|---|---|---|
| Quadrant | BADHDUFLAG | Total packets | Discarded packets |
| A | 0 | 17 | 0 |
| B | 0 | 17 | 0 |
| C | 0 | 17 | 0 |
| D | 0 | 18 | 0 |
| Mode M0 | |||
|---|---|---|---|
| Quadrant | BADHDUFLAG | Total packets | Discarded packets |
| A | 0 | 12602 | 3 |
| B | 0 | 17931 | 2 |
| C | 0 | 12245 | 2 |
| D | 0 | 18755 | 2 |
| Quadrant | Total seconds | Saturated seconds | Saturation percentage |
|---|---|---|---|
| A | 5857 | 23 | 0.392693% |
| B | 5857 | 675 | 11.524671% |
| C | 5857 | 18 | 0.307325% |
| D | 5857 | 187 | 3.192761% |
Noise dominated data is calculated using 1-second bins in cleaned event files. If a bin has >2000 counts, and if more than 50% of those come from <1% of pixels, then it is considered to be noise-dominated and hence unusable.
| Quadrant | # 1 sec bins | Bins with >0 counts | Bins with >2000 counts | High rate bins dominated by noise | Noise dominated (total time) | Noise dominated (detector-on time) | Marked lightcurve |
|---|---|---|---|---|---|---|---|
| A | 7171 | 5858 | 9 | 9 | 0.13% | 0.15% |  |
| B | 7171 | 5858 | 448 | 448 | 6.25% | 7.65% | 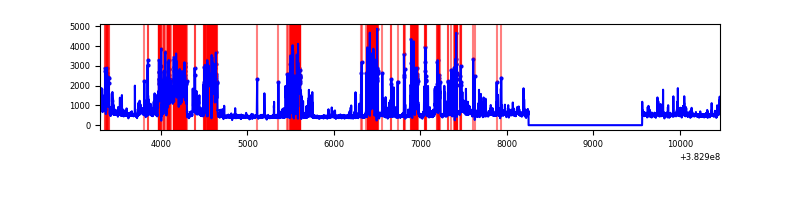 |
| C | 7171 | 5858 | 6 | 6 | 0.08% | 0.10% | 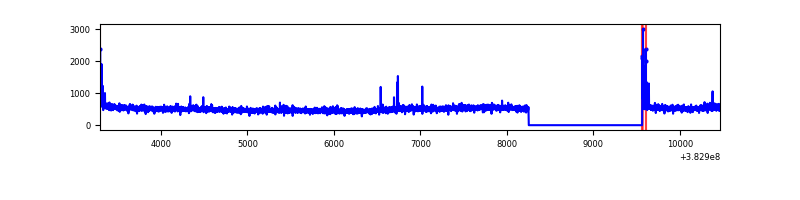 |
| D | 7171 | 5858 | 147 | 147 | 2.05% | 2.51% | 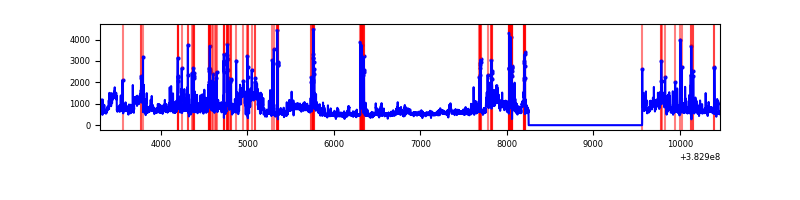 |
Top three noisy pixels from each quadrant. If the there are fewer than three noisy pixels in the level2.evt file, extra rows are filled as -1
| Pixel properties | Quadrant properties | ||||||
|---|---|---|---|---|---|---|---|
| Quadrant | DetID | PixID | Counts | Sigma | Mean | Median | Sigma |
| A | 15 | 174 | 154732 | 1100.64 | 690 | 676 | 140.0 |
| A | 9 | 143 | 49950 | 352.04 | 690 | 676 | 140.0 |
| A | 10 | 83 | 44760 | 314.96 | 690 | 676 | 140.0 |
| B | 5 | 172 | 1840524 | 14649.99 | 655 | 639 | 125.6 |
| B | 0 | 190 | 79752 | 629.93 | 655 | 639 | 125.6 |
| B | 0 | 229 | 53965 | 424.61 | 655 | 639 | 125.6 |
| C | 15 | 214 | 246289 | 1567.02 | 672 | 680 | 156.7 |
| C | 0 | 10 | 55259 | 348.22 | 672 | 680 | 156.7 |
| C | 14 | 67 | 30108 | 187.75 | 672 | 680 | 156.7 |
| D | 8 | 195 | 1410063 | 8601.75 | 664 | 646 | 163.9 |
| D | 1 | 47 | 233938 | 1423.79 | 664 | 646 | 163.9 |
| D | 2 | 250 | 215867 | 1313.51 | 664 | 646 | 163.9 |
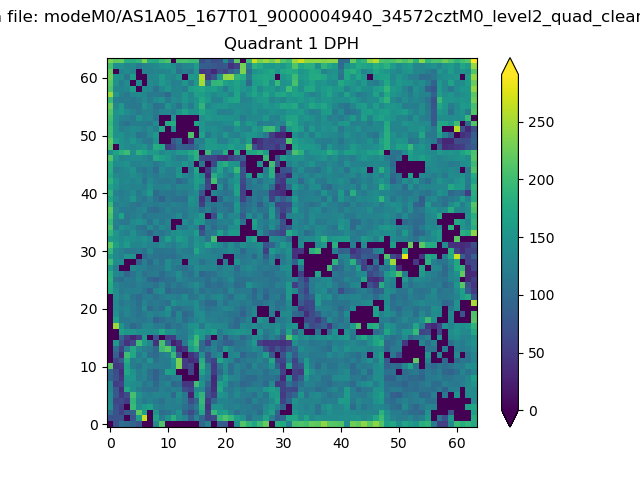
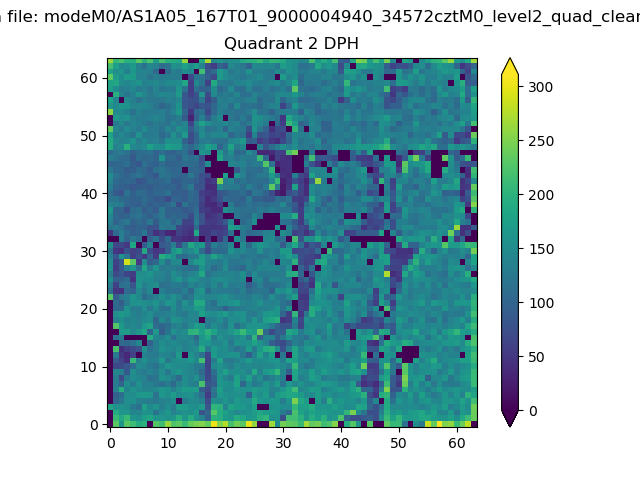
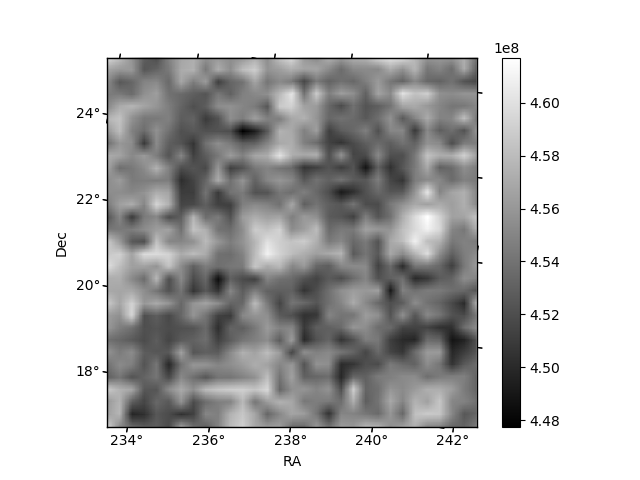
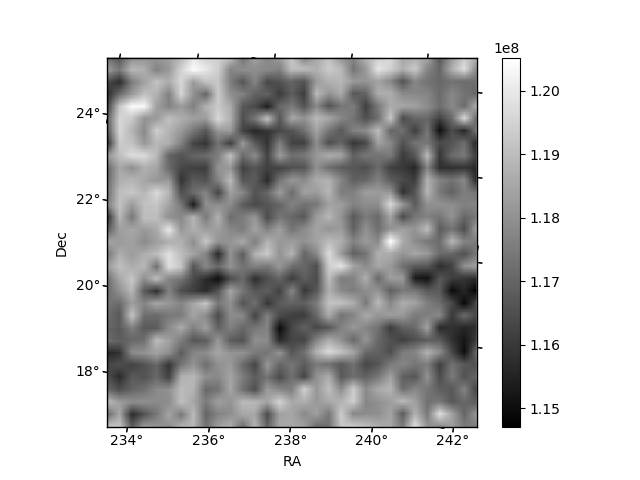
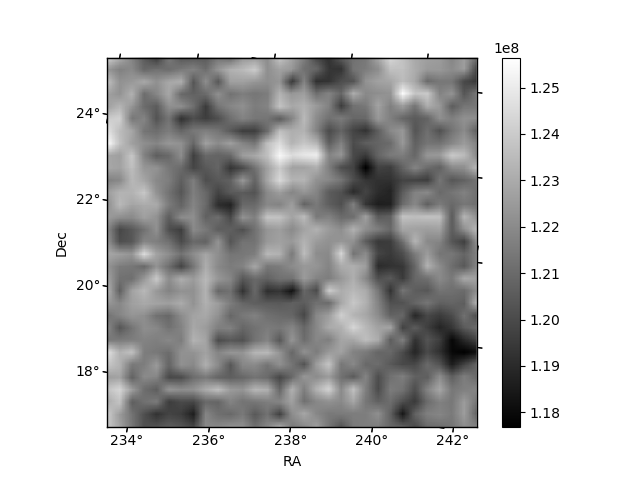
Histogram calculated using DETX and DETY for each event in the final _common_clean file
| Quadrant A | 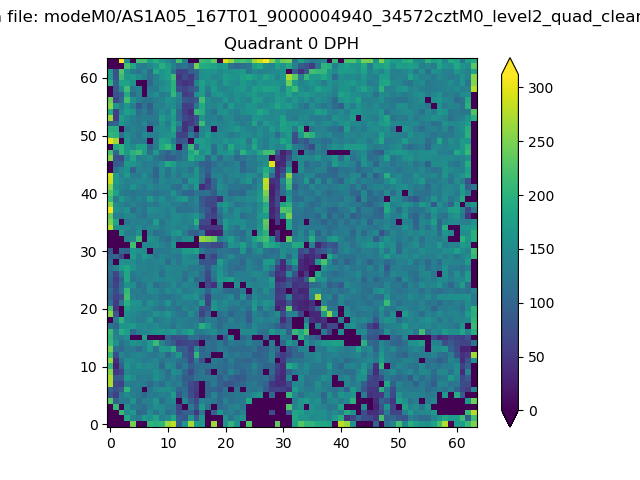 |
 |
Quadrant B |
|---|---|---|---|
| Quadrant D | 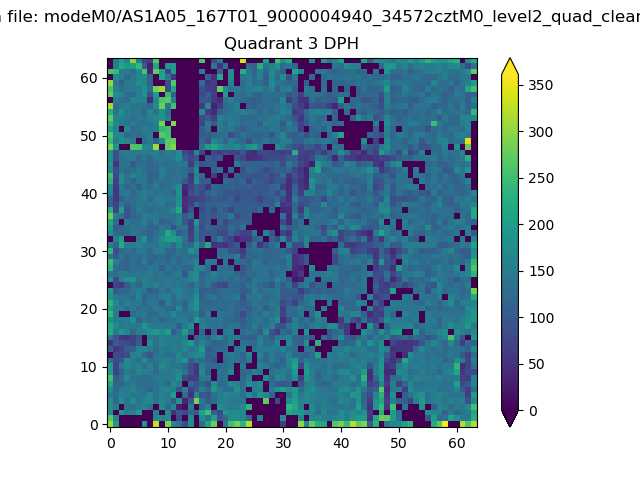 |
 |
Quadrant C |
| Plot type | Count rate plots | Images |
|---|---|---|
| Comparison with Poisson distribution Blue bars denote a histogram of data divided into 1 sec bins. Red curve is a Poisson curve with rate = median count rate of data. |
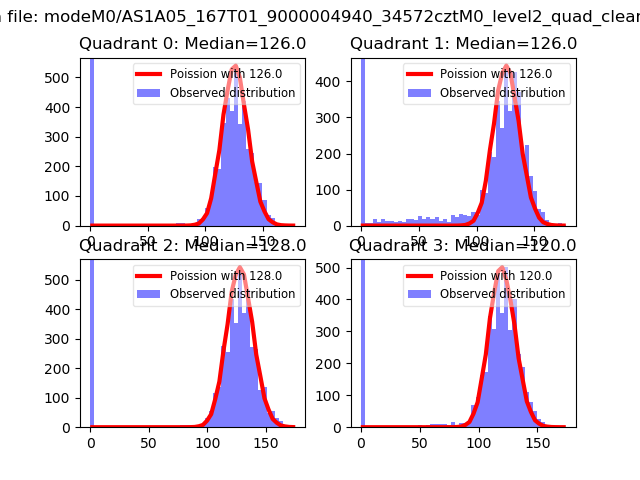 |
 |
| Quadrant-wise count rates Data is divided into 100 sec bins |
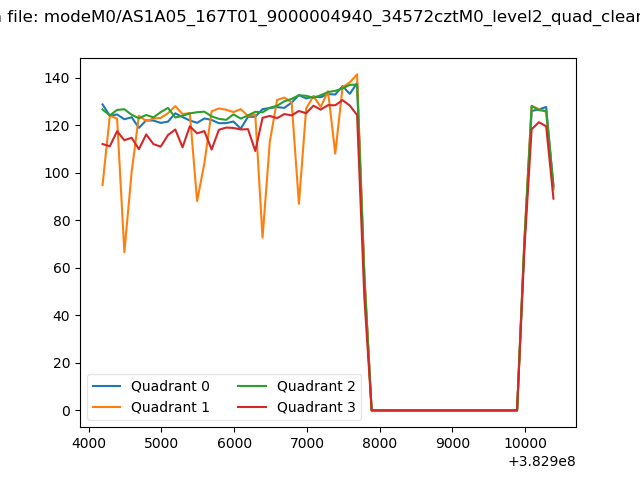 |
|
| Module-wise count rates for Quadrant A Data is divided into 100 sec bins |
 |
 |
| Module-wise count rates for Quadrant B Data is divided into 100 sec bins |
 |
 |
| Module-wise count rates for Quadrant C Data is divided into 100 sec bins |
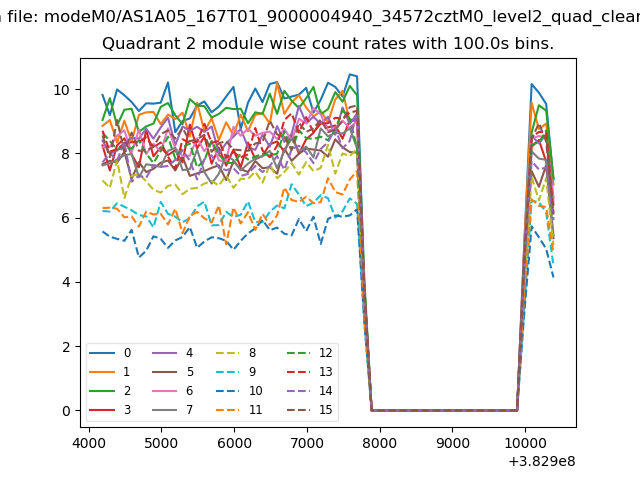 |
 |
| Module-wise count rates for Quadrant D Data is divided into 100 sec bins |
 |
 |
| Parameter | Plot |
|---|---|
| CZT HV Monitor |  |
| D_VDD |  |
| Temperature 1 | 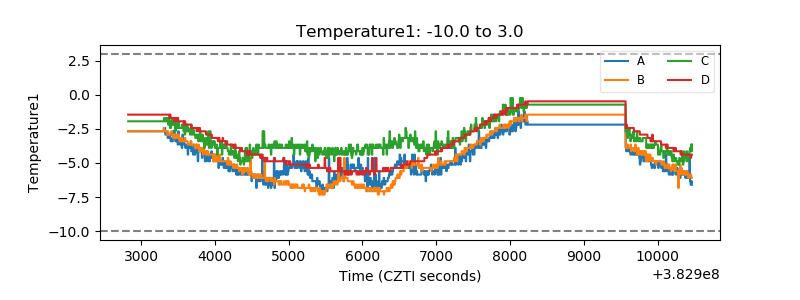 |
| Veto HV Monitor | 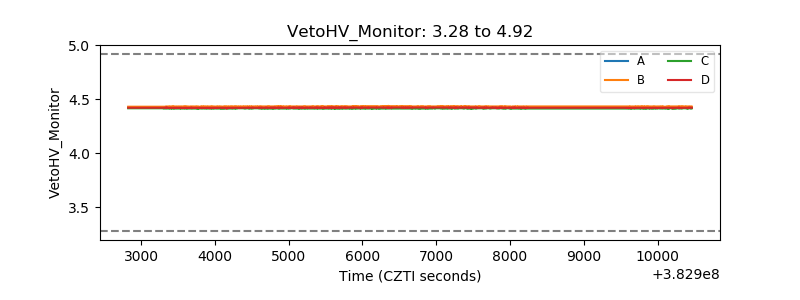 |
| Veto LLD |  |
| Alpha Counter | 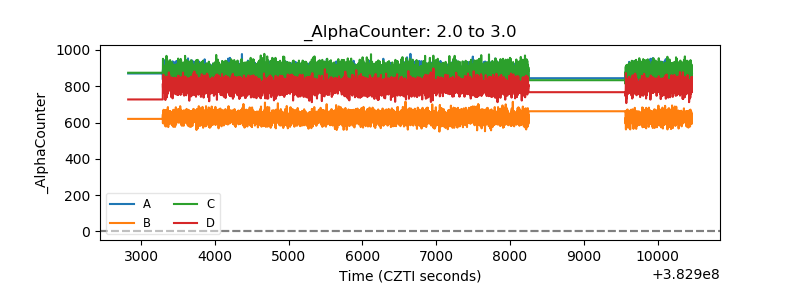 |
| _CPM_Rate | 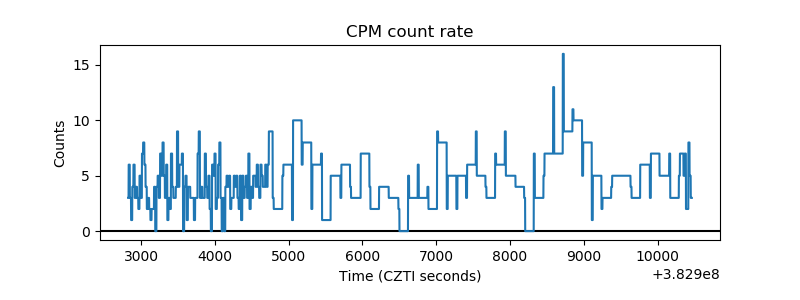 |
| CZT Counter | 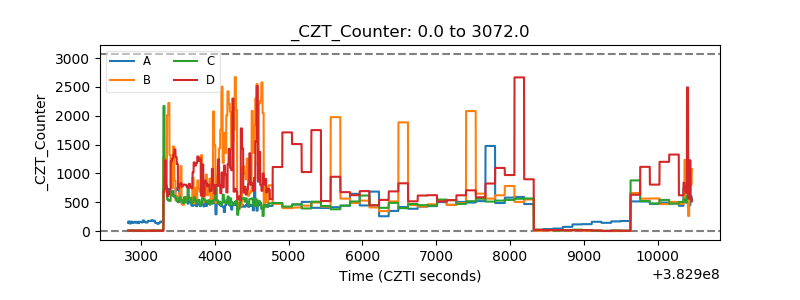 |
| +2.5 Volts monitor |  |
| +5 Volts monitor |  |
| _ROLL_ROT |  |
| _Roll_DEC | 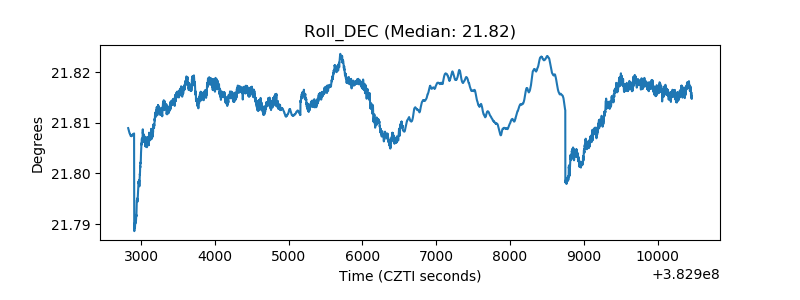 |
| _Roll_RA | 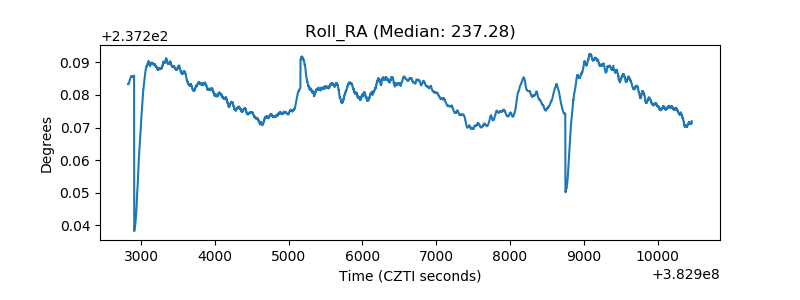 |
| Veto Counter |  |