| Param | Original file | Final file |
|---|---|---|
| Filename | modeM0/AS1A05_176T03_9000004942cztM0_level2.fits | modeM0/AS1A05_176T03_9000004942cztM0_level2_quad_clean.evt |
| Size (bytes) | 69,534,720 | 45,930,240 |
| Size | 66.3 MB | 43.8 MB |
| Events in quadrant A | 453,470 | 255,103 |
| Events in quadrant B | 416,988 | 241,047 |
| Events in quadrant C | 432,348 | 230,299 |
| Events in quadrant D | 343,984 | 204,584 |
| Mode SS | |||
|---|---|---|---|
| Quadrant | BADHDUFLAG | Total packets | Discarded packets |
| A | 0 | 134 | 0 |
| B | 0 | 134 | 0 |
| C | 0 | 134 | 0 |
| D | 0 | 134 | 0 |
| Mode M9 | |||
|---|---|---|---|
| Quadrant | BADHDUFLAG | Total packets | Discarded packets |
| A | 0 | 39 | 0 |
| B | 0 | 39 | 0 |
| C | 0 | 39 | 0 |
| D | 0 | 39 | 0 |
| Mode M0 | |||
|---|---|---|---|
| Quadrant | BADHDUFLAG | Total packets | Discarded packets |
| A | 0 | 13800 | 0 |
| B | 0 | 17946 | 0 |
| C | 0 | 15092 | 0 |
| D | 0 | 32560 | 0 |
| Quadrant | Total seconds | Saturated seconds | Saturation percentage |
|---|---|---|---|
| A | 6577 | 6 | 0.091227% |
| B | 6577 | 224 | 3.405808% |
| C | 6577 | 147 | 2.235062% |
| D | 6577 | 1273 | 19.355329% |
Noise dominated data is calculated using 1-second bins in cleaned event files. If a bin has >2000 counts, and if more than 50% of those come from <1% of pixels, then it is considered to be noise-dominated and hence unusable.
| Quadrant | # 1 sec bins | Bins with >0 counts | Bins with >2000 counts | High rate bins dominated by noise | Noise dominated (total time) | Noise dominated (detector-on time) | Marked lightcurve |
|---|---|---|---|---|---|---|---|
| A | 8699 | 6576 | 0 | 0 | 0.00% | 0.00% | 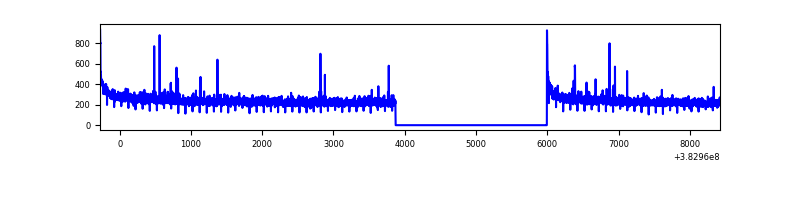 |
| B | 8699 | 6573 | 0 | 0 | 0.00% | 0.00% | 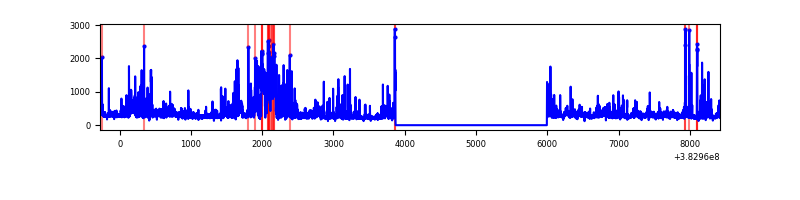 |
| C | 8699 | 6567 | 0 | 0 | 0.00% | 0.00% | 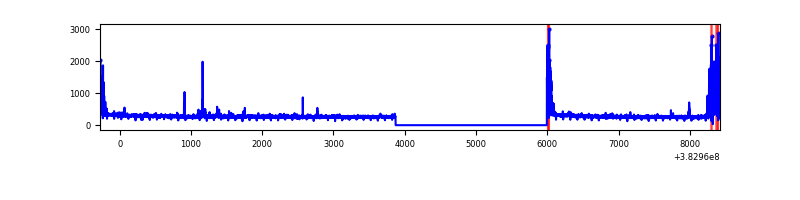 |
| D | 8699 | 6558 | 0 | 0 | 0.00% | 0.00% |  |
Top three noisy pixels from each quadrant. If the there are fewer than three noisy pixels in the level2.evt file, extra rows are filled as -1
| Pixel properties | Quadrant properties | ||||||
|---|---|---|---|---|---|---|---|
| Quadrant | DetID | PixID | Counts | Sigma | Mean | Median | Sigma |
| A | 0 | 29 | 358 | 8.11 | 118 | 112 | 30.3 |
| A | 9 | 19 | 345 | 7.68 | 118 | 112 | 30.3 |
| A | 14 | 79 | 335 | 7.35 | 118 | 112 | 30.3 |
| B | 2 | 9 | 340 | 9.89 | 110 | 106 | 23.7 |
| B | 3 | 80 | 311 | 8.66 | 110 | 106 | 23.7 |
| B | 3 | 17 | 300 | 8.2 | 110 | 106 | 23.7 |
| C | 1 | 80 | 323 | 6.94 | 114 | 109 | 30.8 |
| C | 1 | 81 | 312 | 6.59 | 114 | 109 | 30.8 |
| C | 9 | 188 | 301 | 6.23 | 114 | 109 | 30.8 |
| D | 10 | 113 | 278 | 6.95 | 98 | 90 | 27.0 |
| D | 4 | 160 | 250 | 5.92 | 98 | 90 | 27.0 |
| D | 6 | 62 | 245 | 5.73 | 98 | 90 | 27.0 |
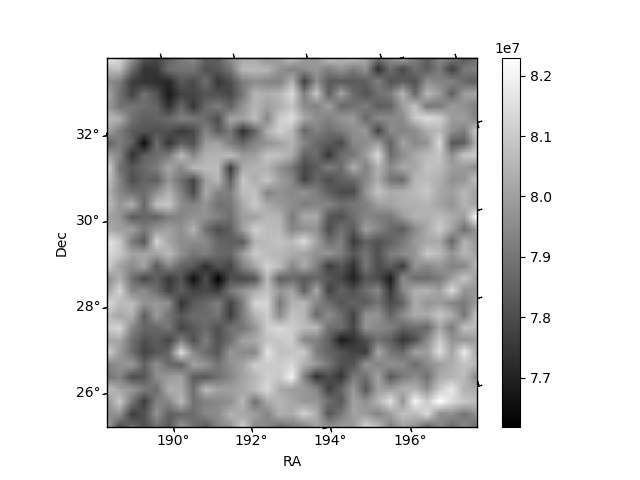
Histogram calculated using DETX and DETY for each event in the final _common_clean file
| Quadrant A |  |
 |
Quadrant B |
|---|---|---|---|
| Quadrant D |  |
 |
Quadrant C |
| Plot type | Count rate plots | Images |
|---|---|---|
| Comparison with Poisson distribution Blue bars denote a histogram of data divided into 1 sec bins. Red curve is a Poisson curve with rate = median count rate of data. |
 |
 |
| Quadrant-wise count rates Data is divided into 100 sec bins |
 |
|
| Module-wise count rates for Quadrant A Data is divided into 100 sec bins |
 |
 |
| Module-wise count rates for Quadrant B Data is divided into 100 sec bins |
 |
 |
| Module-wise count rates for Quadrant C Data is divided into 100 sec bins |
 |
 |
| Module-wise count rates for Quadrant D Data is divided into 100 sec bins |
 |
 |
| Parameter | Plot |
|---|---|
| CZT HV Monitor | 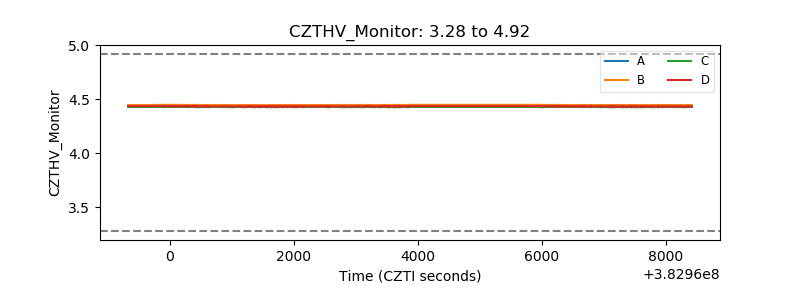 |
| D_VDD | 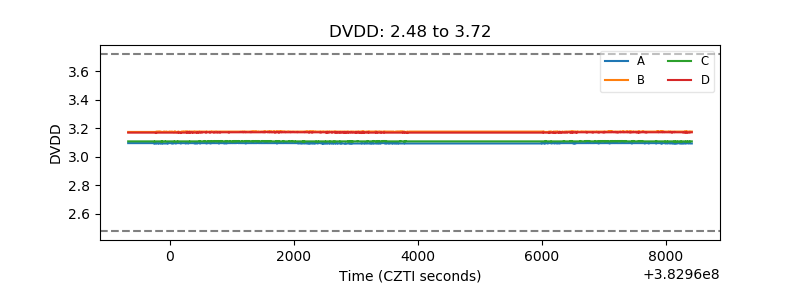 |
| Temperature 1 | 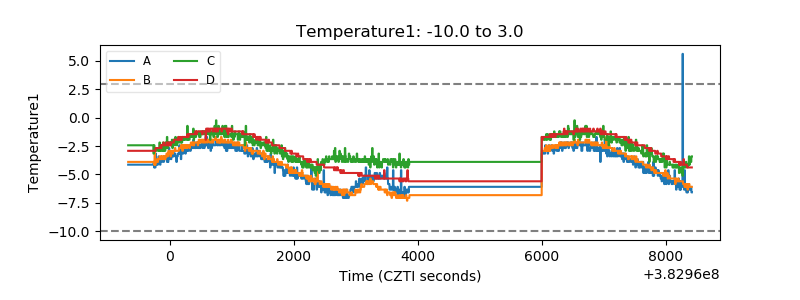 |
| Veto HV Monitor |  |
| Veto LLD | 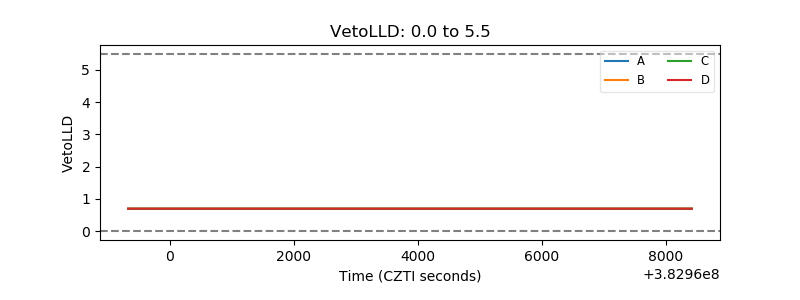 |
| Alpha Counter |  |
| _CPM_Rate |  |
| CZT Counter |  |
| +2.5 Volts monitor | 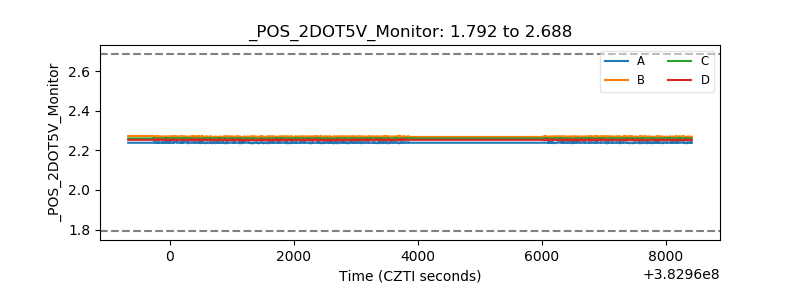 |
| +5 Volts monitor | 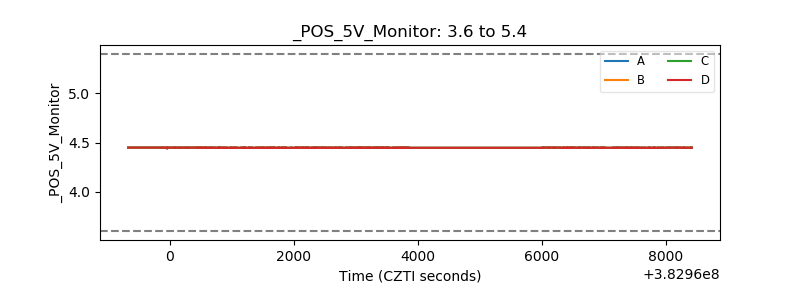 |
| _ROLL_ROT |  |
| _Roll_DEC |  |
| _Roll_RA |  |
| Veto Counter |  |