| Param | Original file | Final file |
|---|---|---|
| Filename | modeM0/AS1A05_176T05_9000004944cztM0_level2.fits | modeM0/AS1A05_176T05_9000004944cztM0_level2_quad_clean.evt |
| Size (bytes) | 73,048,320 | 62,971,200 |
| Size | 69.7 MB | 60.1 MB |
| Events in quadrant A | 457,988 | 375,471 |
| Events in quadrant B | 433,978 | 374,493 |
| Events in quadrant C | 449,588 | 363,385 |
| Events in quadrant D | 341,960 | 264,349 |
| Mode SS | |||
|---|---|---|---|
| Quadrant | BADHDUFLAG | Total packets | Discarded packets |
| A | 0 | 156 | 0 |
| B | 0 | 156 | 0 |
| C | 0 | 156 | 0 |
| D | 0 | 156 | 0 |
| Mode M9 | |||
|---|---|---|---|
| Quadrant | BADHDUFLAG | Total packets | Discarded packets |
| A | 0 | 41 | 0 |
| B | 0 | 41 | 0 |
| C | 0 | 41 | 0 |
| D | 0 | 41 | 0 |
| Mode M0 | |||
|---|---|---|---|
| Quadrant | BADHDUFLAG | Total packets | Discarded packets |
| A | 0 | 15589 | 0 |
| B | 0 | 17346 | 0 |
| C | 0 | 16482 | 0 |
| D | 0 | 39836 | 0 |
| Quadrant | Total seconds | Saturated seconds | Saturation percentage |
|---|---|---|---|
| A | 7596 | 12 | 0.157978% |
| B | 7596 | 96 | 1.263823% |
| C | 7596 | 49 | 0.645076% |
| D | 7596 | 1662 | 21.879937% |
Noise dominated data is calculated using 1-second bins in cleaned event files. If a bin has >2000 counts, and if more than 50% of those come from <1% of pixels, then it is considered to be noise-dominated and hence unusable.
| Quadrant | # 1 sec bins | Bins with >0 counts | Bins with >2000 counts | High rate bins dominated by noise | Noise dominated (total time) | Noise dominated (detector-on time) | Marked lightcurve |
|---|---|---|---|---|---|---|---|
| A | 11662 | 7596 | 0 | 0 | 0.00% | 0.00% |  |
| B | 11662 | 7596 | 0 | 0 | 0.00% | 0.00% |  |
| C | 11662 | 7596 | 0 | 0 | 0.00% | 0.00% |  |
| D | 11662 | 7575 | 0 | 0 | 0.00% | 0.00% |  |
Top three noisy pixels from each quadrant. If the there are fewer than three noisy pixels in the level2.evt file, extra rows are filled as -1
| Pixel properties | Quadrant properties | ||||||
|---|---|---|---|---|---|---|---|
| Quadrant | DetID | PixID | Counts | Sigma | Mean | Median | Sigma |
| A | 0 | 29 | 410 | 9.69 | 119 | 113 | 30.6 |
| A | 0 | 30 | 383 | 8.81 | 119 | 113 | 30.6 |
| A | 7 | 110 | 364 | 8.19 | 119 | 113 | 30.6 |
| B | 2 | 9 | 398 | 11.5 | 114 | 110 | 25.0 |
| B | 3 | 80 | 361 | 10.03 | 114 | 110 | 25.0 |
| B | 2 | 8 | 338 | 9.11 | 114 | 110 | 25.0 |
| C | 1 | 80 | 398 | 8.93 | 118 | 111 | 32.1 |
| C | 1 | 81 | 388 | 8.62 | 118 | 111 | 32.1 |
| C | 3 | 202 | 361 | 7.78 | 118 | 111 | 32.1 |
| D | 7 | 3 | 274 | 6.85 | 97 | 90 | 26.9 |
| D | 15 | 46 | 260 | 6.33 | 97 | 90 | 26.9 |
| D | 4 | 160 | 249 | 5.92 | 97 | 90 | 26.9 |
Histogram calculated using DETX and DETY for each event in the final _common_clean file
| Quadrant A | 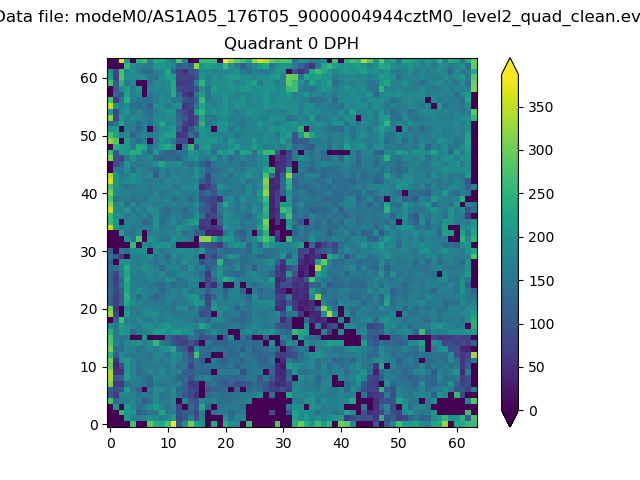 |
 |
Quadrant B |
|---|---|---|---|
| Quadrant D |  |
 |
Quadrant C |
| Plot type | Count rate plots | Images |
|---|---|---|
| Comparison with Poisson distribution Blue bars denote a histogram of data divided into 1 sec bins. Red curve is a Poisson curve with rate = median count rate of data. |
 |
 |
| Quadrant-wise count rates Data is divided into 100 sec bins |
 |
|
| Module-wise count rates for Quadrant A Data is divided into 100 sec bins |
 |
 |
| Module-wise count rates for Quadrant B Data is divided into 100 sec bins |
 |
 |
| Module-wise count rates for Quadrant C Data is divided into 100 sec bins |
 |
 |
| Module-wise count rates for Quadrant D Data is divided into 100 sec bins |
 |
 |
| Parameter | Plot |
|---|---|
| CZT HV Monitor |  |
| D_VDD |  |
| Temperature 1 |  |
| Veto HV Monitor |  |
| Veto LLD |  |
| Alpha Counter |  |
| _CPM_Rate |  |
| CZT Counter |  |
| +2.5 Volts monitor |  |
| +5 Volts monitor |  |
| _ROLL_ROT |  |
| _Roll_DEC |  |
| _Roll_RA |  |
| Veto Counter |  |